DXY Climbs to $99.95: Will the Rally Continue?
The Dollar Index (DXY) is trading at $99.95, up 0.55% today, driven by strong bullish momentum. Will this rally persist amid mixed economic signals?
The Dollar Index (DXY) is exhibiting notable strength, currently trading at $99.95, marking a 0.55% increase today. This upward momentum is fueled by a confluence of factors, including robust bullish trends across multiple timeframes and positive macroeconomic indicators. However, traders should exercise caution as the index approaches overbought conditions, potentially signaling a near-term pullback. What are the key levels to watch as the DXY navigates this critical juncture?
- RSI at 71.31 on the 1H chart signals overbought pressure, suggesting a possible short-term pullback.
- Critical resistance lies at 100.1, a key level for bulls to overcome to sustain the rally.
- ADX at 40.74 indicates a strong uptrend, confirming the bullish momentum across multiple timeframes.
- DXY strength is pressuring EURUSD and other major pairs, driving bearish sentiment in those markets.
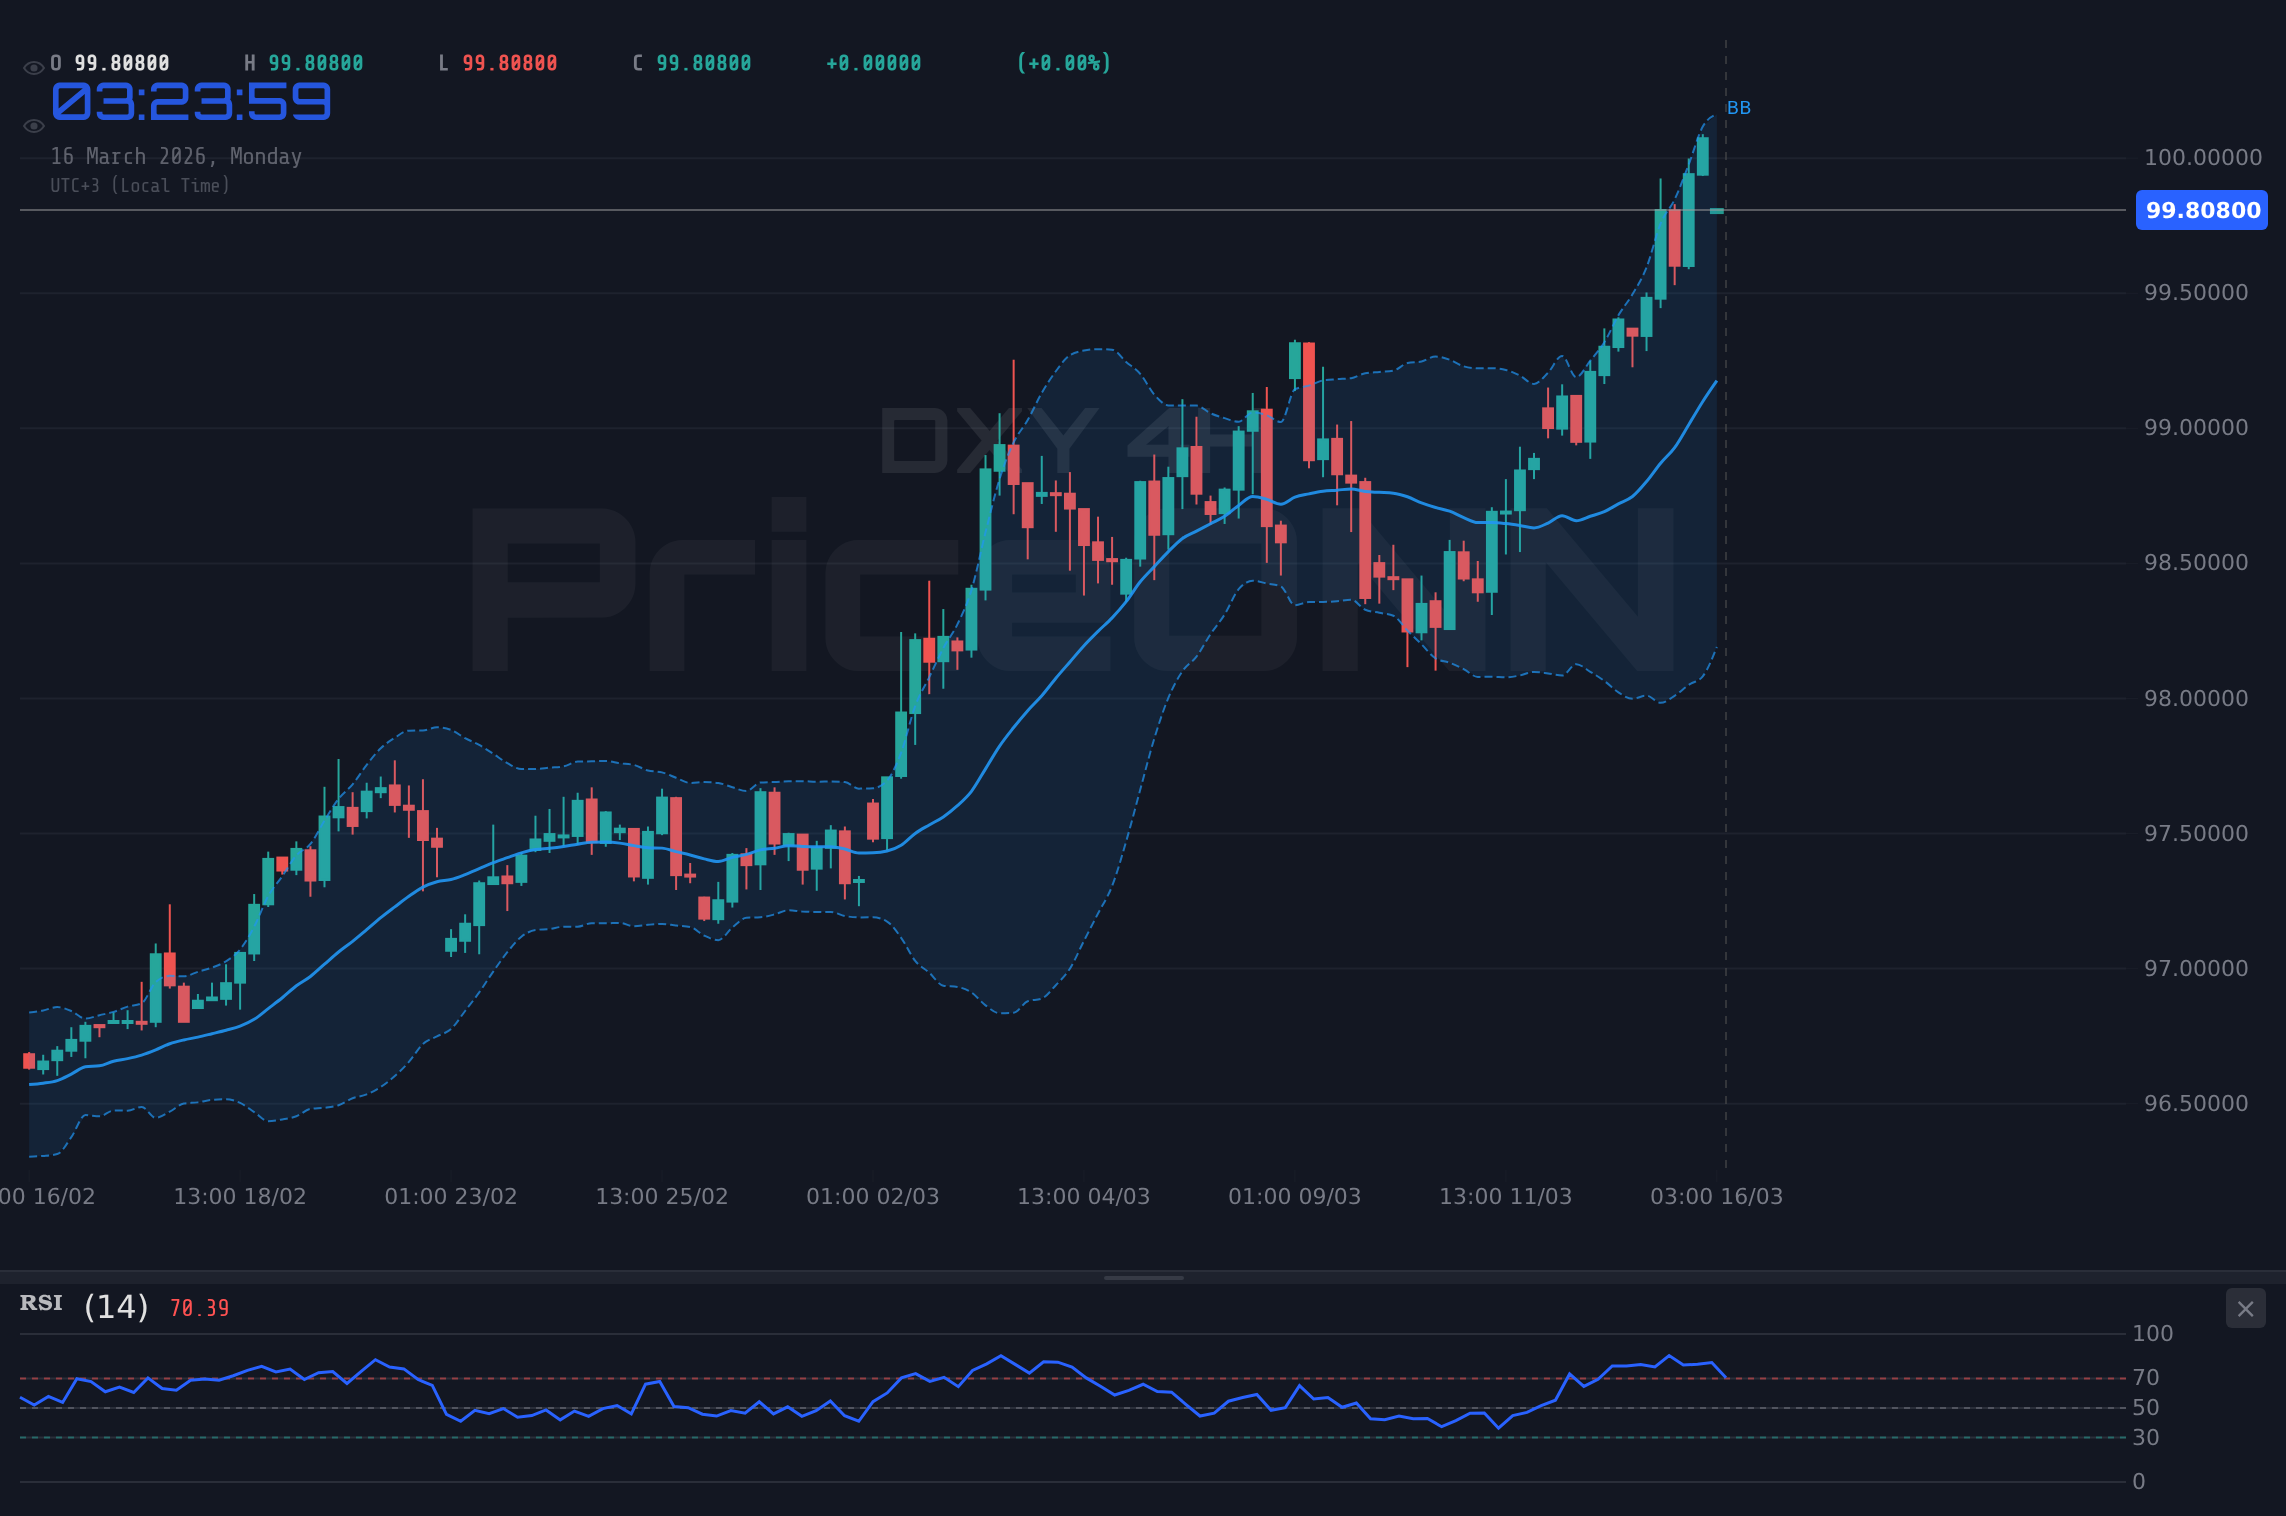
The DXY's rise is underpinned by strong bullish trends evident in the 1-hour, 4-hour, and daily timeframes. The 1H chart displays a robust uptrend with a strength of 95%, supported by an ADX of 40.74. This indicates that the current bullish momentum is significant, suggesting that the DXY may continue its ascent in the short term. However, the RSI on the 1H chart is at 71.31, entering overbought territory, which could lead to a period of consolidation or a minor retracement as traders take profits.
Looking at the 4H timeframe, the bullish trend remains intact, boasting a strength of 100%. The RSI, while still elevated at 69.89, has not yet reached overbought levels, suggesting there may be room for further upside. The MACD histogram is also positive, indicating sustained bullish momentum. Key resistance to watch on this timeframe is 100.1, a level that, if breached, could open the door for further gains. Conversely, support sits at 99.69, a level that needs to hold to prevent a deeper correction.
Click to expand
The daily chart reinforces the bullish narrative, with a 100% trend strength. However, the RSI is flashing a warning sign, currently at 73.21 and entering overbought territory. This suggests that the DXY may be due for a more significant pullback in the medium term. Key resistance on this timeframe is 99.58, while support lies at 99.06. The Stochastic oscillator, with K=90.59, is also signaling overbought conditions, further corroborating the potential for a retracement.
From a fundamental perspective, the DXY's strength is likely influenced by expectations surrounding future Federal Reserve policy. Recent economic data releases have painted a mixed picture, with some indicators suggesting continued strength in the US economy while others point to potential slowdowns. This has created uncertainty regarding the Fed's next move, with some analysts anticipating further interest rate hikes while others believe the Fed may soon pause its tightening cycle. The DXY's reaction to these shifting expectations will be critical in determining its future trajectory.
The recent news of Saudi Arabia scaling back its ambitious NEOM project, as reported on March 15, could have indirect implications for the DXY. The project's revision may impact global energy prices and risk sentiment, subsequently influencing the dollar's strength as investors assess the broader economic ramifications. Additionally, geopolitical tensions, such as those highlighted by the potential Asian energy crisis triggered by the Qatar LNG shutdown, could further drive safe-haven demand for the dollar, supporting the DXY.
The DXY's strength is putting downward pressure on several major currency pairs. EURUSD, currently trading at 1.14454, is down 0.56% today. The pair is exhibiting bearish trends across all timeframes, with the 1H, 4H, and daily charts all indicating a strong downtrend. The RSI on the daily chart is particularly concerning, sitting at 23.59 and deeply oversold. This suggests that EURUSD may be due for a bounce in the near term, but the overall trend remains bearish. Key resistance to watch is 1.14725, while support lies at 1.14221.
GBPUSD is also feeling the pressure, trading at 1.32567, down 0.62% today. Similar to EURUSD, GBPUSD is displaying bearish trends across all timeframes. The 1H chart shows a strong downtrend with an ADX of 44.07, while the RSI on the 4H chart is oversold at 29.41. Key resistance is at 1.32755, and support is at 1.32217. The economic calendar is relatively light this week, with only a few high-impact events scheduled. However, traders will be closely watching any comments from central bank officials for clues regarding future monetary policy.
USDJPY is bucking the trend, trading at 159.436, up 0.08% today. The pair is displaying bullish trends across most timeframes, with the 4H and daily charts indicating a strong uptrend. The RSI on the daily chart is elevated at 68.84, but not yet in overbought territory. Key resistance is at 159.633, while support lies at 159.209. The Bank of Japan's (BoJ) monetary policy will continue to be a key driver for USDJPY, with any hints of a shift in policy potentially triggering significant volatility.
Commodities are also reacting to the DXY's strength. Gold (XAUUSD) is currently trading at $5,020.83, down 1.14% today. The metal is exhibiting bearish trends across all timeframes, with the 1H, 4H, and daily charts all indicating a downtrend. The RSI on the daily chart is neutral at 47.81. Key resistance is at $5,036.46, while support lies at $5,007.13. Silver (XAGUSD) is also under pressure, trading at $81.18, down 3.15% today. The metal is displaying bearish trends, with the 1H chart showing a strong downtrend and an ADX of 41.3. Key resistance is at $80.88, and support is at $79.7.
Brent crude oil is trading at $103.42, up 1.71% today. The energy commodity is displaying bullish trends across all timeframes, with the 1H chart showing a strong uptrend. The RSI on the daily chart is elevated at 87.29, indicating overbought conditions. Key resistance is at $103.9, while support lies at $101.29. WTI crude oil is also on the rise, trading at $98.38, up 2.26% today. The commodity is displaying bullish trends, with the 1H chart showing a strong uptrend. The RSI on the daily chart is elevated at 82.51, indicating overbought conditions. Key resistance is at $99.25, and support is at $98.55.
Frequently Asked Questions: DXY Analysis
What happens if DXY breaks above 100.1 resistance?
If the DXY breaks above the 100.1 resistance level, as indicated by the 4H chart, it could signal further gains and open the door for a sustained rally. This breakout would likely be driven by continued bullish momentum and positive macroeconomic data, potentially targeting higher resistance levels.
Should I buy DXY at current levels of $99.95 given the RSI at 71.31?
Given the RSI at 71.31 on the 1H chart, which is entering overbought territory, it might be prudent to exercise caution before initiating new long positions at the current level of $99.95. A period of consolidation or a minor retracement is possible, offering potentially better entry points.
Is the elevated ADX of 40.74 on the 1H chart a reliable signal for a continued uptrend?
The elevated ADX of 40.74 on the 1H chart does indicate a strong uptrend for the DXY, suggesting that the bullish momentum is significant. However, traders should also consider other factors, such as overbought conditions signaled by the RSI, to assess the sustainability of the trend.
How will Friday's GBP high impact data releases affect DXY this week?
Friday's GBP high impact data releases will be closely watched for their potential impact on the DXY this week. If the data comes in weaker than expected, it could further strengthen the dollar, driving the DXY higher. Conversely, stronger-than-expected data could lead to a pullback in the DXY.
Overall, the DXY is exhibiting significant strength, driven by a confluence of bullish trends and positive macroeconomic indicators. However, traders should exercise caution as the index approaches overbought conditions, potentially signaling a near-term pullback. Monitor key resistance and support levels, and stay informed about upcoming economic data releases to navigate this critical juncture effectively.
Track markets in real-time
AI-powered analysis, technical indicators and real-time price data.
Join Our Telegram Channel
Breaking market news, AI analysis and trading signals instantly.
Join Channel