SP500 Retreats to $6,624.87; Is This a Buying Opportunity?
The SP500 dipped to $6,624.87 amid risk-off sentiment. Is this a temporary pullback or the start of a deeper correction? Key levels to watch.
The SP500's retreat to $6,624.87 last Friday close has traders wondering if this is a temporary dip or the beginning of a more significant correction. The index, heavily influenced by tech stocks, is reacting to a complex mix of factors, including rising Treasury yields, a strengthening dollar, and escalating geopolitical tensions in the Middle East. Having tracked SP500 through periods of volatility, it's crucial to analyze this pullback within the broader macroeconomic context.
- SP500 closed at $6,624.87, down 0.82% on the day, signaling a risk-off sentiment.
- Key support level to watch sits at $6,606.9, a break below which could trigger further selling.
- The ADX at 37.61 on the daily chart confirms a strong downtrend.
- Rising DXY, currently at 100.07, is putting downward pressure on the SP500.
Why the SP500's Decline Matters
The SP500's recent decline is more than just a blip on the radar; it reflects a confluence of factors that are reshaping the market landscape. The dollar index (DXY) has broken above 100, driven by escalating geopolitical tensions and surging oil prices, fueling safe-haven demand. This DXY strength is directly impacting the SP500, as a stronger dollar often leads to decreased earnings for multinational corporations listed on the index. The recent surge in jet fuel prices, as reported by PriceONN, to between $150 and $200 a barrel amid escalating tensions in the Middle East, adds further pressure, potentially impacting airline profitability and consumer spending. Moreover, the market is closely watching upcoming economic data releases, particularly those related to inflation and employment, for clues about the Federal Reserve's next move. The absence of high-impact events on the immediate economic calendar suggests the market will be driven by existing sentiment and technical factors in the short term.
Technical Breakdown: Key Levels to Watch
From a technical perspective, the SP500's daily chart reveals a clear downtrend, as confirmed by the ADX at 37.61. This suggests that the current selling pressure is not just a temporary pullback but a sustained move. Key support levels to watch are at $6,606.9, $6,547.6. A break below $6,606.9 could open the door for a test of $6,547.6. On the upside, resistance lies at $6,738.8 and $6,798.1. The RSI at 33.56 indicates that the SP500 is approaching oversold territory, which could trigger a short-term bounce. However, the MACD remains in negative territory, suggesting that the overall trend is still bearish.
The Bull Case: Is a Rebound Possible?
Despite the bearish signals, there are reasons to believe that the SP500 could stage a rebound. The RSI at 33.56 suggests that the index is nearing oversold conditions, which could attract bargain hunters. Moreover, the SP500 has a history of strong rallies following periods of consolidation. If the dollar weakens or if positive economic data emerges, the SP500 could quickly recover. One potential catalyst could be a resolution to the geopolitical tensions in the Middle East, which would likely boost risk appetite. However, for the bullish scenario to play out, the SP500 needs to hold above the $6,606.9 support level. A sustained break above the $6,738.8 resistance would further confirm the bullish thesis.
The Bear Case: Is This the Start of a Deeper Correction?
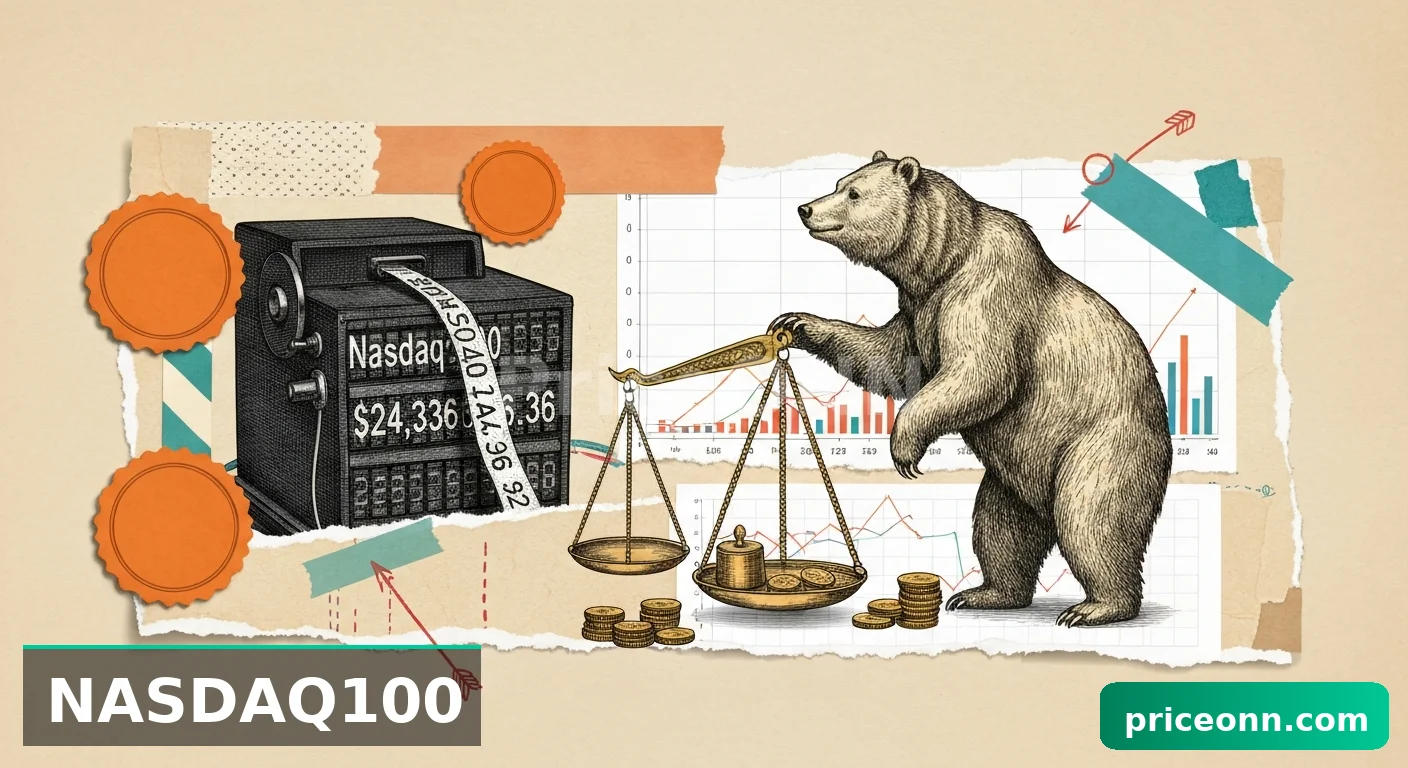
On the other hand, there are compelling arguments for a deeper correction. The rising dollar, driven by geopolitical tensions and surging oil prices, is likely to continue to weigh on the SP500. Moreover, concerns about inflation and the Federal Reserve's monetary policy could trigger further selling. If the SP500 breaks below the $6,606.9 support level, it could trigger a cascade of stop-loss orders, leading to a sharp decline. The overall trend, as confirmed by the ADX, remains bearish, and the MACD is in negative territory. The fact that the Nasdaq100 is showing similar weakness, currently at 24336.36 and trending downward, reinforces the bearish case.
Multi-Timeframe Analysis: What Different Traders Should Watch
Different types of traders will be watching different signals and levels. Scalpers will be focused on the 1-hour chart, where the RSI at 34.89 suggests further downside potential. Day traders will be monitoring the 4-hour chart, where the key support level is at $6,641.77. Swing traders will be paying close attention to the daily chart, where the overall trend is bearish. Long-term investors will be looking for signs of a bottom before adding to their positions. It's crucial to align your trading strategy with your time horizon and risk tolerance.
Correlation Analysis: The DXY's Impact
The DXY's strength is a critical factor in the SP500's recent decline. With the DXY at 100.07, the SP500 is under significant pressure. A rising dollar makes U.S. exports more expensive, which can hurt the earnings of multinational corporations listed on the SP500. Moreover, a stronger dollar often leads to lower commodity prices, which can negatively impact energy and materials stocks. The inverse relationship between the DXY and the SP500 is a well-established pattern, and traders should pay close attention to the DXY's movements to gauge the SP500's likely direction. The rise of the DXY is also connected to the rise of Brent and WTI crude oil.
Economic Calendar and Fundamental Drivers
While there are no high-impact economic events scheduled for today, traders should be aware of upcoming data releases that could impact the SP500. The market is particularly sensitive to inflation data, as it will influence the Federal Reserve's monetary policy decisions. Stronger-than-expected inflation data could lead to higher interest rates, which would likely weigh on the SP500. Conversely, weaker-than-expected inflation data could ease concerns about rate hikes and provide a boost to the index. Furthermore, traders should monitor geopolitical developments, as escalating tensions could further fuel safe-haven demand and put downward pressure on the SP500. The lack of high impact events on Friday, March 13th suggest that the SP500 will be driven by existing sentiment and technical factors in the short term.
Market Sentiment Analysis: Fear Grips the Market
Market sentiment is currently bearish, as evidenced by the SP500's decline and the rising DXY. Traders are concerned about inflation, interest rates, and geopolitical risks. This fear is driving investors to seek safe-haven assets, such as the dollar and U.S. Treasuries. The volatility index (VIX) has also risen, indicating increased uncertainty and risk aversion. The overall market tone is cautious, and traders are likely to remain on the sidelines until there is more clarity about the economic outlook. The current market sentiment analysis suggests that the SP500 is likely to remain under pressure in the near term.
Volatility Analysis: Expect Choppy Trading
Volatility is likely to remain elevated in the SP500, as traders grapple with a complex mix of factors. The index is likely to experience choppy trading, with sharp swings in both directions. Traders should be prepared for sudden reversals and unexpected news events. The key is to manage risk carefully and avoid over-leveraging positions. Volatility is creating opportunities for both bulls and bears, but it also requires a disciplined approach and a clear understanding of the market dynamics.
Frequently Asked Questions: SP500 Analysis
What happens if SP500 breaks below $6,606.9 support?
If the SP500 breaks below the $6,606.9 support level, it could trigger a cascade of stop-loss orders, leading to a sharp decline towards $6,547.6. This would confirm the bearish trend and open the door for further downside potential. Traders should watch for increased selling pressure and a surge in volatility.
Should I buy SP500 at current levels of $6,624.87 given the RSI at 33.56?
While the RSI at 33.56 suggests that the SP500 is nearing oversold conditions, it's not necessarily a buy signal. The overall trend remains bearish, and the MACD is in negative territory. Traders should wait for confirmation of a bottom before adding to their positions. A sustained break above the $6,738.8 resistance would be a more bullish signal.
Is the MACD signal on the daily chart a reliable indicator for SP500 trend analysis?
The MACD on the daily chart is currently in negative territory, which suggests that the overall trend is bearish. However, it's important to note that the MACD is a lagging indicator, and it can sometimes generate false signals. Traders should use the MACD in conjunction with other technical indicators and fundamental analysis to confirm the trend.
How will the Fed's upcoming decisions affect SP500 this week?
The SP500 is highly sensitive to the Federal Reserve's monetary policy decisions. If the Fed signals that it plans to raise interest rates further, it could weigh on the SP500. Conversely, if the Fed signals that it plans to pause or cut interest rates, it could provide a boost to the index. Traders should closely monitor the Fed's communications and economic data releases for clues about its likely course of action.
Track markets in real-time
Empower your investment decisions with AI-powered analysis, technical indicators and real-time price data.