The cryptocurrency market, led by Bitcoin (BTCUSD), ended the past week in a decidedly neutral fashion, with the primary digital asset consolidating around the critical $67,071 level. This indecision reflects a broader market tension, a tug-of-war between persistent institutional interest and growing macroeconomic headwinds. As we step into the new week, the question on every trader's mind is whether this equilibrium will tip towards a decisive breakout or a more significant correction. The charts present a complex picture, with technical indicators flashing conflicting signals across different timeframes, demanding a nuanced approach to deciphering Bitcoin's next potential move. This week's analysis delves into the intricate dance between bullish and bearish forces, examining the impact of global risk sentiment, the US Dollar's trajectory, and the ever-present regulatory whispers that continue to shape the crypto landscape.
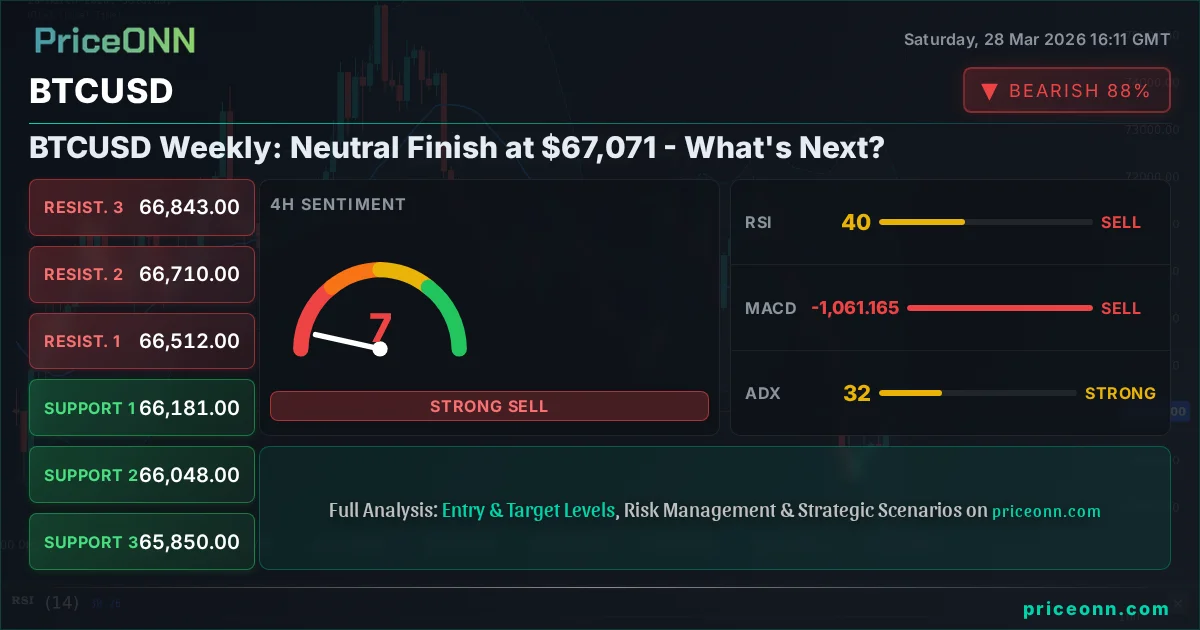
- Bitcoin (BTCUSD) closed the week near $67,071, indicating a neutral sentiment after significant volatility.
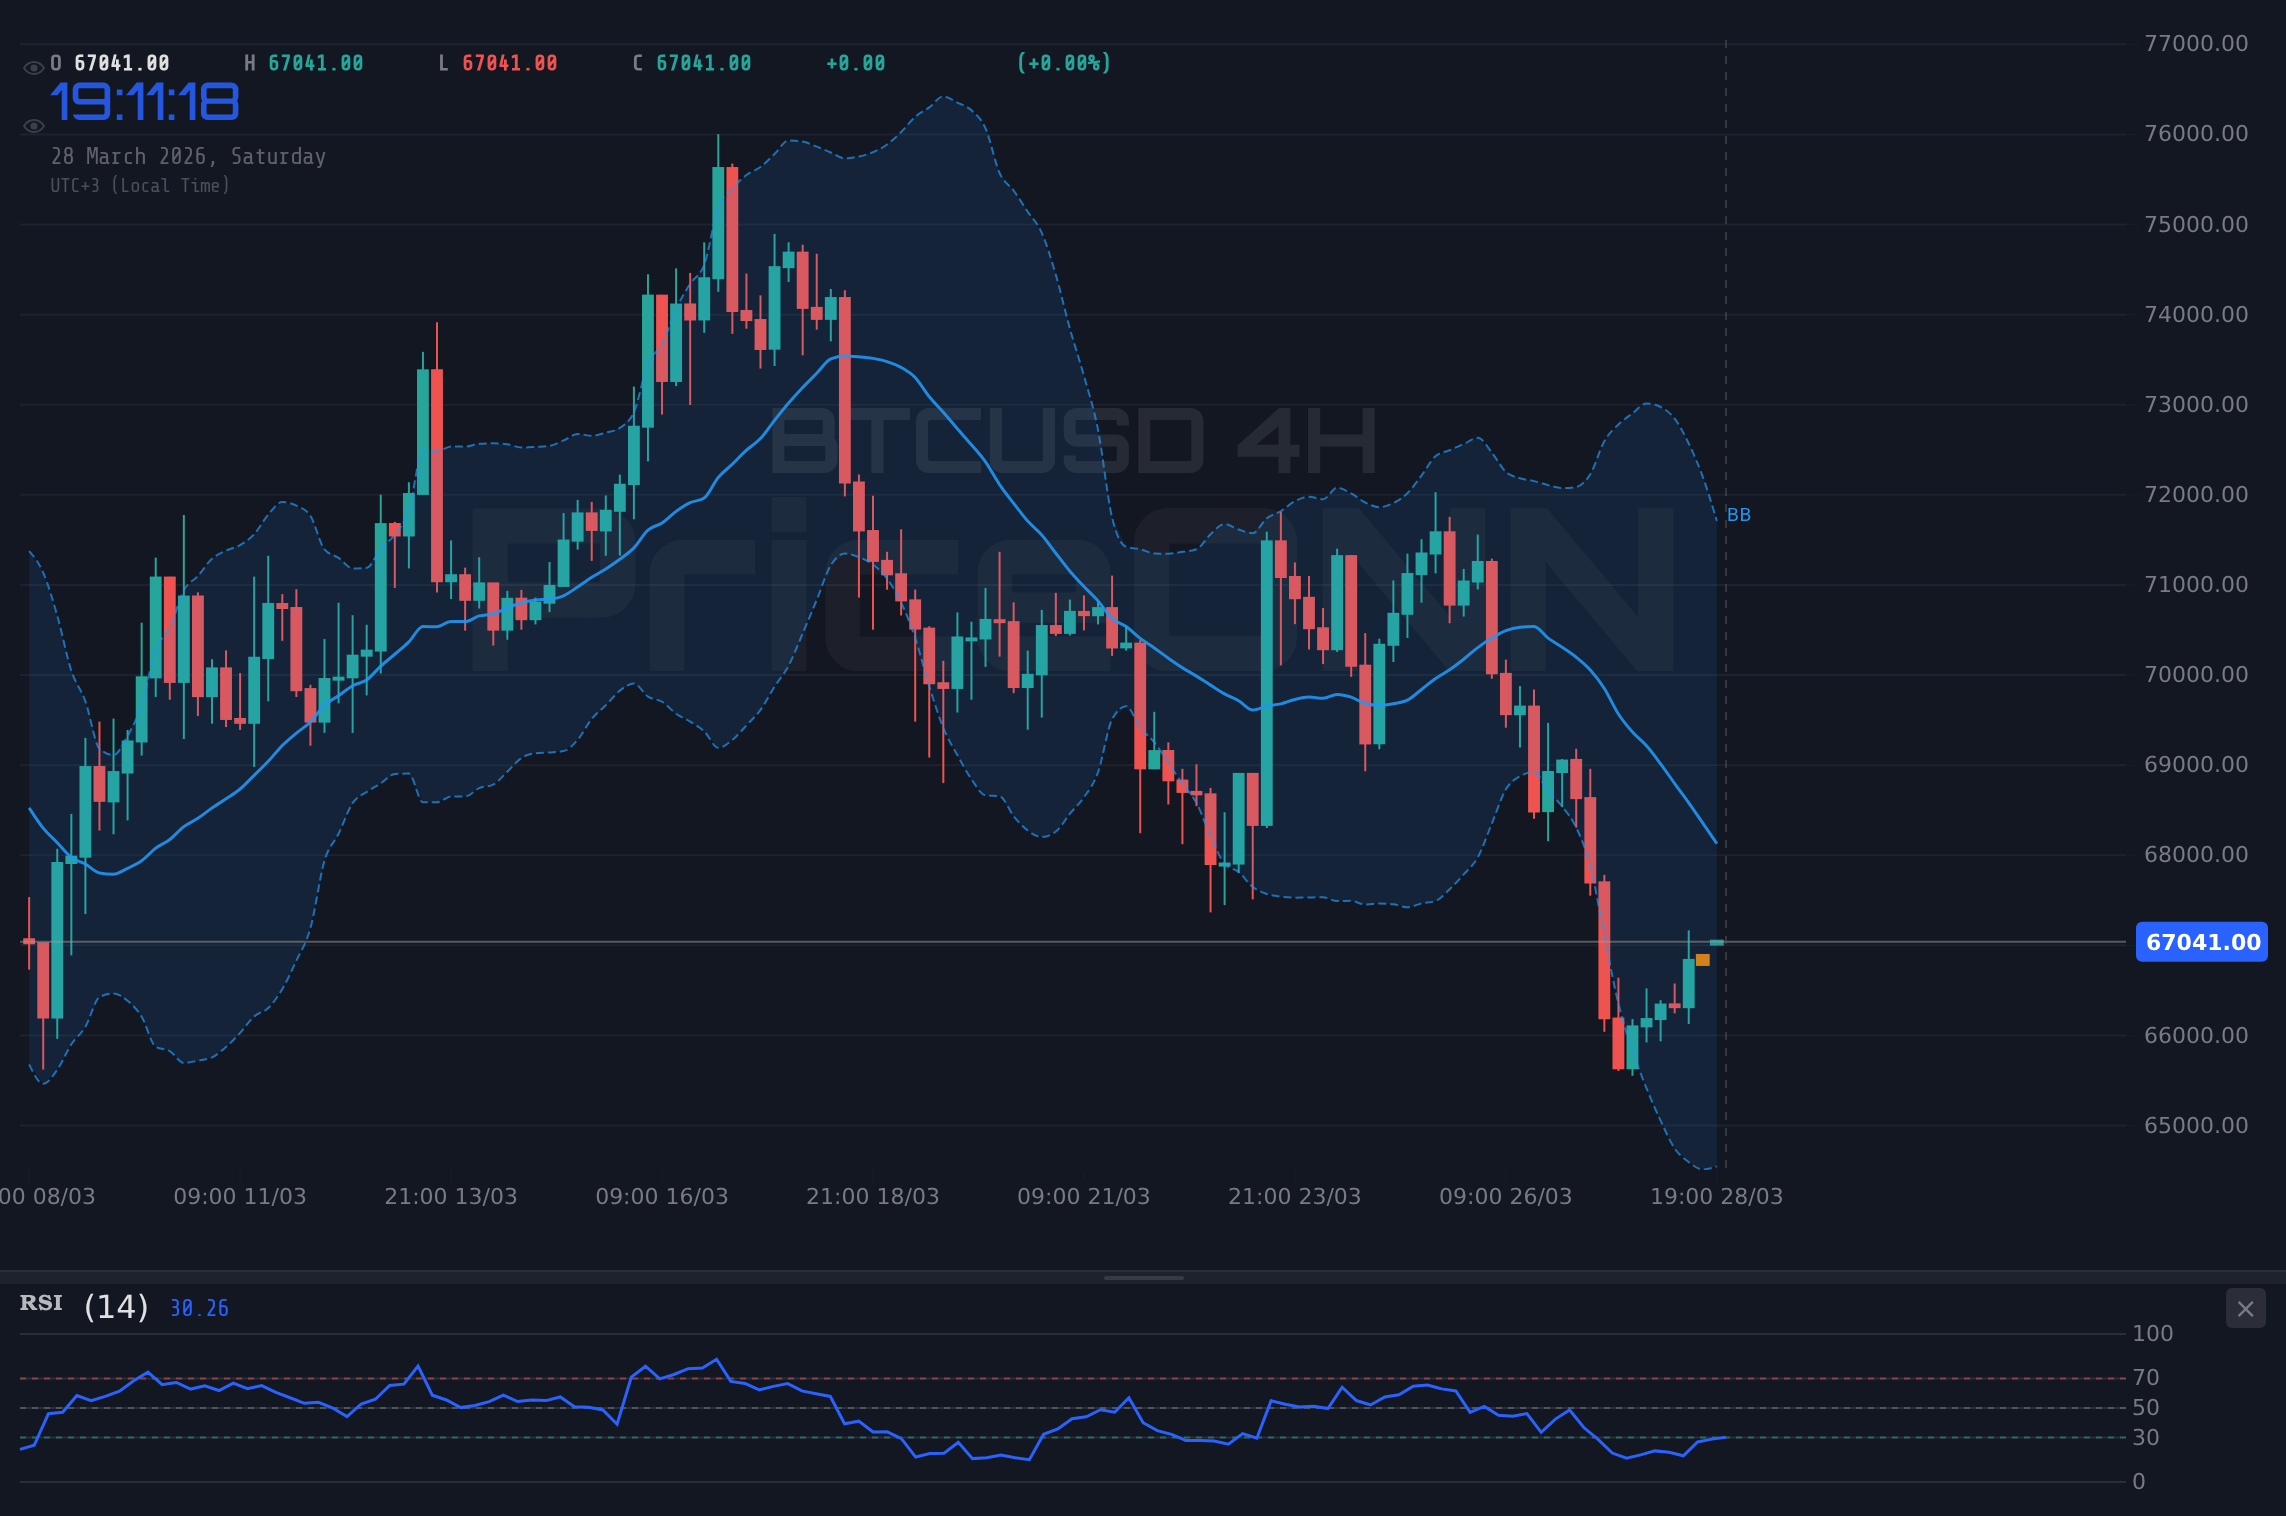
- The 4-hour chart shows BTCUSD in a downtrend (ADX 31.78) with RSI at 40.35, suggesting potential downside pressure despite short-term buying.
- Key support is identified at $65,850, while resistance looms around $66,843, forming a tight range for the upcoming week.
- Geopolitical tensions are boosting the US Dollar Index (DXY) towards 99.91, potentially pressuring risk assets like BTCUSD.
The past week was a testament to the market's struggle to find a clear direction. After an initial push that saw Bitcoin flirt with higher levels, selling pressure emerged, particularly as global risk aversion intensified. This shift in sentiment was palpable across markets, with major equity indices like the S&P 500 and Nasdaq experiencing sharp declines. In this environment, the US Dollar Index (DXY) found strength, climbing towards the 99.91 mark. This inverse correlation is a critical factor for Bitcoin; a stronger dollar often translates to less capital flowing into speculative assets. The narrative of 'higher for longer' interest rates in the US, coupled with escalating geopolitical tensions in the Middle East, provided a solid foundation for the dollar's resurgence, creating a challenging backdrop for risk assets.
On the technical front, the 4-hour chart for BTCUSD presents a particularly bearish outlook, despite the 1-hour chart showing some signs of stabilization. The Average Directional Index (ADX) at 31.78 clearly indicates a strong trend is in play, and its current direction is downward. This is corroborated by the Relative Strength Index (RSI) sitting at 40.35, which, while not deeply oversold, suggests that momentum is still favoring sellers. The MACD indicator also remains below its signal line on this timeframe, reinforcing the bearish sentiment. This multi-timeframe divergence - with the 1-hour showing neutrality or even slight bullishness while the 4-hour and daily charts lean bearish - is precisely what creates the current market indecision. Traders are caught between the immediate price action and the prevailing trend on longer timeframes.
The daily chart for BTCUSD, however, paints a picture of consolidation rather than outright decline, with the trend strength at 50%. This suggests that while the longer-term momentum might be waning, the immediate price action is not yet confirming a sustained downtrend. The RSI at 42.91 is in neutral territory, and the MACD is showing positive momentum, albeit with the histogram below zero. This conflict between timeframes is crucial. It implies that any short-term bullish signals on the hourly chart could be met with significant selling pressure as the market re-evaluates the broader trend. Conversely, a breakdown below key support levels could accelerate the bearish sentiment indicated by the 4-hour timeframe, potentially leading to a cascade of stop-loss orders being triggered.
The Bull Case: Resilience Amidst Headwinds
Despite the bearish signals on longer timeframes and the challenging macroeconomic environment, there are compelling arguments for a bullish continuation in BTCUSD. Firstly, institutional interest remains a significant underlying factor. News reports indicate continued inflows into Bitcoin-related investment products, suggesting that large players are accumulating at these levels. This accumulation provides a fundamental floor for the price, absorbing some of the selling pressure. The sheer resilience shown by Bitcoin, holding above the $65,850 support level despite significant market turmoil, speaks volumes about the conviction of its proponents. This level has acted as a crucial psychological and technical barrier, and its repeated defense suggests that buyers are stepping in with conviction.
Furthermore, the technical picture on the 1-hour chart offers a glimmer of hope for the bulls. With an RSI of 58.34, momentum is leaning positive, and the MACD is trading above its signal line, indicating bullish momentum building. The Stochastic Oscillator, with %K at 69.61 and %D at 61.97, shows a bullish crossover, suggesting that upward movement is gaining traction. While these are short-term indicators, they can often lead the charge, especially in a market prone to rapid sentiment shifts. The ADX at 32.01 on this timeframe also confirms a strong trend, and if this trend can reassert its bullish nature, it could override the longer-term bearish signals. The ability of Bitcoin to hold ground while equities plunge is also a noteworthy divergence, potentially signaling a flight to a different kind of digital asset, or simply a temporary decoupling.
The narrative around Bitcoin as a potential inflation hedge or a store of value, while often debated, gains traction during periods of geopolitical uncertainty and rising commodity prices. With Brent crude oil prices surging past $110.64 and WTI breaching $101.19 due to escalating Middle East tensions, inflation concerns are back in focus. In such an environment, investors may seek alternative assets that are perceived to offer protection against rising prices and currency debasement. While gold has traditionally filled this role, Bitcoin's narrative as 'digital gold' continues to attract capital, especially from younger demographics and tech-savvy investors. This macro backdrop, coupled with ongoing technological developments in the crypto space, provides a tailwind for bullish sentiment, suggesting that the current consolidation might merely be a pause before the next upward leg.
The Bear Case: Macro Headwinds and Technical Weakness
Conversely, the arguments for a bearish outlook on BTCUSD are equally, if not more, compelling, primarily driven by macroeconomic factors and technical indicators on longer timeframes. The strengthening US Dollar Index (DXY), which has been steadily climbing towards the 99.91 mark, poses a significant headwind. Historically, a strong dollar correlates inversely with Bitcoin's price. As the dollar strengthens, global liquidity tightens, making riskier assets like cryptocurrencies less attractive to international investors. The Federal Reserve's hawkish stance, reflected in the market's pricing of interest rate futures, suggests that borrowing costs will remain elevated, further dampening speculative appetite. This macro environment is fundamentally unfavorable for assets that thrive on cheap liquidity and risk-on sentiment.
Technically, the bearish signals on the 4-hour and daily charts cannot be ignored. The 4-hour chart shows a clear downtrend with an ADX of 31.78, RSI at 40.35, and MACD below its signal line. This indicates that sellers are in control on this crucial timeframe, which often dictates the short-to-medium term direction. The daily chart, while showing a neutral trend strength of 50%, has RSI at 42.91 and the MACD below its signal line, reinforcing the idea that any upward moves might be met with resistance. The Stochastic Oscillator on the daily chart shows %K (17.65) below %D (27.18), a bearish signal indicating further downside potential. The price is also trading below the middle Bollinger Band on both the 4-hour and daily charts, suggesting a bearish bias.
Furthermore, the broader market sentiment remains fragile. Equity markets, particularly the tech-heavy Nasdaq and S&P 500, have experienced significant sell-offs, with the S&P 500 dropping 2% to 6357.55 and the Nasdaq down 2.23% to 23092.5. This risk-off environment typically leads investors to de-risk, moving away from speculative assets like Bitcoin towards safer havens such as US Treasuries or even the dollar itself. The correlation between Bitcoin and tech stocks has been well-documented, and a sustained downturn in equities often drags cryptocurrencies lower. The recent news flow, while mixed, has contained elements of regulatory uncertainty and geopolitical instability, both of which tend to dampen speculative fervor. The possibility of increased regulatory scrutiny, particularly concerning stablecoins, could also cast a shadow over the crypto market, leading to cautious positioning.
Bridging the Gap: Scenarios for the Week Ahead
Given the conflicting signals and the prevailing market uncertainty, the upcoming week is likely to be defined by the battle between bulls and bears at key price levels. The immediate range appears to be defined by support at $65,850 and resistance around $66,843 on the 4-hour chart. A decisive break above this resistance, particularly with increasing volume and positive news flow, could ignite a bullish scenario. This would likely involve a retest of higher levels, potentially targeting $68,338 and then $70,575. Such a move would require overcoming the bearish sentiment on longer timeframes and a potential shift in macroeconomic factors, perhaps a dovish surprise from the Fed or a de-escalation of geopolitical tensions.
Conversely, a failure to hold the $65,850 support level could trigger a more significant bearish move. A close below this level on the 4-hour chart would confirm the downtrend indicated by the ADX and RSI, opening the door for further declines. Potential downside targets would then be the daily support levels, starting with $64,708, followed by $63,315. This scenario would be amplified by continued dollar strength, falling equity markets, and negative regulatory news. The risk of a liquidity grab below $65,850 is also present, which could accelerate the decline towards the lower support levels. This would represent a full capitulation of short-term bullish sentiment.
A neutral or consolidation scenario remains highly probable in the short term, especially if key macroeconomic data releases offer no clear direction or if geopolitical events remain in a holding pattern. In this case, BTCUSD could continue to trade within the established range, with price action characterized by volatility but lacking a sustained directional move. This sideways action can often lead to a 'squeeze' where volatility eventually builds before a larger breakout. Traders might look for opportunities on the edges of this range, buying near support and selling near resistance, while keeping a close eye on volume and momentum indicators for signs of a developing trend. Patience will be key during such periods, allowing the market to establish a clearer path forward.
Bearish Scenario: Downtrend Confirmation
60% ProbabilityNeutral Scenario: Range-Bound Consolidation
25% ProbabilityBullish Scenario: Trend Reversal Attempt
15% ProbabilityUpcoming economic data releases, particularly those related to inflation and employment in the US, could introduce significant volatility. Geopolitical developments in the Middle East also remain a wildcard. Traders should exercise caution and employ strict risk management strategies.
Frequently Asked Questions: BTCUSD Analysis
What happens if BTCUSD breaks below the $65,850 support level?
A break below $65,850 on the 4-hour chart would confirm the bearish trend indicated by the ADX and RSI. This could lead to a rapid decline, with initial downside targets at $64,708 and potentially $63,315 as sellers likely seize control.
Should I buy BTCUSD at current levels around $67,071 given the conflicting signals?
Buying at current levels carries risk due to the bearish signals on longer timeframes and the strong US Dollar. A more prudent approach might be to wait for a confirmed break above $66,843 with strong volume or a confirmed bounce from the $65,850 support, accompanied by improved risk sentiment.
Is the RSI at 40.35 on the 4-hour chart a sell signal for BTCUSD?
An RSI of 40.35 on the 4-hour chart suggests that bearish momentum is present, but it is not yet in oversold territory. Combined with other bearish indicators like the MACD and ADX, it leans towards a sell signal, indicating that upside potential may be limited in the short term.
How will the strengthening US Dollar (DXY near 99.91) affect BTCUSD next week?
A strengthening DXY typically exerts downward pressure on risk assets like Bitcoin. As the dollar gains value, capital may flow out of speculative markets and into safer dollar-denominated assets, potentially capping any upside moves for BTCUSD and increasing the probability of the bearish scenario playing out.
The past week has underscored the delicate balance in the cryptocurrency market. Bitcoin, trading around $67,071, finds itself at a crossroads, caught between the allure of institutional adoption and the stark realities of a challenging macroeconomic and geopolitical landscape. The bearish technical signals on longer timeframes, coupled with a strengthening dollar and risk aversion, present significant hurdles for the bulls. However, the resilience shown at key support levels and the underlying institutional demand cannot be entirely dismissed. For the week ahead, the $65,850 support and $66,843 resistance levels will be critical battlegrounds. A decisive move in either direction, confirmed by volume and broader market sentiment, will likely dictate Bitcoin's path. Until then, patience and disciplined risk management remain the most prudent strategies for navigating this uncertain terrain.
| Indicator | Value | Signal | Interpretation |
|---|---|---|---|
| RSI (14) | 40.35 | Bearish | Momentum fading, room for downside |
| MACD Histogram | -120.67 | Bearish | Negative momentum continues |
| Stochastic (14,3) | K:27.68, D:13.22 | Bullish Crossover | Potential short-term bounce signal |
| ADX (14) | 31.78 | Strong Trend | Clear trend direction (downward) |
| Bollinger Bands (20) | Middle Band | Neutral | Price below middle band, bearish bias |
Track markets in real-time
AI-powered analysis, technical indicators and real-time price data.
Join Our Telegram Channel
Breaking market news, AI analysis and trading signals instantly.
Join Channel