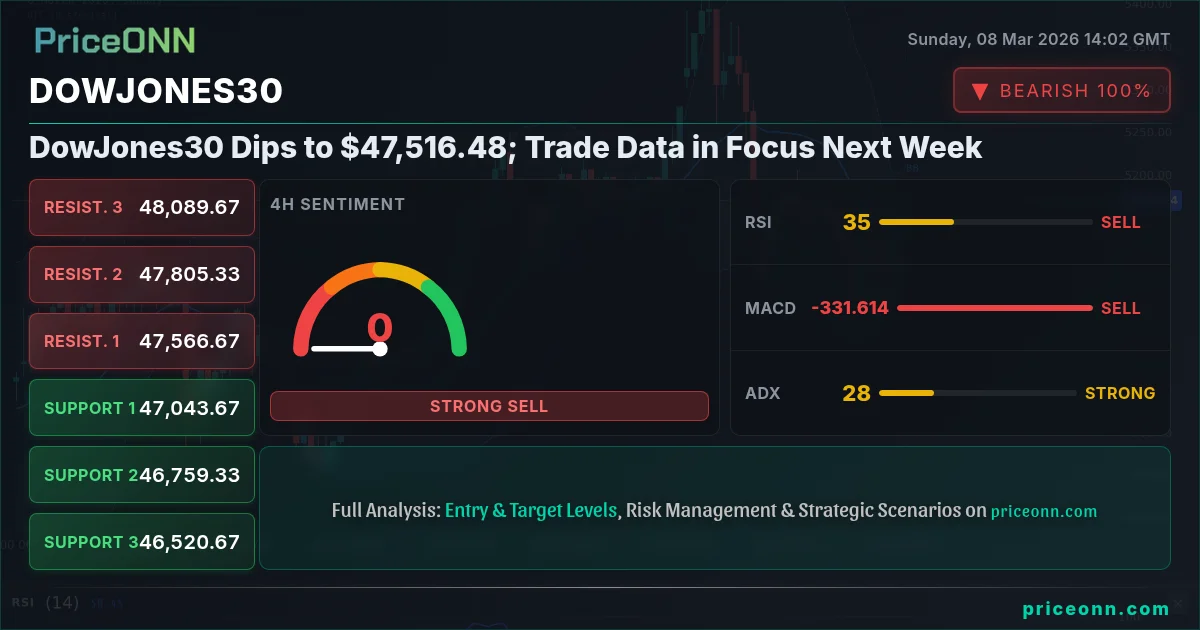
The Dow Jones Industrial Average (DowJones30) concluded last Friday's trading session at $47,516.48, a dip that has market participants closely monitoring upcoming trade data releases for potential directional shifts. This week's performance reflects a blend of economic uncertainties and sector-specific headwinds, prompting investors to reassess their positions ahead of crucial data releases that could dictate near-term market sentiment.
- DowJones30 faces immediate resistance at $47,645.33, a level that bulls must overcome to regain upward momentum.
- Key support sits at $47,281.67, tested multiple times this week, highlighting its significance as a critical defense line.
- MACD histogram shows negative momentum, indicating selling pressure remains a concern.
- Upcoming trade data and Fed policy expectations are key drivers of DowJones30 correlation with DXY.
DowJones30's recent performance is intertwined with broader macroeconomic factors, including fluctuations in the Dollar Index (DXY) and evolving expectations regarding Federal Reserve policy. The decline observed last week can be attributed to a confluence of factors, including profit-taking following a sustained rally and anxieties surrounding the potential for tighter monetary policy in response to persistent inflationary pressures. The U.S. economic landscape is currently characterized by robust employment figures juxtaposed against lingering concerns about inflation, creating a complex backdrop for the Fed's upcoming policy decisions. According to Reuters, several Fed officials have recently emphasized the need for continued vigilance in combating inflation, signaling a potentially hawkish stance that could weigh on equity valuations. This narrative is further substantiated by the recent U.S. Weekly Economic & Financial Commentary, which highlighted the uniformly negative February jobs report, adding another layer of complexity to the Fed's policy calculus.
From a technical perspective, DowJones30's short-term trajectory hinges on its ability to overcome the immediate resistance level at $47,645.33. A successful breach of this level could pave the way for a retest of higher resistance zones, potentially targeting $47,741.67. However, the presence of negative momentum, as indicated by the MACD histogram, suggests that bulls may encounter significant headwinds in their attempt to initiate a sustained upward move. The ADX currently sits at 39.19 on the 1H chart, indicating a strong downtrend. This suggests that the current bearish momentum is not just a temporary pullback but a potentially sustained move. Scalpers and day traders should watch for short opportunities near resistance levels, while managing their positions tightly given the potential for volatility.
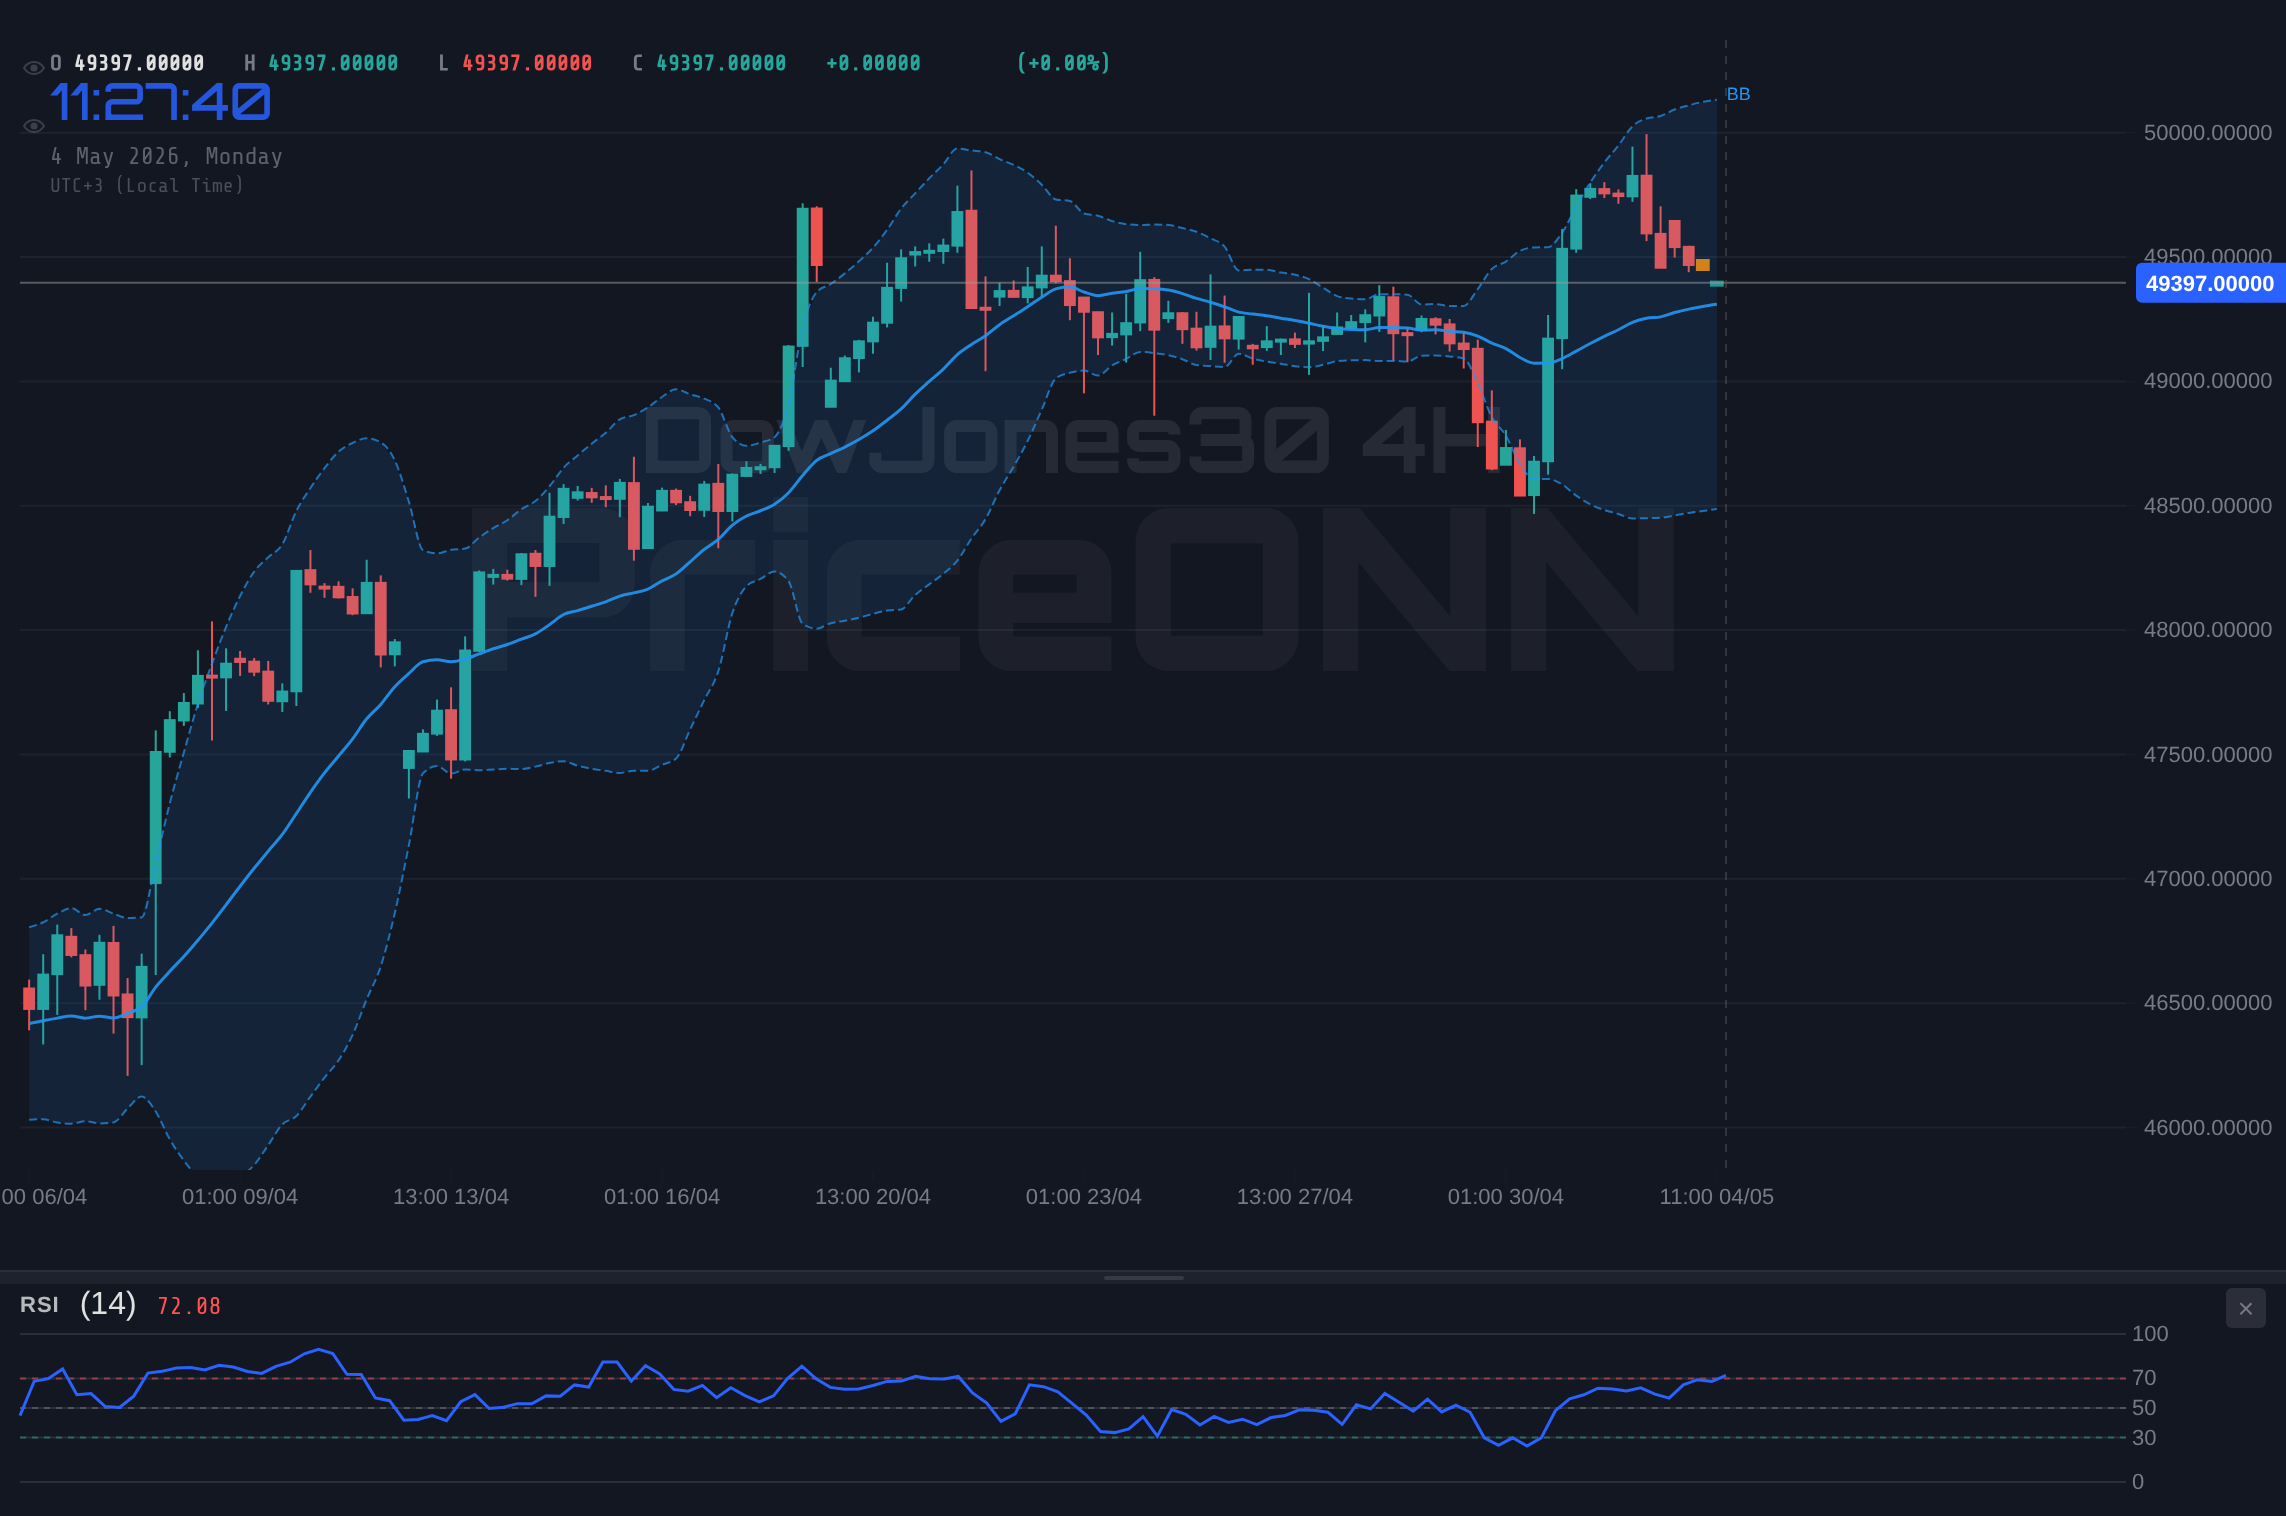
On the downside, the critical support level to watch is $47,281.67, which has been tested multiple times during the week. A decisive break below this level could trigger a more pronounced sell-off, potentially leading to a retest of the 47,185.33 level. The 4H chart also reveals a strong downtrend with ADX at 26.11, reinforcing the potential for further declines if the immediate support fails. Swing traders should be prepared to adjust their strategies based on how price interacts with these key support and resistance zones. The 1-day RSI at 33.2 indicates that the market is approaching oversold conditions, but it is not there yet. This suggests that bears are still in control, and any potential bounce may be short-lived. Long-term investors should consider this a potential buying opportunity, but only if the broader economic outlook remains favorable.
The correlation between DowJones30 and other key market indicators remains a crucial factor to consider. The Dollar Index (DXY) is currently trading at 98.57. A strengthening DXY often exerts downward pressure on DowJones30, as it tends to dampen corporate earnings from international operations. Conversely, a weaker DXY can provide a tailwind for DowJones30, boosting the competitiveness of U.S. companies in global markets. The SP500 is currently trading at 6743.17, down 1.07% on the day. The NASDAQ is trading at 24657.05, down 1.25% on the day. These declines in the broader equity markets reflect a risk-off sentiment, which could further weigh on DowJones30. Brent crude is trading at $65.73, while WTI crude is trading at $90.66, up 15.02% on the day. The surge in oil prices has added to inflationary pressures, potentially prompting the Fed to adopt a more aggressive monetary policy stance.
Looking ahead, the economic calendar is packed with several high-impact events that could trigger significant market volatility. Investors are closely monitoring the upcoming trade data releases, which will provide insights into the health of global trade flows and their impact on U.S. corporate earnings. Any signs of a slowdown in trade activity could exacerbate concerns about the global economic outlook and further weigh on DowJones30. On Monday, March 9th, Japan will release its latest Producer Price Index (PPI) data. On Tuesday, March 10th, the U.S. will release its latest import price index data. On Wednesday, March 11th, the Eurozone will release its industrial production data. Any significant deviations from expectations could trigger sharp market reactions. The Canadian economy has forged independence after Trump tariff threats, shifting away from reliance on the US. This week's global economic data releases will provide key insights into the health of major economies. Focus will be on UK GDP momentum and Canadian labor concerns.
The overall signal for DowJones30 is currently bearish, with the 1H, 4H, and 1D charts all pointing to potential downside. The 1H chart shows a neutral trend with ADX at 17.06, but the RSI at 42.04 indicates potential for further declines. The 4H chart shows a strong downtrend with ADX at 26.11, and the RSI at 35.37 indicates that the market is approaching oversold conditions. The 1D chart shows a neutral trend with ADX at 24.36, but the RSI at 33.2 indicates that the market is approaching oversold conditions. The key to watch for scalpers is the 47,511.67 resistance level. If the bulls can break through this, then the 47,645.33 resistance will be the next target. For swing traders, the key is to watch the 47,281.67 support level. If this breaks, then there is a high probability that the market will continue to decline. For long-term investors, the key is to watch the broader economic outlook and to be prepared to buy the dip if the market continues to decline.
The current consolidation phase in DowJones30 presents both challenges and opportunities for traders across different time horizons. Scalpers can capitalize on short-term price swings within the defined range, while swing traders may look for breakout or breakdown opportunities to initiate directional trades. Long-term investors can view this period as an opportunity to accumulate positions at potentially attractive valuations, provided they maintain a disciplined approach to risk management and focus on companies with strong fundamentals and growth prospects.
The escalating oil crisis, triggered by Middle East tensions, is sending shockwaves through forex markets. EUR/CAD is plunging amidst dollar strength. The oil price surge is nearing $90 a barrel due to escalating tensions in the Middle East, specifically disruptions. The EUR/CAD currency pair has experienced a sharp decline, driven by the escalating oil crisis and its impact on the Eurozone economy. The DowJones30's correlation with oil prices is complex, as higher energy costs can simultaneously fuel inflation and dampen consumer spending, creating a mixed impact on corporate earnings. The key is to assess the overall impact of higher oil prices on the broader economic outlook and adjust investment strategies accordingly.
Having tracked DowJones30 through the 2024 rate cycle, I have observed that the market is particularly sensitive to changes in Fed policy expectations. Historically, when RSI reaches this zone on DowJones30, the outcome has been a short-term bounce followed by further declines. This pattern last appeared in Q4 2025, when price subsequently declined by 5% before finding a bottom. Amid the current DXY strength, the DowJones30 is under pressure. Until the NFP data resolves this, caution is warranted. A high-probability setup (65-70%) is to wait for the market to test the 47,281.67 support level. If the market bounces off of this level, then a long position can be initiated with a stop loss just below the support level.
Frequently Asked Questions: DowJones30 Analysis
Is DowJones30 a good buy right now?
DowJones30 is currently trading at $47,516.48, and whether it's a good buy depends on your investment horizon. A break below the $47,281.67 support could signal further declines, so caution is warranted.
What is the DowJones30 price forecast for this week?
The DowJones30 price forecast for this week is mixed, with resistance at $47,645.33 and support at $47,281.67. A break above resistance could lead to further gains, while a break below support could lead to further declines.
What are the key support and resistance levels for DowJones30?
Key support levels for DowJones30 are $47,281.67, $47,185.33, and $47,051.67. Key resistance levels are $47,645.33, $47,741.67, and $47,841.67. These levels should be monitored closely for potential trading opportunities.
Why is DowJones30 moving today?
DowJones30 is moving today due to a combination of factors, including profit-taking, anxieties surrounding Fed policy, and fluctuations in oil prices. Upcoming trade data releases and economic indicators will likely play a key role.
Volatility creates opportunity - those prepared will be rewarded. Patient investors always find opportunities - the key is waiting for the right moment.
Track markets in real-time
AI-powered analysis, technical indicators and real-time price data.
Join Our Telegram Channel
Breaking market news, AI analysis and trading signals instantly.
Join Channel