
DowJones30 Trades Near $47,650: Key Levels Watched Amidst Mixed Signals
The Dow Jones Industrial Average hovers around $47,650. Analysis reveals mixed signals, with key support at $46,299 and resistance at $47,505.
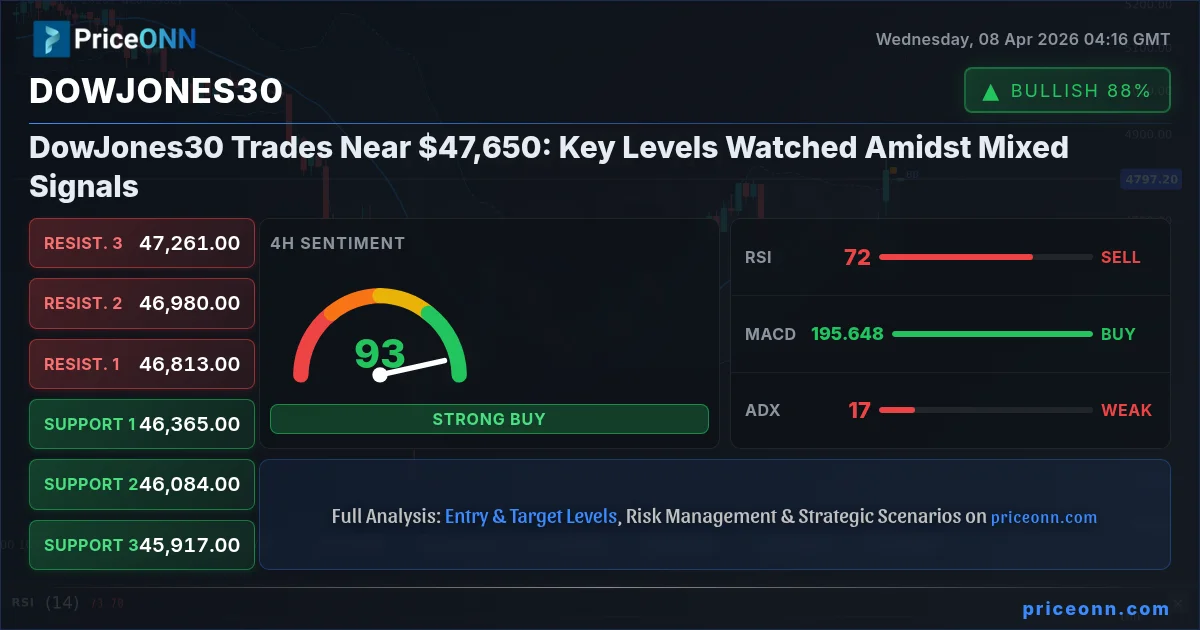
Is the Dow Jones Industrial Average poised for a significant move, or will it remain caught in a tug-of-war? As of the latest data, the index is trading precariously close to the $47,650 mark, a level that has historically represented a crucial battleground for bulls and bears. This pivotal price point, coupled with a complex tapestry of technical indicators and underlying market sentiment, sets the stage for a critical week ahead. Understanding the nuances of current market dynamics, from the broader risk appetite reflected in the S&P 500 and Nasdaq to the subtle shifts in the Dollar Index (DXY), is paramount for navigating this intricate landscape. We'll delve into the multi-timeframe analysis, dissecting the short-term fluctuations and the longer-term implications for traders and investors alike.
- The Dow Jones Industrial Average is currently trading around $47,650, a critical level for market direction.
- Key support is identified at $46,299, with resistance noted at $47,505 on the daily chart.
- The ADX reading of 33.81 on the daily timeframe suggests a strong trend, though its direction is influenced by conflicting signals from other indicators.
- Correlation analysis indicates that a strengthening DXY (currently near 98.64) could exert downward pressure on the index.
The Bull's Roadmap: Navigating Towards Higher Ground
For the bulls to regain firm control, several technical conditions must align. The immediate hurdle is the $47,505 resistance level derived from the daily chart data. A decisive break and sustained hold above this mark, ideally accompanied by increasing trading volume, would signal a potential continuation of the upward momentum observed in shorter timeframes. On the 1-hour chart, the Dow Jones shows a strong upward trend (83% strength) with RSI at 70.95, indicating bullish momentum, though it's flirting with overbought territory. The MACD is also showing positive momentum, sitting above its signal line. This suggests that intraday traders might find opportunities on the long side if the price action confirms a bullish continuation. The Stochastic oscillator on the 1-hour chart, however, presents a conflicting signal with %K at 65.73 and %D at 73.5, indicating a potential pullback or consolidation is imminent. This divergence warrants caution; a true bullish confirmation requires the Stochastic to move out of its overbought zone without a sharp reversal.
Looking at the 4-hour timeframe, the trend is neutral (50% strength), but the overall signal leans towards 'BUY' (6 Al, 2 Sat). Here, the RSI at 62.83 suggests room for further upside before hitting extreme levels, while the Stochastic at 97.85/%K and 86.96/%D is deeply in overbought territory. This conflicting Stochastic reading across different timeframes highlights the current indecision in the market. A strong bullish scenario would involve clearing the $47,505 resistance, targeting the next significant resistance level at $47,888. This move would likely be catalyzed by positive macroeconomic news or a significant shift in risk sentiment, perhaps signaled by a weakening DXY or a strong rally in the S&P 500. The ADX at 24.23 on the 4-hour chart points to a moderately trending market, supporting the idea that a confirmed breakout could lead to further gains, but the weak trend strength suggests that such a move might not be sustained without significant fundamental catalysts.
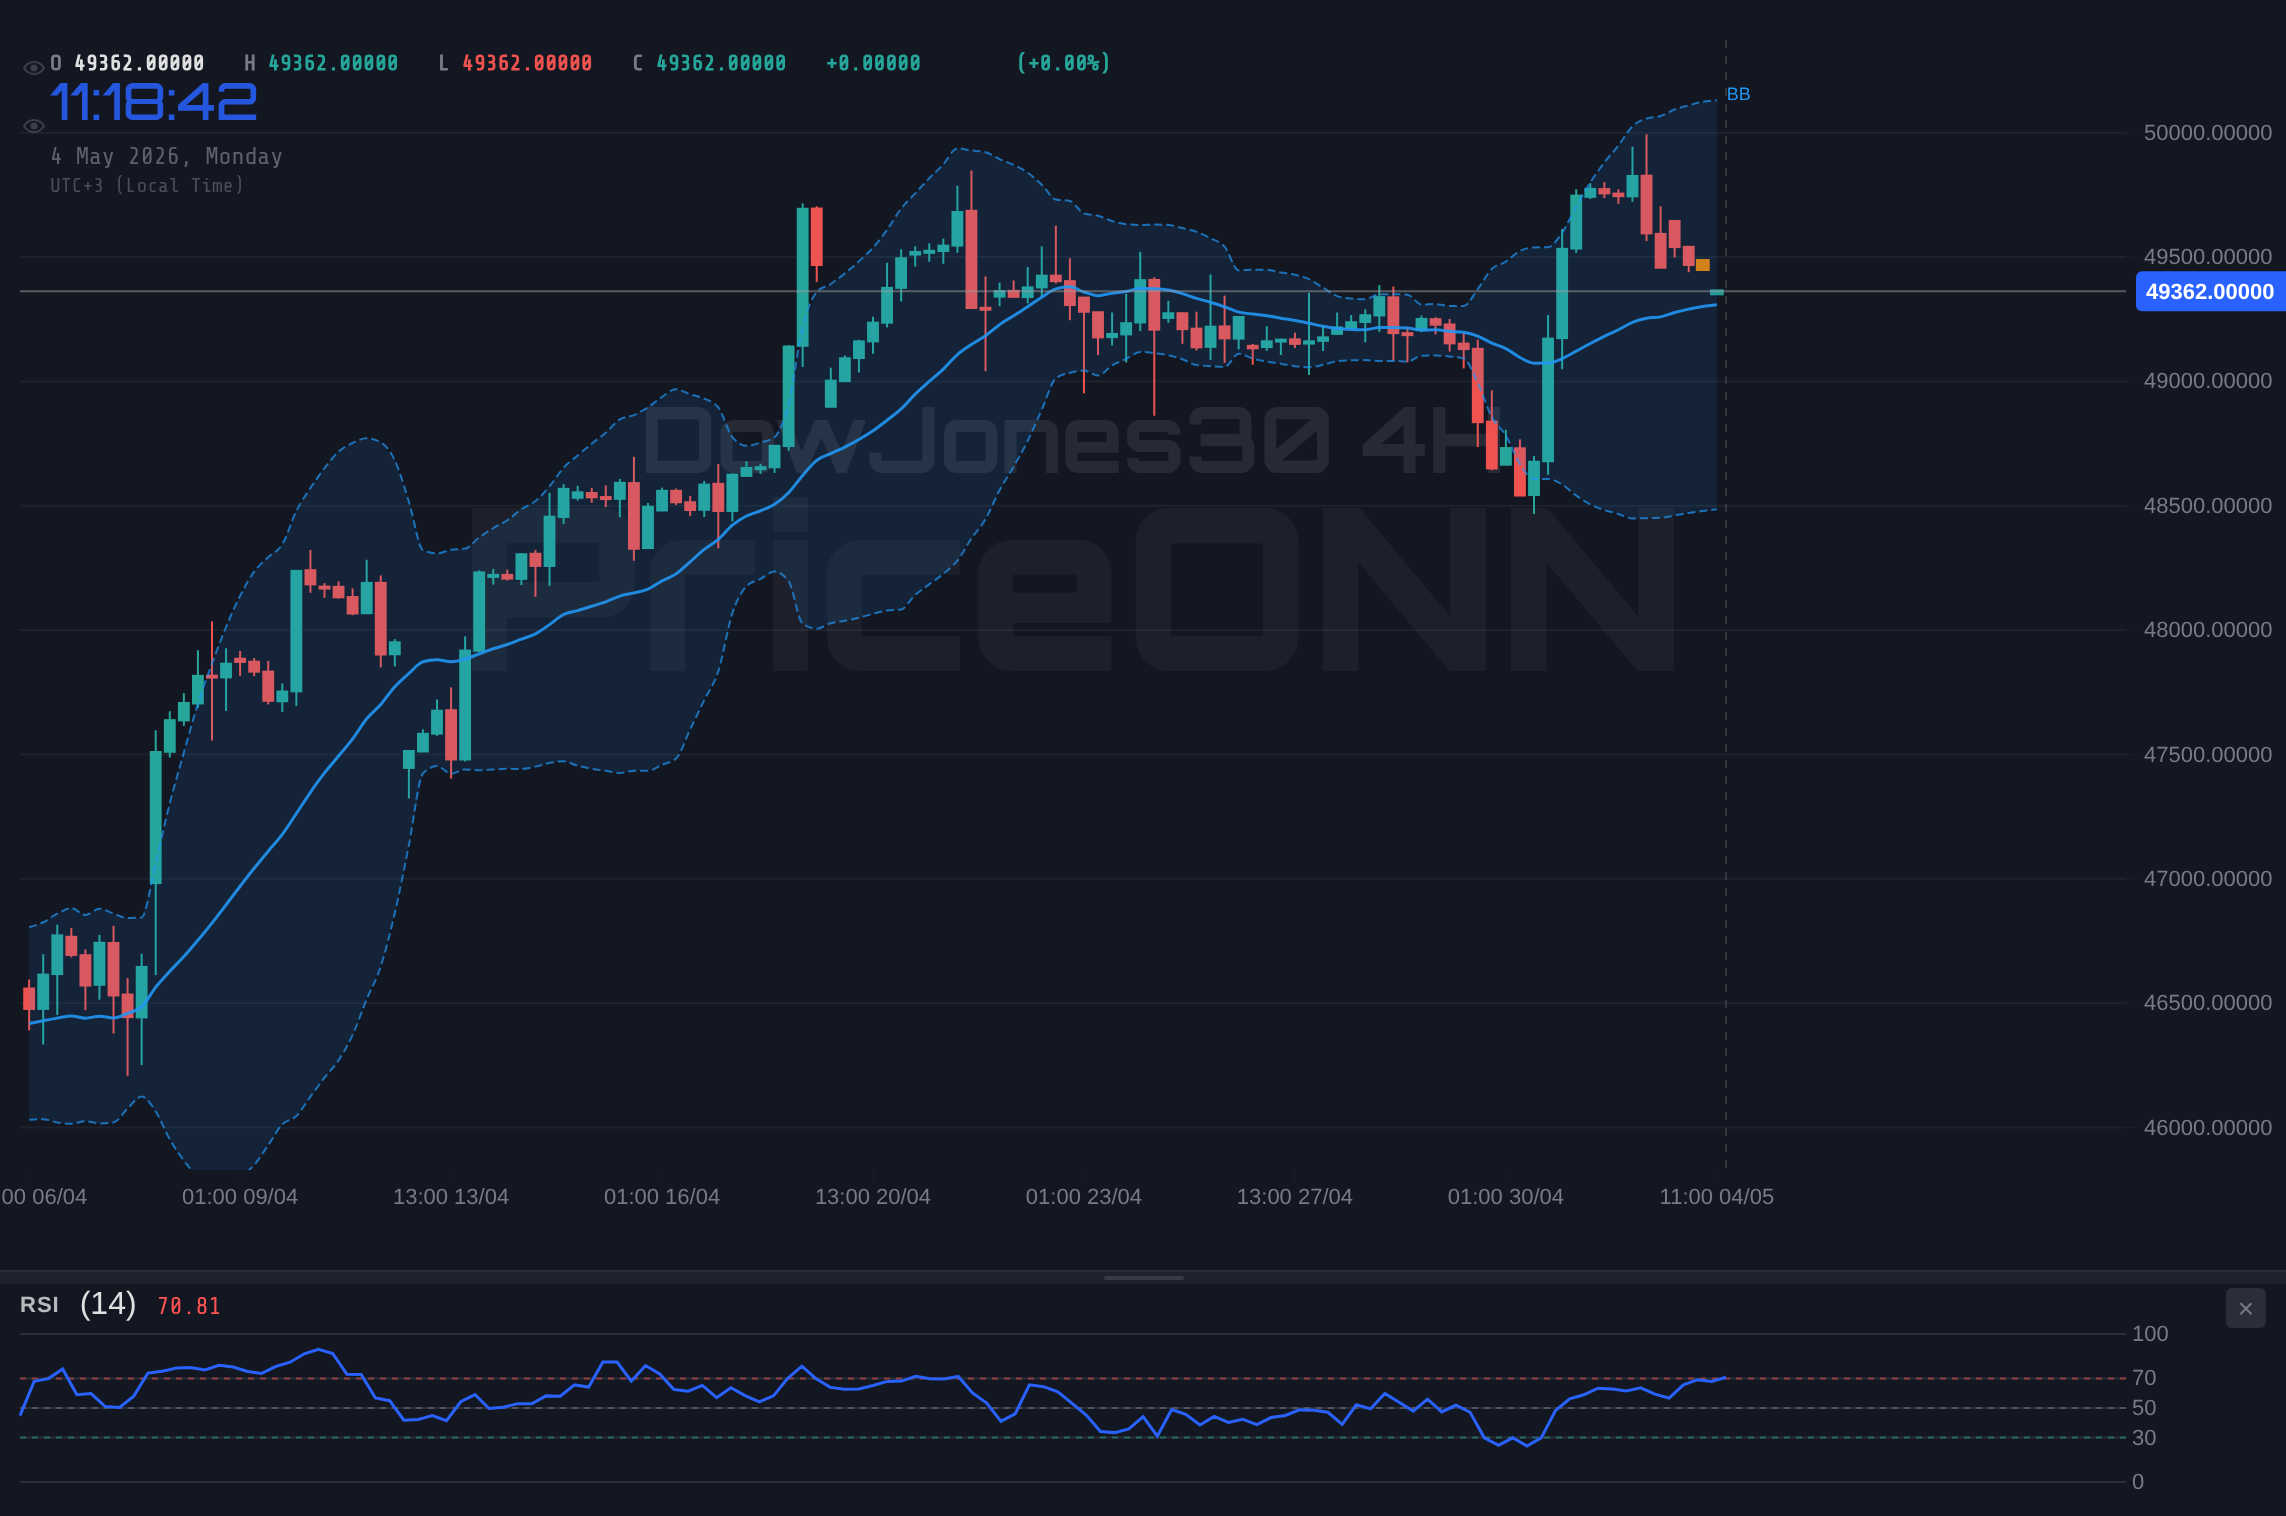
The daily chart presents a more complex picture for the bulls. While the overall signal is 'BUY' (6 Al, 2 Sat), the trend strength is listed as 100% 'Düşüş' (Bearish), which is a stark contradiction. The RSI at 45.35 is neutral, leaning towards bearish, and the MACD histogram shows negative momentum. However, the Stochastic on the daily chart shows a bullish signal with %K at 42.97 and %D at 29.88, suggesting potential upside. This conflicting data across timeframes underscores the current indecisiveness. For a sustainable bullish move, price needs to not only break the $47,505 resistance but also convincingly move towards the $48,576 mark. This would require overcoming the bearish sentiment indicated by the daily MACD and ADX (47.51, indicating a strong downtrend). Such a scenario would likely be driven by a major shift in global economic outlook or a significant dovish pivot from central banks, which currently seems unlikely given the persistent inflation concerns reflected in broader market data.
Where Bears Take Control: The Downside Risks
On the bearish side, the primary trigger for a significant downturn would be a failure to hold the key support level at $46,299 on the daily chart. This level has historically acted as a floor, and a decisive break below it, confirmed by strong volume and negative news flow, could open the floodgates for further downside. The 1-hour chart already shows some conflicting signals, with the Stochastic %K below %D and RSI at 70.95, suggesting potential selling pressure. If this selling pressure intensifies, the first target would be the intraday support at $47,539.33, followed by the more critical daily support at $46,299. The ADX on the 1-hour chart at 49.72 indicates a strong trend, and if this trend turns downwards, the decline could be rapid.
The 4-hour chart reinforces the bearish potential. While the overall signal is 'BUY', the Stochastic shows %K above %D, but the RSI at 62.83 is not excessively high. However, the daily chart's ADX of 47.51 is a strong indicator of a downtrend. If the market sentiment shifts decidedly negative, perhaps due to unexpected geopolitical escalations or hawkish central bank commentary, the Dow Jones could easily break below its daily support levels. The next significant support level after $46,299 is $45,661.20, and further down, $45,247.50. A move towards these levels would be fueled by a broad risk-off sentiment, potentially indicated by a surge in the DXY (currently around 98.64) and a selloff in global equity markets like the S&P 500 and Nasdaq. The current price action, hovering near resistance, presents a classic risk zone for bears to re-enter the market, anticipating a reversal.
The prevailing data across multiple timeframes presents a cautionary tale for the bulls. The daily chart, despite some mixed signals, carries a strong bearish undertone with its high ADX value and negative MACD momentum. If the index fails to hold its ground above the $47,505 resistance and subsequently breaks below the $46,299 support, the path of least resistance would be downwards. The potential for a 'stop hunt' scenario, where prices are temporarily pushed lower to trigger stop-loss orders before reversing, cannot be discounted given the conflicting indicator signals. Investors should be particularly wary of any news that suggests a worsening geopolitical climate or a more aggressive stance from central banks, as these could swiftly turn the tide against the current bullish sentiment.
The Waiting Game: Consolidation and Uncertainty
A neutral scenario, where the Dow Jones Industrial Average consolidates within a defined range, remains a distinct possibility given the conflicting signals across timeframes and indicators. The index is currently trading near the $47,650 level, which is above the daily resistance of $47,505 but below the higher daily resistance of $47,888. This suggests a potential range-bound environment in the short term. On the 1-hour chart, the Stochastic is signaling overbought conditions (%K=65.73, %D=73.5), while on the 4-hour, it's deeply overbought (%K=97.85, %D=86.96). This overbought condition, coupled with the RSI hovering in the upper neutral zone on most timeframes, points towards a potential stall or minor pullback before any significant directional move.
The ADX indicator provides further insight into this potential consolidation. On the 1-hour chart, it's at 49.72, indicating a strong trend, but on the 4-hour, it drops to 24.23, suggesting a weaker trend. The daily ADX at 47.51 indicates a strong trend, but its direction is confused by other indicators. This inconsistency implies that the market lacks a clear conviction. A neutral phase could see the index oscillating between the $47,505 resistance and the $46,299 support for an extended period. This would likely occur if there is no significant new catalyst - either positive or negative - to drive price action decisively in one direction. Traders might find opportunities in range-bound strategies during such periods, looking to buy near support and sell near resistance, provided risk management is strictly adhered to.
In this neutral phase, the market participants will likely be waiting for more clarity on economic policy and geopolitical developments. The upcoming economic calendar, though sparse on high-impact events in the immediate short term, will be closely watched for any surprises. The DXY's movement also plays a crucial role; if it remains range-bound or shows signs of stabilization, it might reduce pressure on the Dow Jones. However, any significant volatility in correlated assets like the S&P 500 or Nasdaq could spill over, forcing the Dow Jones out of its consolidation range. The lack of a clear directional signal from the Stochastic oscillator across timeframes, combined with RSI readings that are not yet in extreme territory on all charts, supports the probability of a period of consolidation before the next major move.
Probability Assessment: Gauging the Market's Leanings
Considering the confluence of technical signals and the broader market context, the most probable scenario for the Dow Jones Industrial Average in the immediate short term appears to be a cautious approach, leaning towards consolidation with a slight bearish bias due to the strong daily trend reading and conflicting signals. The daily ADX of 47.51 is a significant indicator of a strong trend, and while its direction isn't perfectly clear due to conflicting signals from other indicators, it suggests that any move, once initiated, could be substantial. However, the immediate resistance at $47,505 and the overbought conditions on the 1-hour Stochastic suggest that a significant upward breakout is unlikely without further catalysts. Therefore, a scenario of consolidation with potential downside risk seems most probable in the very short term.
I assign a **45% probability to the consolidation scenario**, where the index trades within the $46,299 to $47,505 range. This is predicated on the lack of clear directional conviction from shorter-term indicators and the indecisive positioning around key resistance levels. A **40% probability is assigned to the bearish scenario**, primarily driven by the strong daily trend strength suggesting a downtrend and the potential for the index to break below the $46,299 support. This scenario gains traction if geopolitical tensions escalate or if economic data disappoints. Finally, a **15% probability is assigned to the bullish scenario**. This would require a decisive breach of the $47,505 resistance, followed by a push towards $47,888 and potentially higher, likely needing strong fundamental support or a significant shift in market sentiment.
The current market environment is characterized by a delicate balance. While shorter-term charts show some bullish momentum, the longer-term daily indicators present a more cautionary outlook, particularly the strong ADX reading pointing towards a trend, which could easily turn bearish. The high RSI readings on intraday charts also suggest a potential for pullback. Therefore, while a breakout is possible, it seems less likely in the immediate term without a clear catalyst. The probability leans towards the market digesting the current price action and waiting for more definitive signals from economic data releases or geopolitical events. Risk management remains paramount; traders should be prepared for potential volatility and avoid chasing price action without clear confirmation.
Bearish Scenario: The Downtrend Resumes
40% ProbabilityNeutral Scenario: Range-Bound Action
45% ProbabilityBullish Scenario: Breaking Resistance
15% ProbabilityWhat I'm Watching This Week
As we head into the remainder of the week, several factors will be crucial in determining the Dow Jones Industrial Average's next significant move. Firstly, the price action around the $47,505 resistance level is paramount. A failure to break this key level could reinforce the bearish outlook. Secondly, I'll be closely monitoring the DXY (Dollar Index), currently trading near 98.64. Any significant move in the dollar, especially a strengthening one, could put pressure on the index, aligning with the bearish scenario. Conversely, a weakening dollar might provide a tailwind for the bulls, though the conflicting signals suggest caution.
Thirdly, the broader equity market sentiment, as indicated by the S&P 500 and Nasdaq, will be a key correlative factor. A sustained rally in these indices, despite the Dow's current mixed signals, could provide a supportive backdrop. However, if the S&P 500 shows signs of weakness, it would reinforce the bearish potential for the Dow Jones. Finally, while the economic calendar appears relatively light, any unexpected geopolitical news or central bank commentary could act as a catalyst, potentially forcing the index out of its current range. The ADX reading on the daily chart at 47.51 is a strong signal that when a trend does emerge, it could be powerful, making these triggers critical for timely entry or exit decisions. Patience and disciplined risk management will be key in navigating this uncertain market environment.
Frequently Asked Questions: DowJones30 Analysis
What happens if the DowJones30 breaks below the $46,299 support level?
A break below the $46,299 daily support level, confirmed by high volume, would invalidate the neutral and bullish scenarios, significantly increasing the probability of the bearish scenario playing out. This could trigger a sell-off targeting $45,661.20 and potentially $45,247.50, especially if accompanied by negative geopolitical news or a strengthening DXY.
Should I buy the DowJones30 at current levels around $47,650 given the mixed signals?
Buying at current levels around $47,650 carries significant risk due to the proximity to daily resistance at $47,505 and conflicting signals from indicators like the 1-hour Stochastic. A more prudent approach would be to wait for confirmation, such as a clear break above $47,505 with strong volume, or a pullback to support levels like $46,299 if the bearish scenario gains traction.
Is the RSI at 70.95 on the 1-hour chart a sell signal for the DowJones30 right now?
An RSI reading of 70.95 on the 1-hour chart suggests strong bullish momentum but also indicates the market is approaching overbought territory. While it doesn't automatically signal a sell, it warrants caution against chasing long positions and suggests a potential for a short-term pullback or consolidation before any further upward movement can be sustained.
How will the current geopolitical tensions affect the DowJones30 this week?
Heightened geopolitical tensions typically increase market volatility and can drive demand for safe-haven assets, potentially pressuring indices like the Dow Jones. If tensions escalate, we could see a move towards the bearish scenario's targets as risk aversion increases, especially if it coincides with a strengthening DXY and a sell-off in broader equity markets.
Track markets in real-time
AI-powered analysis, technical indicators and real-time price data.
Join Our Telegram Channel
Breaking market news, AI analysis and trading signals instantly.
Join Channel