
WTI Trades Near $96.74: Bullish Trend Analysis and Key Levels
WTI crude oil hovers near $96.74, with technicals showing a strong bullish trend on the 4-hour chart, but facing mixed signals on daily timeframes. Analysis of indicators and key levels.
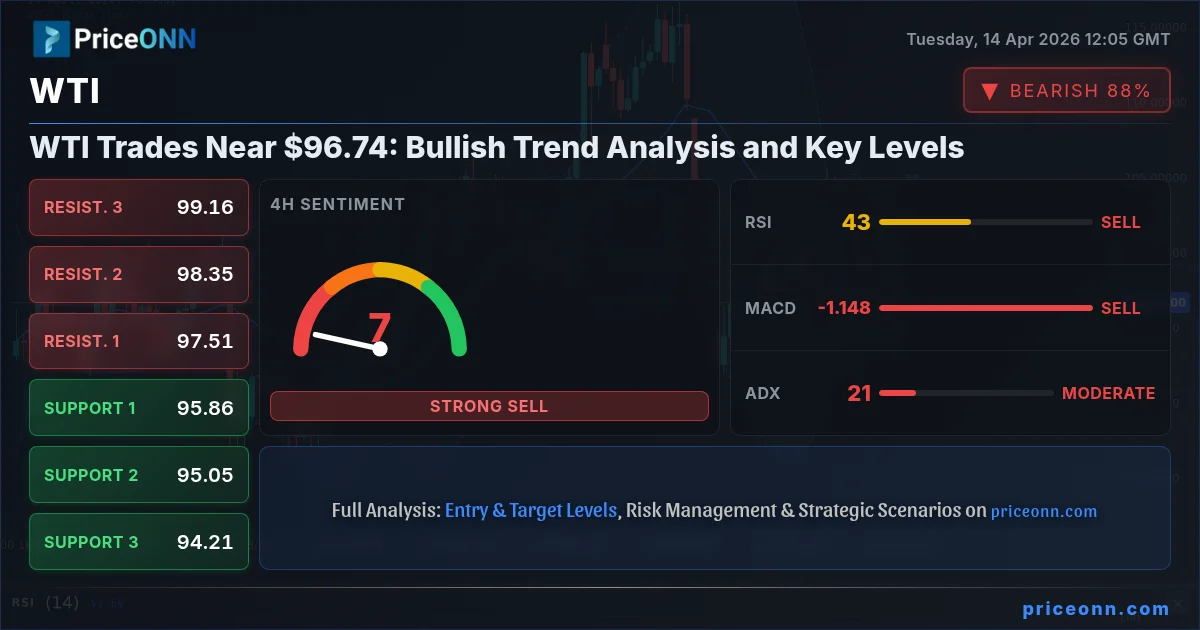
Is WTI crude oil poised for another leg higher, or are we seeing a temporary pause before a potential pullback? The market tension is palpable as WTI trades near the critical $96.74 mark. Bulls and bears are locked in a fierce battle, with conflicting signals emerging across different timeframes. Understanding the interplay between its technical indicators, key support and resistance levels, and the broader macroeconomic backdrop is crucial for navigating this volatile energy market. This analysis delves into the heart of the WTI's current price action, dissecting the data to provide a clear trading perspective.
- WTI crude oil is trading at $96.74, showing a strong bullish trend on the 4H chart (ADX 29.11) but mixed signals on daily (ADX 46.84).
- Key support for WTI is identified at $95.86 (S1 on 4H), with resistance looming at $97.51 (R1 on 4H).
- RSI readings are mostly in neutral territory (40.53 on 1H, 42.56 on 4H, 52.27 on 1D), suggesting room for further movement but no extreme conditions.
- Geopolitical tensions and supply concerns continue to underpin oil prices, while economic slowdown fears pose a potential headwind.
The Bull Case: Riding the Momentum Wave
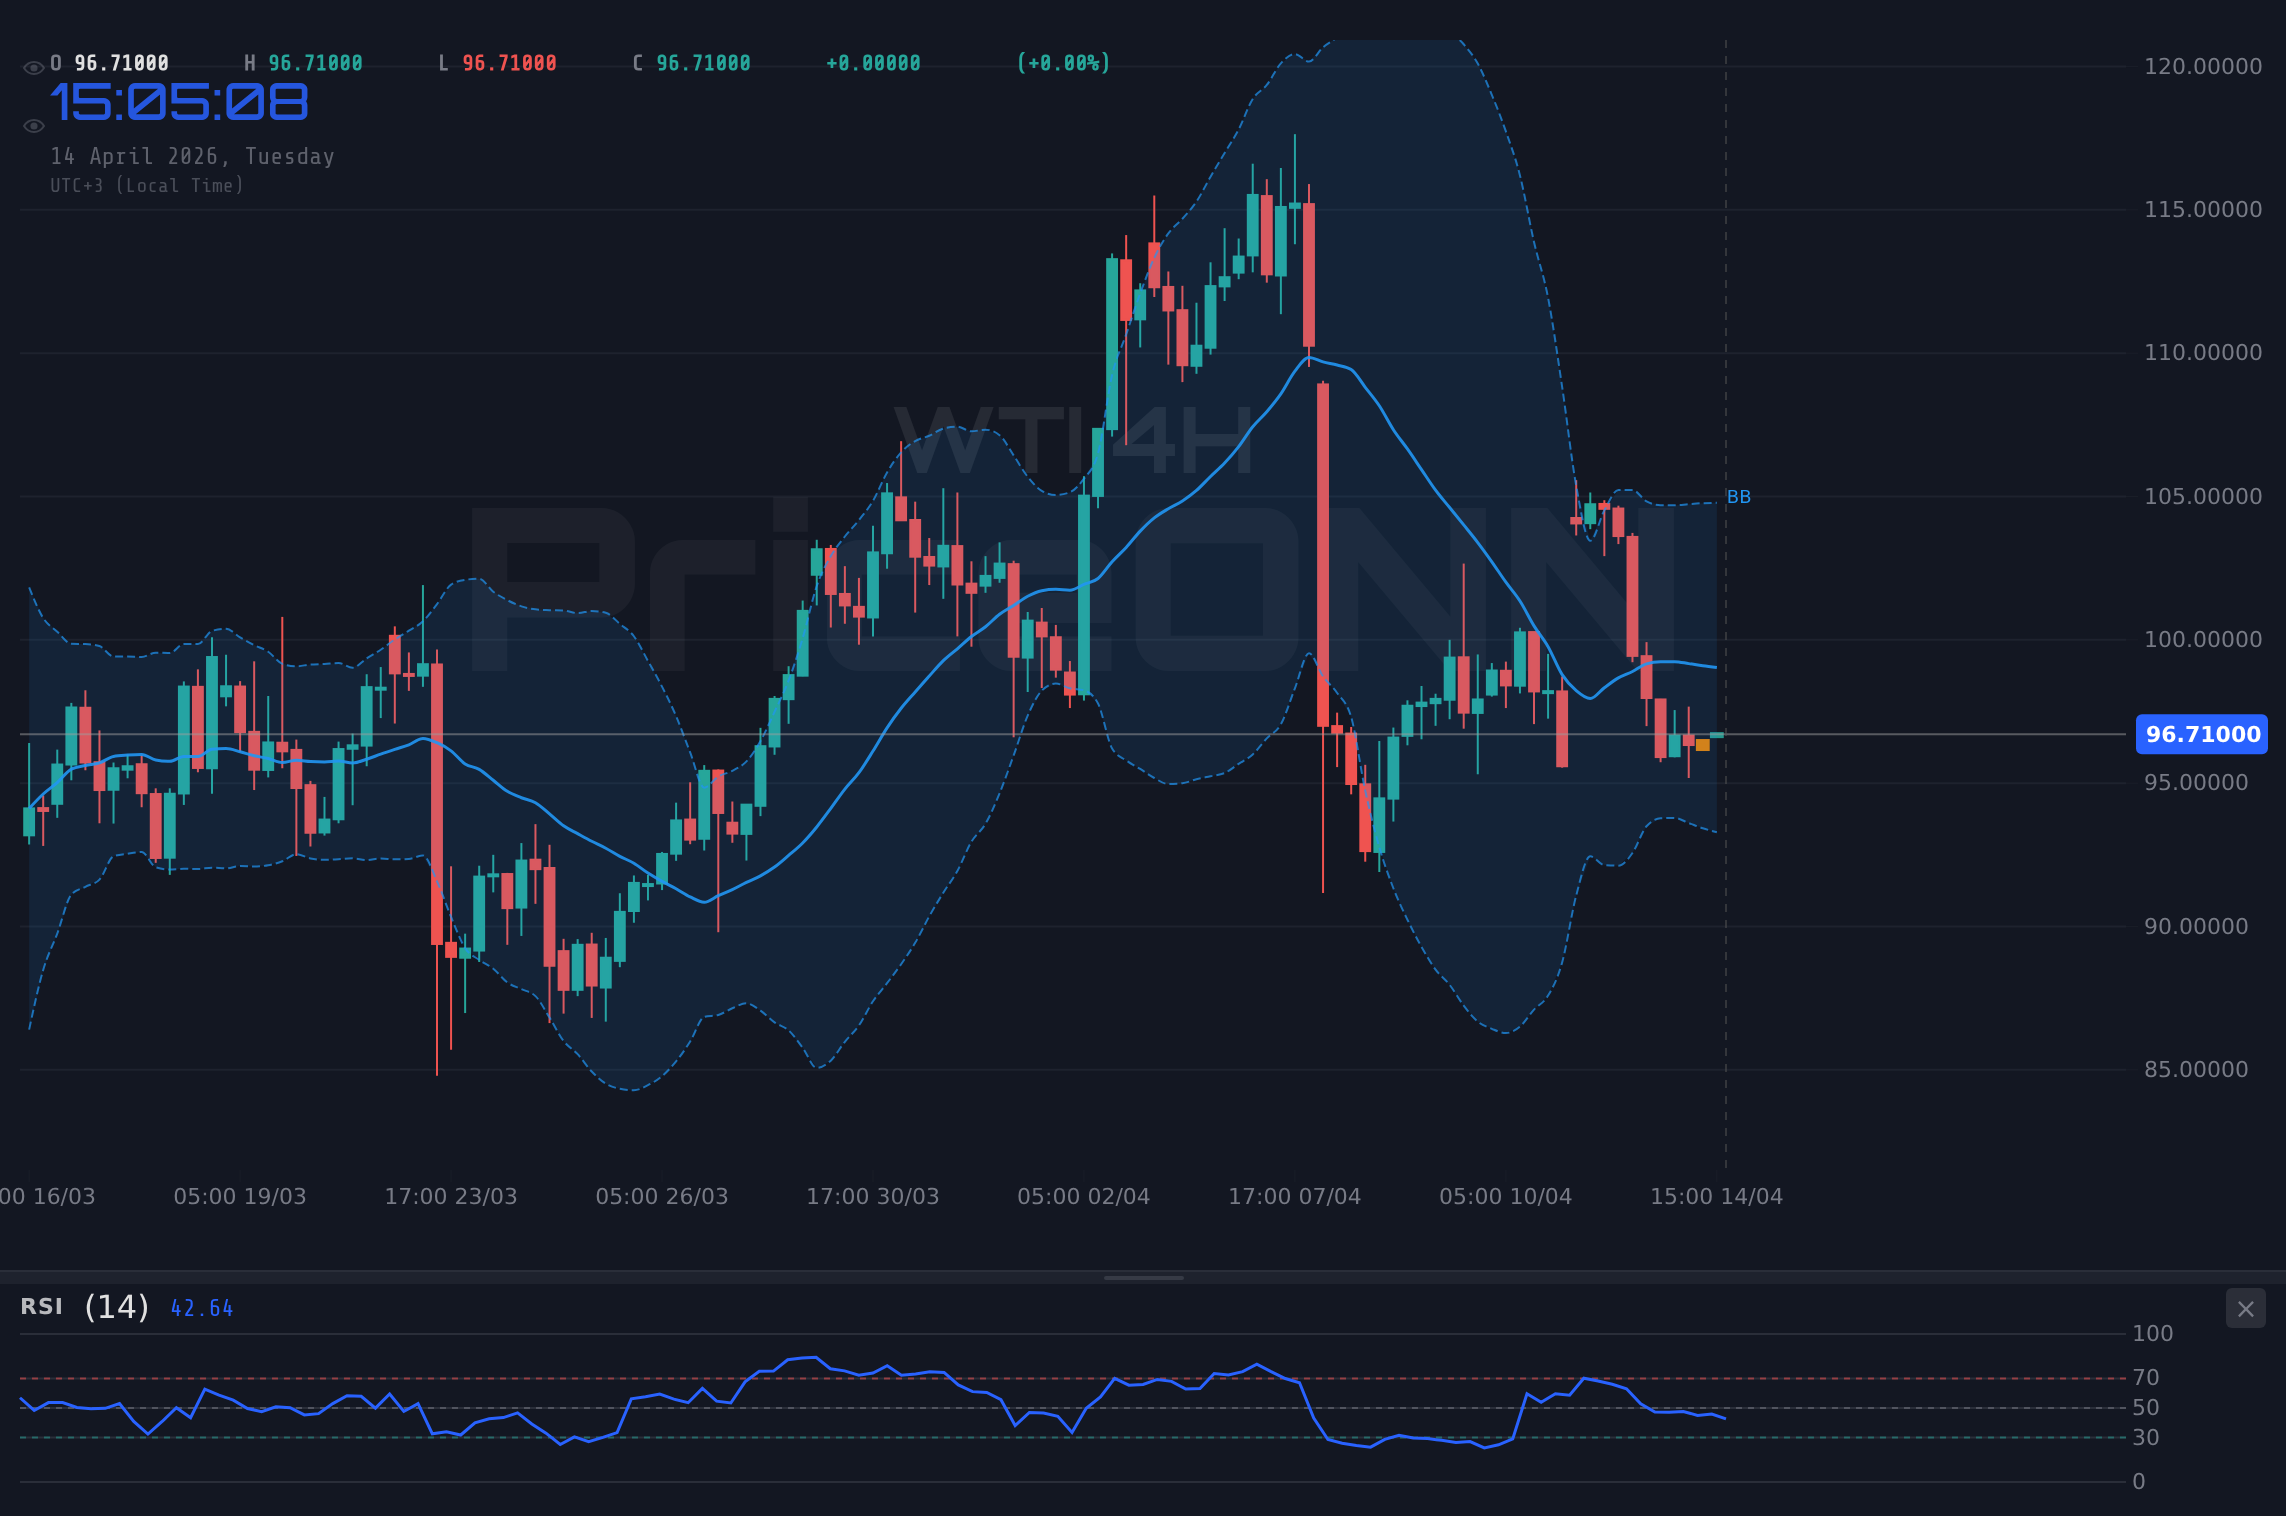
The immediate technical picture for WTI, particularly on the 4-hour timeframe, offers a compelling argument for the bulls. The ADX is reading 29.11, indicating a strong, established uptrend. This isn't just a fleeting blip; it suggests sustained directional movement. When the ADX is in this zone, it typically means that price action is committed, and trend-following strategies can be highly effective. The MACD on the 4-hour chart also aligns with this bullish sentiment, showing positive momentum and trading above its signal line. This suggests that buying pressure is currently dominant and that upside potential is being favored by market participants. Furthermore, the Stochastic Oscillator on the 4-hour chart, with K at 9.94 and D at 41.74, is signaling a potential upward reversal from oversold conditions, though it's important to note that K is still below D, hinting at caution. The fact that the price is trading above the middle Bollinger Band on this timeframe reinforces the bullish inclination, indicating that buyers are in control of the immediate price action.
On the 1-hour chart, the picture is more nuanced but still leans bullish. The ADX at 33.52 confirms a strong trend, albeit with slightly more downward pressure indicated by the RSI at 40.53. However, the MACD is showing positive momentum, and the Stochastic K line (69.06) has crossed above the D line (61.06), presenting a bullish crossover signal. This confluence of indicators, despite the slightly lower RSI, suggests that the short-term trend remains intact, and any dips could be seen as buying opportunities. The price is currently trading below the middle Bollinger Band on the 1H chart, which might seem contradictory, but in a strong trend, price can hug the bands. The key here is that the overall trend strength indicated by the ADX remains high, suggesting that even with minor pullbacks, the underlying bullish bias could persist.
Looking at the daily chart, the bulls have more to work with, although the picture is not as clear-cut as on the shorter timeframes. The ADX is at 46.84, which is extremely strong, indicating a powerful trend. While the RSI at 52.27 is in neutral territory, it's trending upwards, suggesting that there is still room for price appreciation before hitting overbought conditions. The MACD is showing negative momentum, which is a divergence from the shorter timeframes and a point of caution. However, the Stochastic K line (21.14) is below the D line (43.02), but both are in oversold territory, hinting at a potential bounce. The price is trading below the middle Bollinger Band on the daily chart, which is a bearish sign in isolation. Yet, considering the extremely strong ADX, this could indicate a period of consolidation before the next leg up, or that the daily trend is still establishing itself after a period of sideways movement. The key levels on the daily chart provide further context: support at $94.78 and resistance at $103.36, defining the broader trading range.
The Bear Case: Cracks in the Foundation
Despite the bullish signals on shorter timeframes, several factors warrant caution for the bears. The most significant concern arises from the daily chart's indicators. While the ADX is exceptionally strong at 46.84, suggesting a powerful trend, the MACD is exhibiting negative momentum. This divergence is critical: it implies that the underlying strength driving the recent price action might be waning, even if the price itself is still moving in a generally upward direction. A negative MACD histogram on the daily chart is a warning sign that the upward momentum is fading, and a potential reversal or significant pullback could be on the horizon. Furthermore, the Stochastic Oscillator on the daily timeframe shows the K line (21.14) below the D line (43.02), both positioned in oversold territory. While this can sometimes precede a bullish bounce, it also indicates that selling pressure has been dominant recently, and a failure to break higher could lead to further downside.
The price trading below the middle Bollinger Band on the daily chart is another bearish flag. In a strong uptrend, prices tend to stay above the middle band. Being below it suggests that the immediate trend might be weakening or that a correction is underway. Adding to this concern is the RSI at 52.27, which, while not overtly bearish, is hovering just above the midpoint and shows a slight downward lean. This suggests that buying conviction isn't overwhelming. The 1-hour chart also presents bearish elements. The RSI at 40.53 indicates that momentum is not strongly bullish, and the price is trading below the middle Bollinger Band. While the Stochastic crossover is bullish, it comes from a relatively high reading, and its reliability can be diminished in choppy markets. The conflict between the strong ADX and the weaker momentum indicators across different timeframes creates ambiguity, suggesting that the current bullish trend might be vulnerable to a sharp reversal if key support levels fail.
Geopolitical news also presents a potential headwind for WTI. Recent reports indicated that crude oil futures slipped below $92 amid US-Iran talks. While the current price is above this level at $96.74, the mere possibility of de-escalation in the Middle East could remove a significant risk premium that has been supporting oil prices. If diplomatic efforts yield any positive results, even minor ones, it could trigger a sell-off as traders unwind their long positions built on geopolitical fears. The market's reaction to such news highlights its sensitivity to global stability. While the current price action might be driven by supply concerns, any shift in the geopolitical landscape could quickly alter the sentiment and lead to a rapid price decline, testing the lower support levels.
Navigating the Technical Landscape: Key Levels and Indicators
The technical indicators provide a mixed yet actionable picture for WTI traders. On the 1-hour chart, the ADX at 33.52 signifies a strong trend, while the RSI at 40.53 suggests some cooling momentum. The Stochastic K line's bullish crossover above D (69.06 vs 61.06) is a short-term buy signal, but the price is below the middle Bollinger Band, indicating potential resistance. Support is seen at $96.43, $95.57, and $95.04, while resistance lies at $97.82, $98.35, and $99.21. The 4-hour timeframe paints a more bullish picture with an ADX of 29.11 supporting a strong uptrend. The RSI at 42.56 is neutral, and the Stochastic (K=9.94, D=41.74) is showing a bearish signal, which contradicts the overall trend strength. The price is below the middle Bollinger Band here too, but support at $95.86, $95.05, and $94.21 are crucial.
The daily timeframe presents the most conflicting data. The ADX at 46.84 is exceptionally strong, indicating a powerful trend, yet the MACD shows negative momentum and the Stochastic (K=21.14, D=43.02) is oversold with a bearish signal. The RSI at 52.27 is neutral but leaning up. The price trading below the daily middle Bollinger Band is a concern. Daily support levels are identified at $94.78, $91.60, and $86.20, with significant resistance at $103.36, $108.76, and $109.62. This wider daily range suggests that while shorter-term trends might be bullish, the longer-term picture requires careful monitoring. The divergence between the strong daily ADX and the weaker momentum indicators (MACD, Stochastic) is a critical point of analysis, suggesting that the current trend's sustainability is in question without further confirmation.
Correlation analysis with the US Dollar Index (DXY) and broader market sentiment is also vital. With the DXY currently at 97.8, showing a bearish trend on the 1H and 4H charts (ADX 44.56 and 39.08 respectively), a weaker dollar typically supports oil prices. The DXY's current weakness could be a tailwind for WTI. However, the SP500 is showing a bullish trend on the 1H (ADX 49.72) and 4H (ADX 24.23) but a strong bearish trend on the daily (ADX 47.51). This mixed signal from equities adds complexity. If risk appetite continues to wane, as suggested by the daily SP500 trend, it could eventually weigh on commodities like WTI, despite the weaker dollar. The interplay between these correlated assets needs constant monitoring; a sustained drop in the SP500 could override the positive impact of a weaker dollar.
Trade Scenarios: Charting the Path Forward
Bearish Scenario: Trend Reversal Looms
55% ProbabilityBullish Scenario: Momentum Continues
35% ProbabilityNeutral Scenario: Consolidation Zone
10% ProbabilityThe Verdict: A Tightrope Walk at $96.74
The current technical setup for WTI presents a classic bull vs bear scenario, with the $96.74 price point acting as the battleground. The strong ADX readings on multiple timeframes suggest a prevailing trend, but the conflicting signals from other indicators, particularly on the daily chart, introduce significant uncertainty. The bearish scenario, carrying a 55% probability, hinges on a break below the crucial 4-hour support at $95.86. This would invalidate the short-term bullish momentum and open the door for a move towards $95.05 and potentially $94.21. The strength of the daily ADX at 46.84, while indicating a strong trend, also means that a reversal, if it occurs, could be sharp and swift, making the invalidation level at $97.51 critical to watch.
The bullish scenario, assigned a 35% probability, requires WTI to hold above the 1-hour support at $96.43 and then decisively break the 1-hour resistance at $97.82. Success here would target $98.35 and potentially extend towards $99.16. This path is supported by the bullish Stochastic crossover on the 1-hour chart and the overall strong trend strength indicated by the ADX. However, the negative MACD momentum on the daily and the price lingering below the daily middle Bollinger Band suggest that this bullish continuation might face significant headwinds. The 10% probability neutral scenario anticipates a period of consolidation between $95.86 and $97.51, a range where price action might become choppy as the market digests recent moves and awaits clearer directional cues.
Given the conflicting signals and the significant geopolitical overhang, caution is paramount. The recent news of US-Iran talks potentially easing tensions could remove a key supportive factor for oil prices. While current prices are elevated due to supply concerns, any de-escalation could trigger a rapid unwinding of the geopolitical risk premium. Traders should pay close attention to the $95.86 level. A failure to hold this support, especially on increased volume, would significantly increase the odds of the bearish scenario playing out. Conversely, a sustained break above $97.82, confirmed by rising volume and positive MACD momentum on the daily chart, would lend credibility to the bullish case. For now, the market appears to be walking a tightrope, and clear directional conviction is yet to emerge definitively.
Frequently Asked Questions: WTI Analysis
What happens if WTI breaks below the $95.86 support level?
If WTI closes below $95.86, the bearish scenario becomes more probable. This would likely trigger further selling pressure, targeting the next support levels at $95.05 (4H S2) and potentially $94.21 (4H S3) as the trend's momentum falters.
Should I buy WTI at current levels near $96.74 given the mixed signals?
Buying at current levels requires careful risk management. A bullish confirmation would involve holding $96.43 support and breaking $97.82 resistance, targeting $98.35. However, the risk of a pullback to $95.86 remains significant, making entry at current prices a high-risk proposition without clear confirmation.
Is the RSI at 40.53 on the 1H chart a sell signal for WTI?
An RSI of 40.53 on the 1H chart indicates neutral momentum leaning towards bearish, but it's not an outright sell signal on its own. It suggests that the upward momentum is not strong, and traders should look for confirmation from other indicators or price action before initiating a short position.
How could US-Iran talks affect WTI prices this week?
Easing geopolitical tensions from successful US-Iran talks could remove a significant risk premium from oil prices, potentially leading to a sharp decline in WTI. If diplomatic progress is made, expect downward pressure, testing support levels like $95.86, as traders unwind long positions.
Track markets in real-time
AI-powered analysis, technical indicators and real-time price data.
Join Our Telegram Channel
Breaking market news, AI analysis and trading signals instantly.
Join Channel