
DXY Tests Key Support Near $97.81 Amidst Shifting Market Sentiment
The US Dollar Index (DXY) is probing critical support around $97.81. With mixed signals from technical indicators and evolving geopolitical risks, traders are watching closely for potential directional cues.
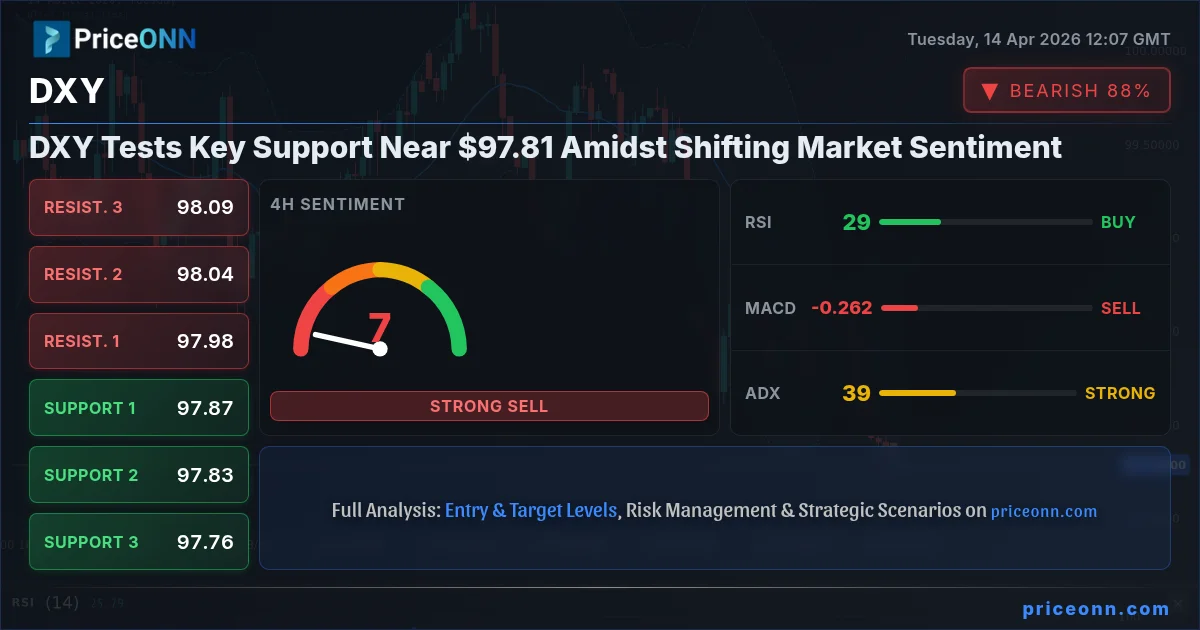
The Dollar Index (DXY) is currently navigating a pivotal juncture, hovering precariously near the $97.81 mark. This level is more than just a number; it represents a critical support zone that has held firm in the past, and its defense is paramount for any sustained dollar strength. Having recently retreated from higher levels, the DXY's technical posture presents a complex picture, characterized by conflicting signals across various timeframes and indicators. Understanding the interplay between these technical readings, the broader market sentiment, and the ever-present geopolitical undercurrents is crucial for any trader aiming to navigate this volatile landscape. My analysis today will delve into the intricate details of the DXY's current technical setup, exploring the potential scenarios that could unfold and what they mean for short-term and medium-term trading strategies. We'll dissect the indicator readings, examine the crucial support and resistance levels, and consider how recent market events might be influencing the dollar's trajectory.
- The DXY is currently testing critical support at $97.81, a level that has historically acted as a floor for the dollar index.
- Technical indicators present a mixed picture: RSI at 33.49 on the 1H chart suggests oversold conditions, while ADX readings indicate strong trend momentum (44.56 on 1H).
- Recent geopolitical tensions and evolving central bank expectations are creating a complex backdrop for the dollar's next move.
- The immediate price action around $97.81 will be key, with a decisive break below potentially opening the door to further declines towards $97.72 and $97.67.
The 1-hour chart paints a picture of immediate pressure. The DXY's current price of $97.81 finds itself battling against a strong downtrend momentum, evidenced by an ADX reading of 44.56. This suggests that whatever direction the market is heading, it's doing so with conviction. However, the RSI(14) sits at a relatively low 33.49, flirting with oversold territory. This divergence - strong trend momentum but approaching oversold conditions - often signals a potential pause or even a short-lived reversal. The MACD is also firmly in negative territory, with its histogram below the signal line, reinforcing the bearish short-term sentiment. The Stochastic Oscillator, with %K at 38.44 and %D at 29.48, is showing a potential upward cross, hinting at a possible short-term bounce. This short-term outlook is cautious, leaning towards a potential technical bounce from oversold conditions, but the overarching trend is undeniably down for now.
Zooming out to the 4-hour timeframe, the picture becomes even more bearish. The trend is overwhelmingly classified as 'Düşüş' (Down) with a power score of 100%, and the ADX at 39.08 confirms a strong, albeit slightly weaker than the 1H, trend. The RSI(14) here is even more telling, sitting at a deeply oversold 29.42. This is a classic 'buy' signal from the RSI perspective, suggesting that the downward momentum may be overextended. The MACD remains negative, and the Bollinger Bands show the price trading below the lower band, indicating extreme bearish pressure and a potential for a reversion to the mean. The Stochastic Oscillator, however, shows %K at 4.97 and %D at 28.58, still indicating a strong downtrend and not yet showing signs of a bullish cross. Despite the oversold RSI, the overall technical structure on the 4-hour chart suggests that the path of least resistance remains to the downside, but the oversold conditions are becoming harder to ignore. Any significant bounce could be triggered if this oversold condition persists.
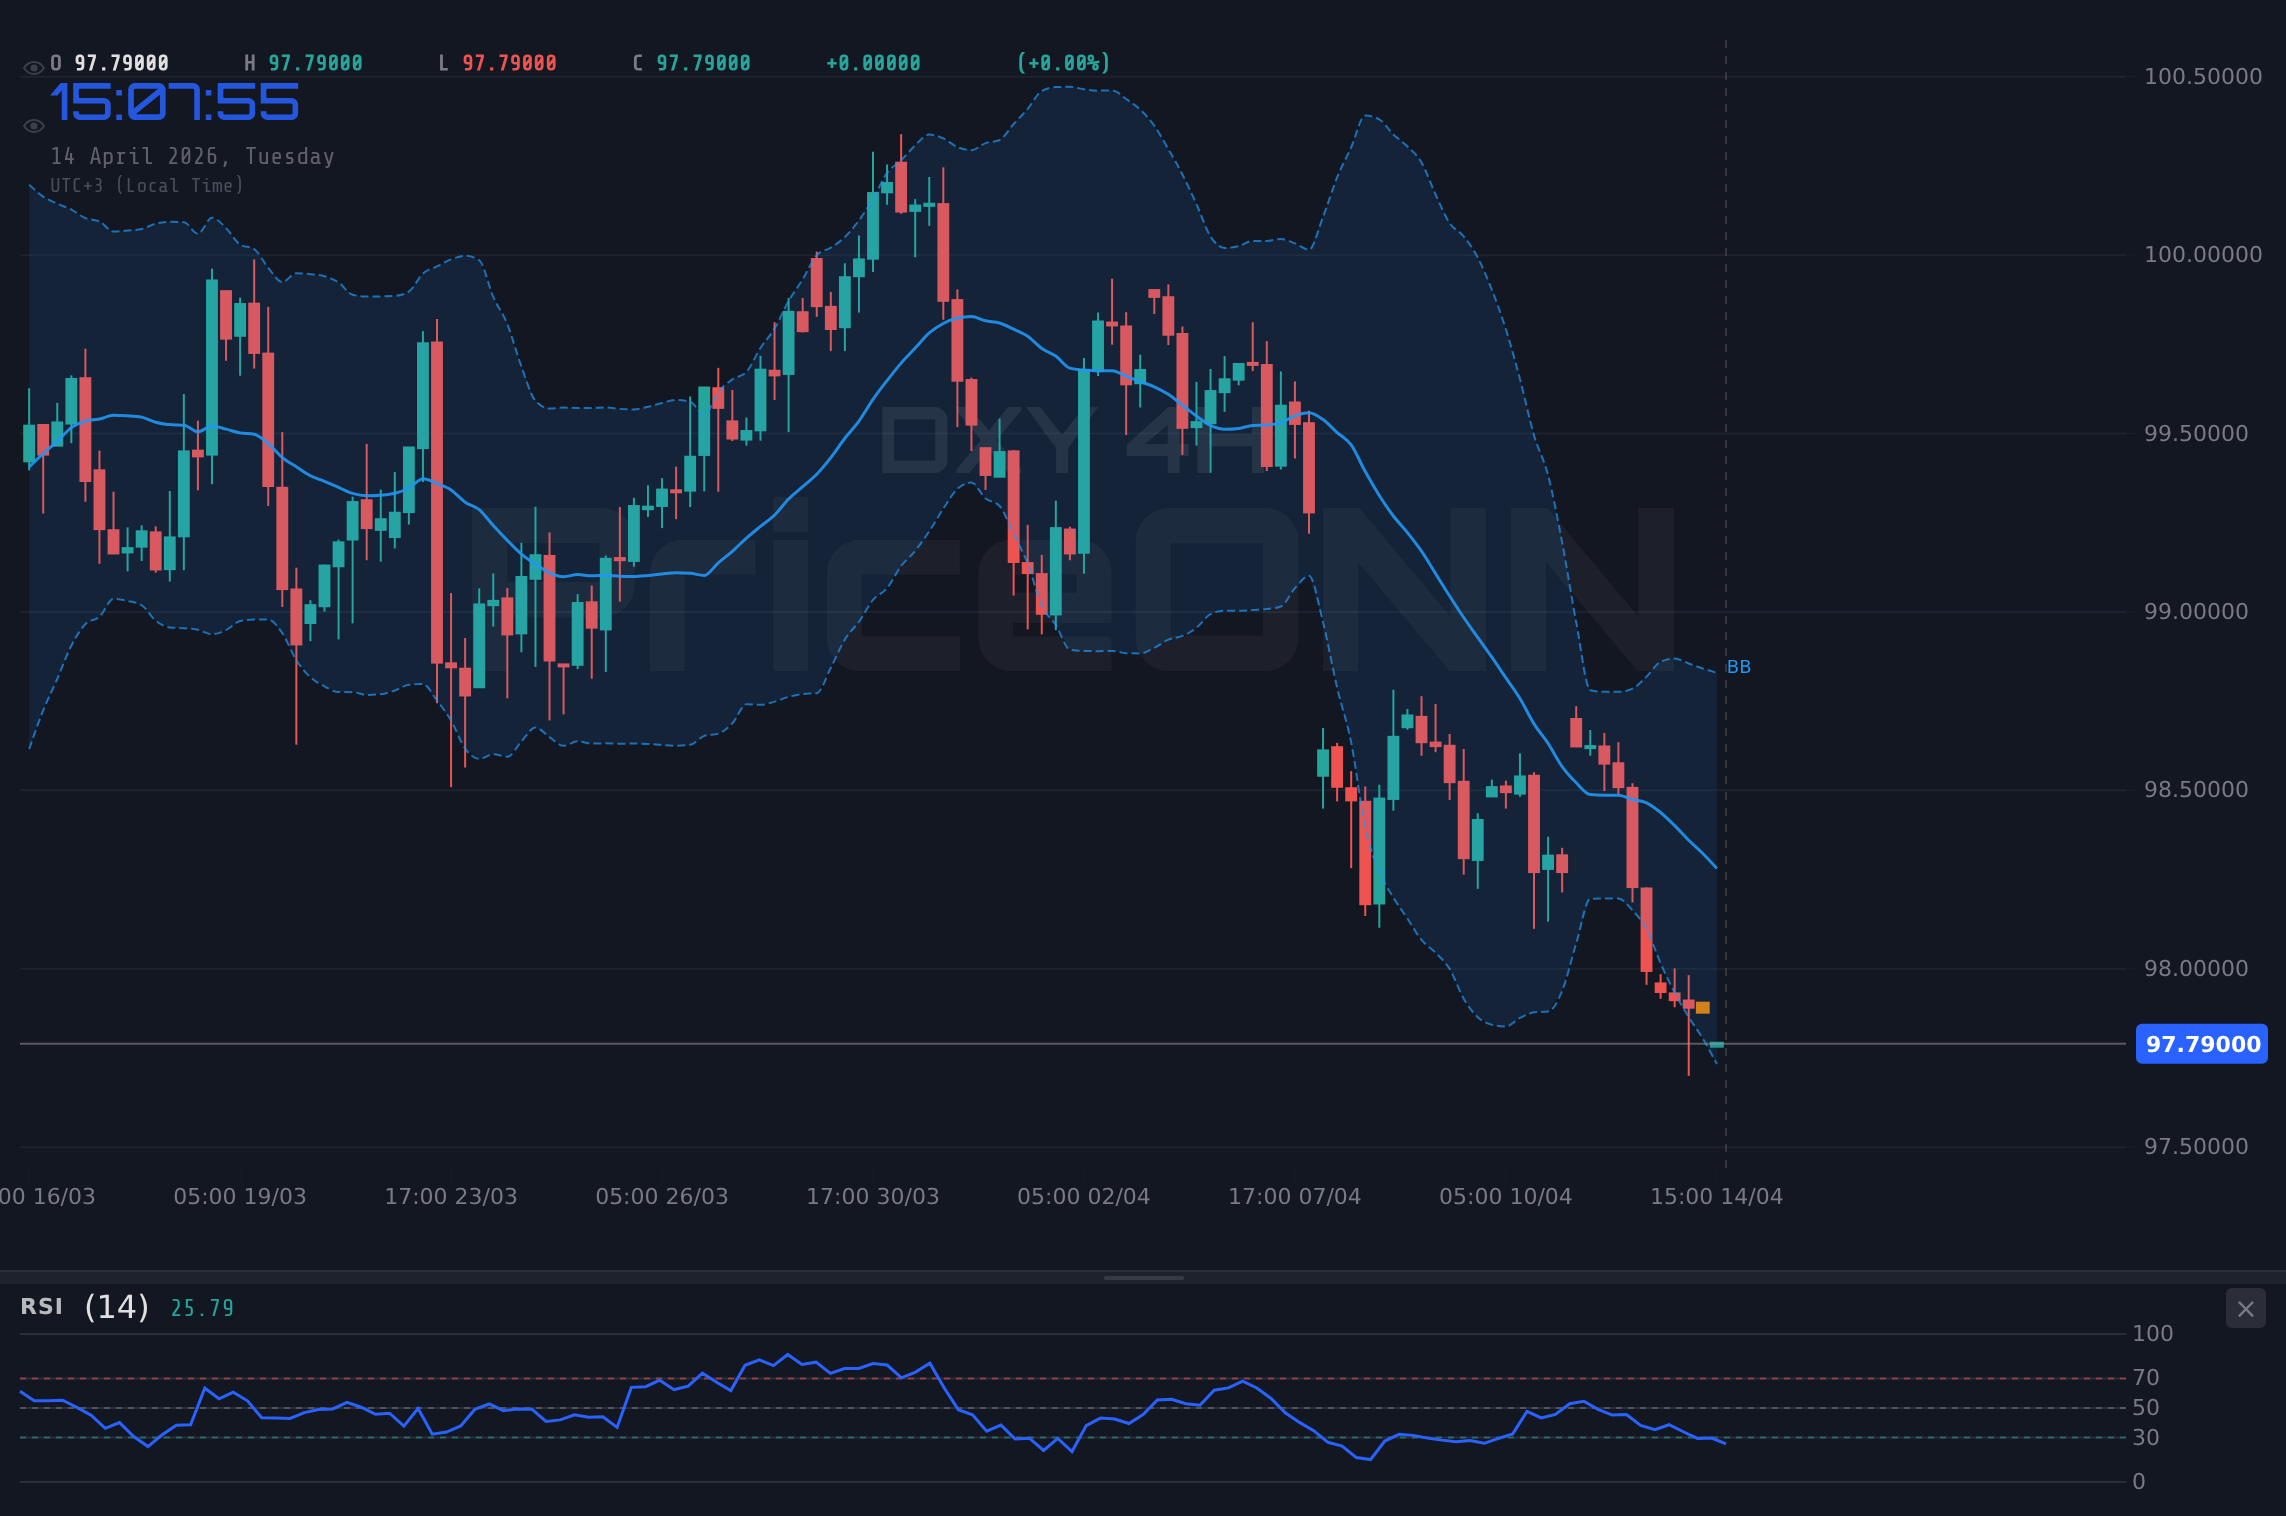
On the daily chart, the DXY's trend is technically classified as 'Nötr' (Neutral) with a power score of 50%. This neutrality, however, is deceptive. While the overall trend might be consolidating, the indicators are largely leaning bearish. The RSI(14) is at 38.95, indicating a downward drift but still some distance from extreme oversold territory. The MACD histogram is printing negative values, and the MACD line is below the signal line, supporting the bearish sentiment. The price is trading below the middle Bollinger Band, suggesting downward pressure. The Stochastic Oscillator, with %K at 4.51 and %D at 23.72, is deeply oversold and showing a bearish signal (%K
Analyzing Key Levels and Potential Price Action
The immediate battleground for the DXY is undoubtedly around the $97.81 level. The provided data shows immediate support at $97.75, followed by $97.72 and $97.67. A decisive close below $97.81, particularly on the hourly or 4-hour chart, would confirm a breakdown through this critical support zone. Such a move would likely trigger further selling, targeting the $97.75 level first. If that psychological and technical barrier fails to hold, the next logical targets would be $97.72 and potentially down to $97.67. These levels represent significant areas where buying interest has previously emerged, and a breach would signal a substantial shift in market sentiment. On the flip side, if the DXY can muster a recovery from current levels, the immediate resistance lies at $97.83, then $97.88, and further up at $97.91. Holding above these levels would be necessary for any meaningful short-term bullish reversal. The confluence of these support levels and the oversold readings on longer timeframes creates a scenario where a bounce is technically plausible, but the underlying trend remains a significant headwind.
The interplay between the DXY and other major markets is crucial for context. As the Dollar Index weakens, we often see a corresponding strength in commodities like gold (XAUUSD) and silver (XAGUSD), and a potential rally in major currency pairs like EURUSD and GBPUSD. Currently, XAUUSD is trading strong at $4776.12, and XAGUSD is surging at $77.75, indicating a demand for safe-haven assets or a response to inflationary pressures potentially exacerbated by geopolitical events. EURUSD is at 1.17935 and GBPUSD at 1.35677, both showing upward momentum, which aligns with a weaker dollar. Conversely, USDJPY is showing weakness, trading at 158.873, which is consistent with a general dollar decline, although the yen's own dynamics play a significant role. Equity markets, like the SP500 at 6572.87 and Nasdaq100 at 25521.74, are showing mixed signals. The SP500's daily trend is classified as bearish (45.35 RSI), while Nasdaq shows a neutral daily trend with a strong 1H ADX. This divergence suggests that while there might be some risk appetite, it's not universally strong, and the dollar's weakness could be driven more by specific dollar-centric factors or a flight to other perceived safe havens rather than a broad risk-on sentiment.
Recent news flow adds another layer of complexity. Reports indicate that while crude oil prices have seen some fluctuations, geopolitical tensions remain elevated, particularly concerning the Middle East. Although specific news about US-Iran talks easing tensions was mentioned, the underlying risk premium in oil prices, currently at $100.13 for Brent and $96.67 for WTI, suggests that these risks are far from abated. This persistent geopolitical uncertainty often fuels demand for safe-haven assets, which can include the US dollar in certain scenarios, but more frequently benefits gold and silver. The market is also keenly aware of upcoming central bank communications. While specific Fed meeting minutes or statements aren't detailed in the provided data, the general expectation surrounding central bank policies – particularly regarding inflation and interest rates – is a constant driver of currency markets. If market participants perceive a more hawkish stance from the Federal Reserve, it could provide a significant tailwind for the DXY, even amidst current technical weakness. Conversely, any hint of a dovish pivot would likely exacerbate the dollar's decline.
From a technical perspective, the Stochastic Oscillator on the daily chart, with %K at 4.51 and %D at 23.72, is deeply oversold. This suggests that the selling pressure might be approaching exhaustion. However, it's crucial to remember that oscillators can remain in oversold or overbought territory for extended periods, especially in strong trending markets. The ADX at 25.3 on the daily chart indicates a strong downtrend, reinforcing the idea that simply being oversold isn't enough to call for a bottom. The MACD histogram is negative, and the MACD line is below the signal line, aligning with the bearish sentiment. The divergence between the oversold Stochastic and the strong ADX is a key point of analysis. It suggests that while the market is technically 'due' for a bounce, the underlying trend is still powerful enough to potentially ignore these signals in the short to medium term. Confirmation of a bottom would likely require a bullish MACD crossover, a sustained move back above the middle Bollinger Band, and crucially, a break of immediate resistance levels.
Considering the trade plan, the current setup leans towards a potential short-covering rally or a bounce from oversold conditions, but the overall trend remains bearish. The decision score of 5/8 suggests a tradeable setup, but with significant caution warranted. The strong ADX readings (44.56 on 1H, 39.08 on 4H, 25.3 on 1D) indicate that trend-following strategies might still be in play, but the oversold conditions on the 4H and 1D charts cannot be ignored. The immediate focus must be on the $97.81 support. A failure to hold this level could signal a continuation of the downtrend, while a successful defense might lead to a retracement. Given the conflicting signals, the neutral scenario carries a significant probability. The key will be how price reacts to the immediate support and resistance zones in the coming hours.
Scenario Analysis: Navigating the DXY's Path
Bearish Scenario: Breakdown Below Critical Support
60% ProbabilityNeutral Scenario: Consolidation and Volatility
30% ProbabilityBullish Scenario: Bounce from Oversold Conditions
10% ProbabilityThe immediate path for the DXY hinges on its ability to hold the $97.81 support. The technical indicators, particularly the oversold readings on the 4-hour and daily charts, suggest that a bounce is plausible. However, the strong downtrend momentum indicated by the ADX and MACD cannot be discounted. The prevailing sentiment among traders will likely be one of caution, waiting for a clearer signal. A break below $97.75 would invalidate any immediate bullish hopes and signal a continuation of the downtrend, potentially attracting further sellers. Conversely, a successful defense of $97.81 could lead to a short-covering rally, pushing the index back towards the $97.88-$97.91 resistance zone. The geopolitical landscape and any hints from central bank policy will be crucial catalysts to watch, potentially providing the directional impetus that current technicals are struggling to deliver definitively.
Frequently Asked Questions: DXY Analysis
What happens if DXY breaks below $97.75 support?
A decisive break below $97.75 would signal a continuation of the bearish trend, likely triggering further selling pressure. The next key support level to watch would be $97.72, followed by $97.67. This scenario implies that the oversold conditions are not yet enough to halt the downward momentum.
Should I consider buying DXY at current levels near $97.81 given the oversold RSI?
While the RSI at 33.49 on the 1H chart suggests oversold conditions, caution is advised. The strong ADX reading of 44.56 indicates robust downtrend momentum. A bounce is possible, but confirmation is needed. Consider waiting for a clear bullish signal, such as holding above $97.81 with a bullish candlestick pattern, before initiating long positions. A probability of 10% is assigned to a bullish scenario from these levels.
Is the RSI at 33.49 a strong sell signal for DXY right now?
An RSI reading of 33.49 technically indicates oversold conditions, which can precede a bounce rather than signal a direct sell. However, when combined with strong downtrend momentum (ADX 44.56), it suggests the selling might be overextended but not necessarily reversing. The actual sell signal would be a continuation of the downtrend below immediate support levels.
How might upcoming geopolitical tensions affect DXY's move from current $97.81 levels?
Elevated geopolitical tensions typically increase demand for safe-haven assets. While the US dollar can sometimes benefit, current dynamics show gold and silver rallying strongly, suggesting they are preferred safe havens for now. If tensions escalate significantly, it could put further pressure on riskier assets and potentially bolster the DXY, but the immediate technical picture suggests dollar weakness is more likely unless global risk aversion spikes dramatically.
Track markets in real-time
AI-powered analysis, technical indicators and real-time price data.
Join Our Telegram Channel
Breaking market news, AI analysis and trading signals instantly.
Join Channel