
BRENT Crude Oil Slides to $96.26 Amid Easing Geopolitical Tensions
BRENT crude oil is trading at $96.26 after a 2.34% decline. Geopolitical easing reduces risk premium, but key levels loom.
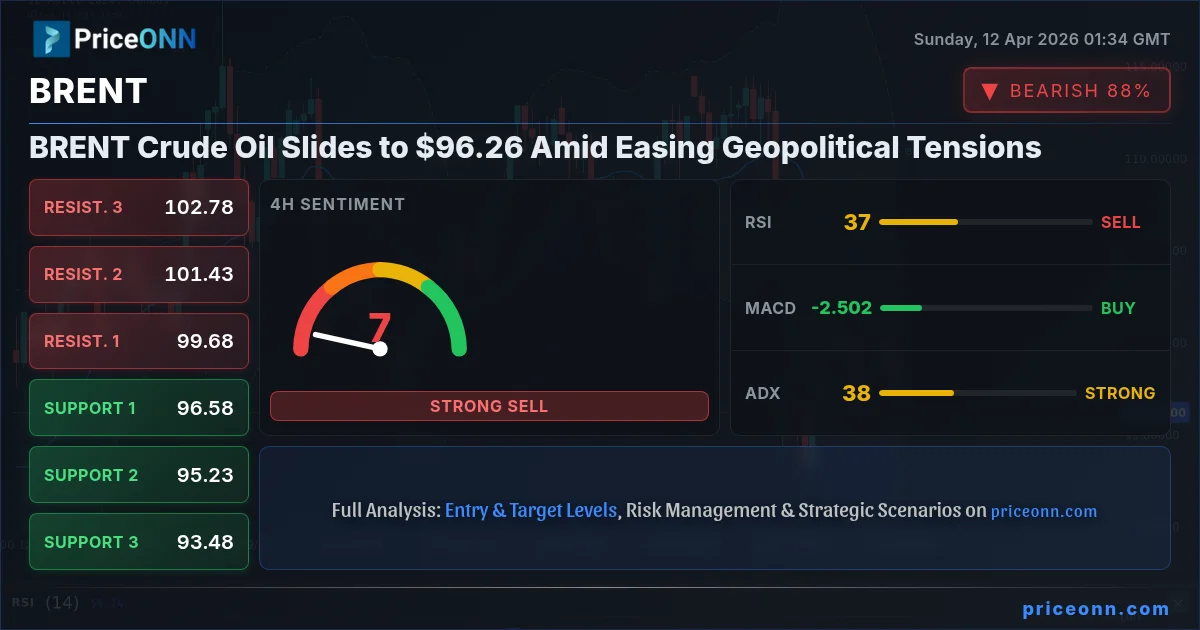
The price of BRENT crude oil experienced a notable drop, closing last Friday near $96.26 after a 2.34% slide, reflecting a shift in market sentiment as geopolitical tensions in the Middle East showed tentative signs of easing. This retreat from recent highs, wiping out a significant portion of the geopolitical risk premium, places BRENT at a critical juncture, with traders and analysts closely watching key support and resistance levels to gauge the next directional move. The market's reaction underscores the delicate balance between supply-side anxieties and de-escalation efforts, leaving the outlook for oil prices uncertain as we head into the new trading week.
- Brent crude oil closed Friday at $96.26, down 2.34% on the week as geopolitical tensions eased.
- Critical support for BRENT is identified at $95.64, with a break below potentially targeting $93.14.
- Resistance is now eyed around $98.14 and $100.64, levels that could cap any upward recovery.
- The ADX reading of 37.58 on the 4-hour chart indicates a strong downtrend, suggesting further downside may be probable.
- Easing geopolitical risks are reducing the risk premium, but market participants remain cautious due to lingering supply chain vulnerabilities.
Navigating the Shifting Sands: BRENT's Weekly Retreat
Last week was a volatile period for BRENT crude oil, marked by a significant pullback that saw prices shed 2.34% to settle around the $96.26 mark. This decline was largely driven by a palpable reduction in geopolitical risk premium, spurred by cautious optimism surrounding potential diplomatic breakthroughs in the Middle East. News reports from sources like Reuters and Bloomberg indicated a tentative ceasefire agreement being discussed, which, if realized, could significantly reduce the immediate threat to key oil transit routes like the Strait of Hormuz. This development fundamentally altered the market's risk perception, leading to a sharp sell-off in crude prices that had previously been buoyed by escalating tensions. The market is now reassessing its exposure to geopolitical supply disruptions, shifting focus towards fundamental supply-demand dynamics that may have been overshadowed in recent weeks.
The strong downtrend signal, evidenced by the ADX at 37.58 on the 4-hour timeframe, highlights that the momentum behind this move is substantial. While the daily chart's ADX is also strong at 45.64, the 4-hour timeframe often provides a more immediate indication of intraday and short-term directional bias. This suggests that the selling pressure could persist in the near term, especially if further de-escalation news emerges or if key support levels fail to hold. The market's reaction to this news is a classic example of how quickly sentiment can shift, and how sensitive oil prices remain to geopolitical headlines. Traders are now grappling with whether the easing tensions represent a genuine shift or merely a temporary reprieve, a question that will likely dictate price action in the coming days.
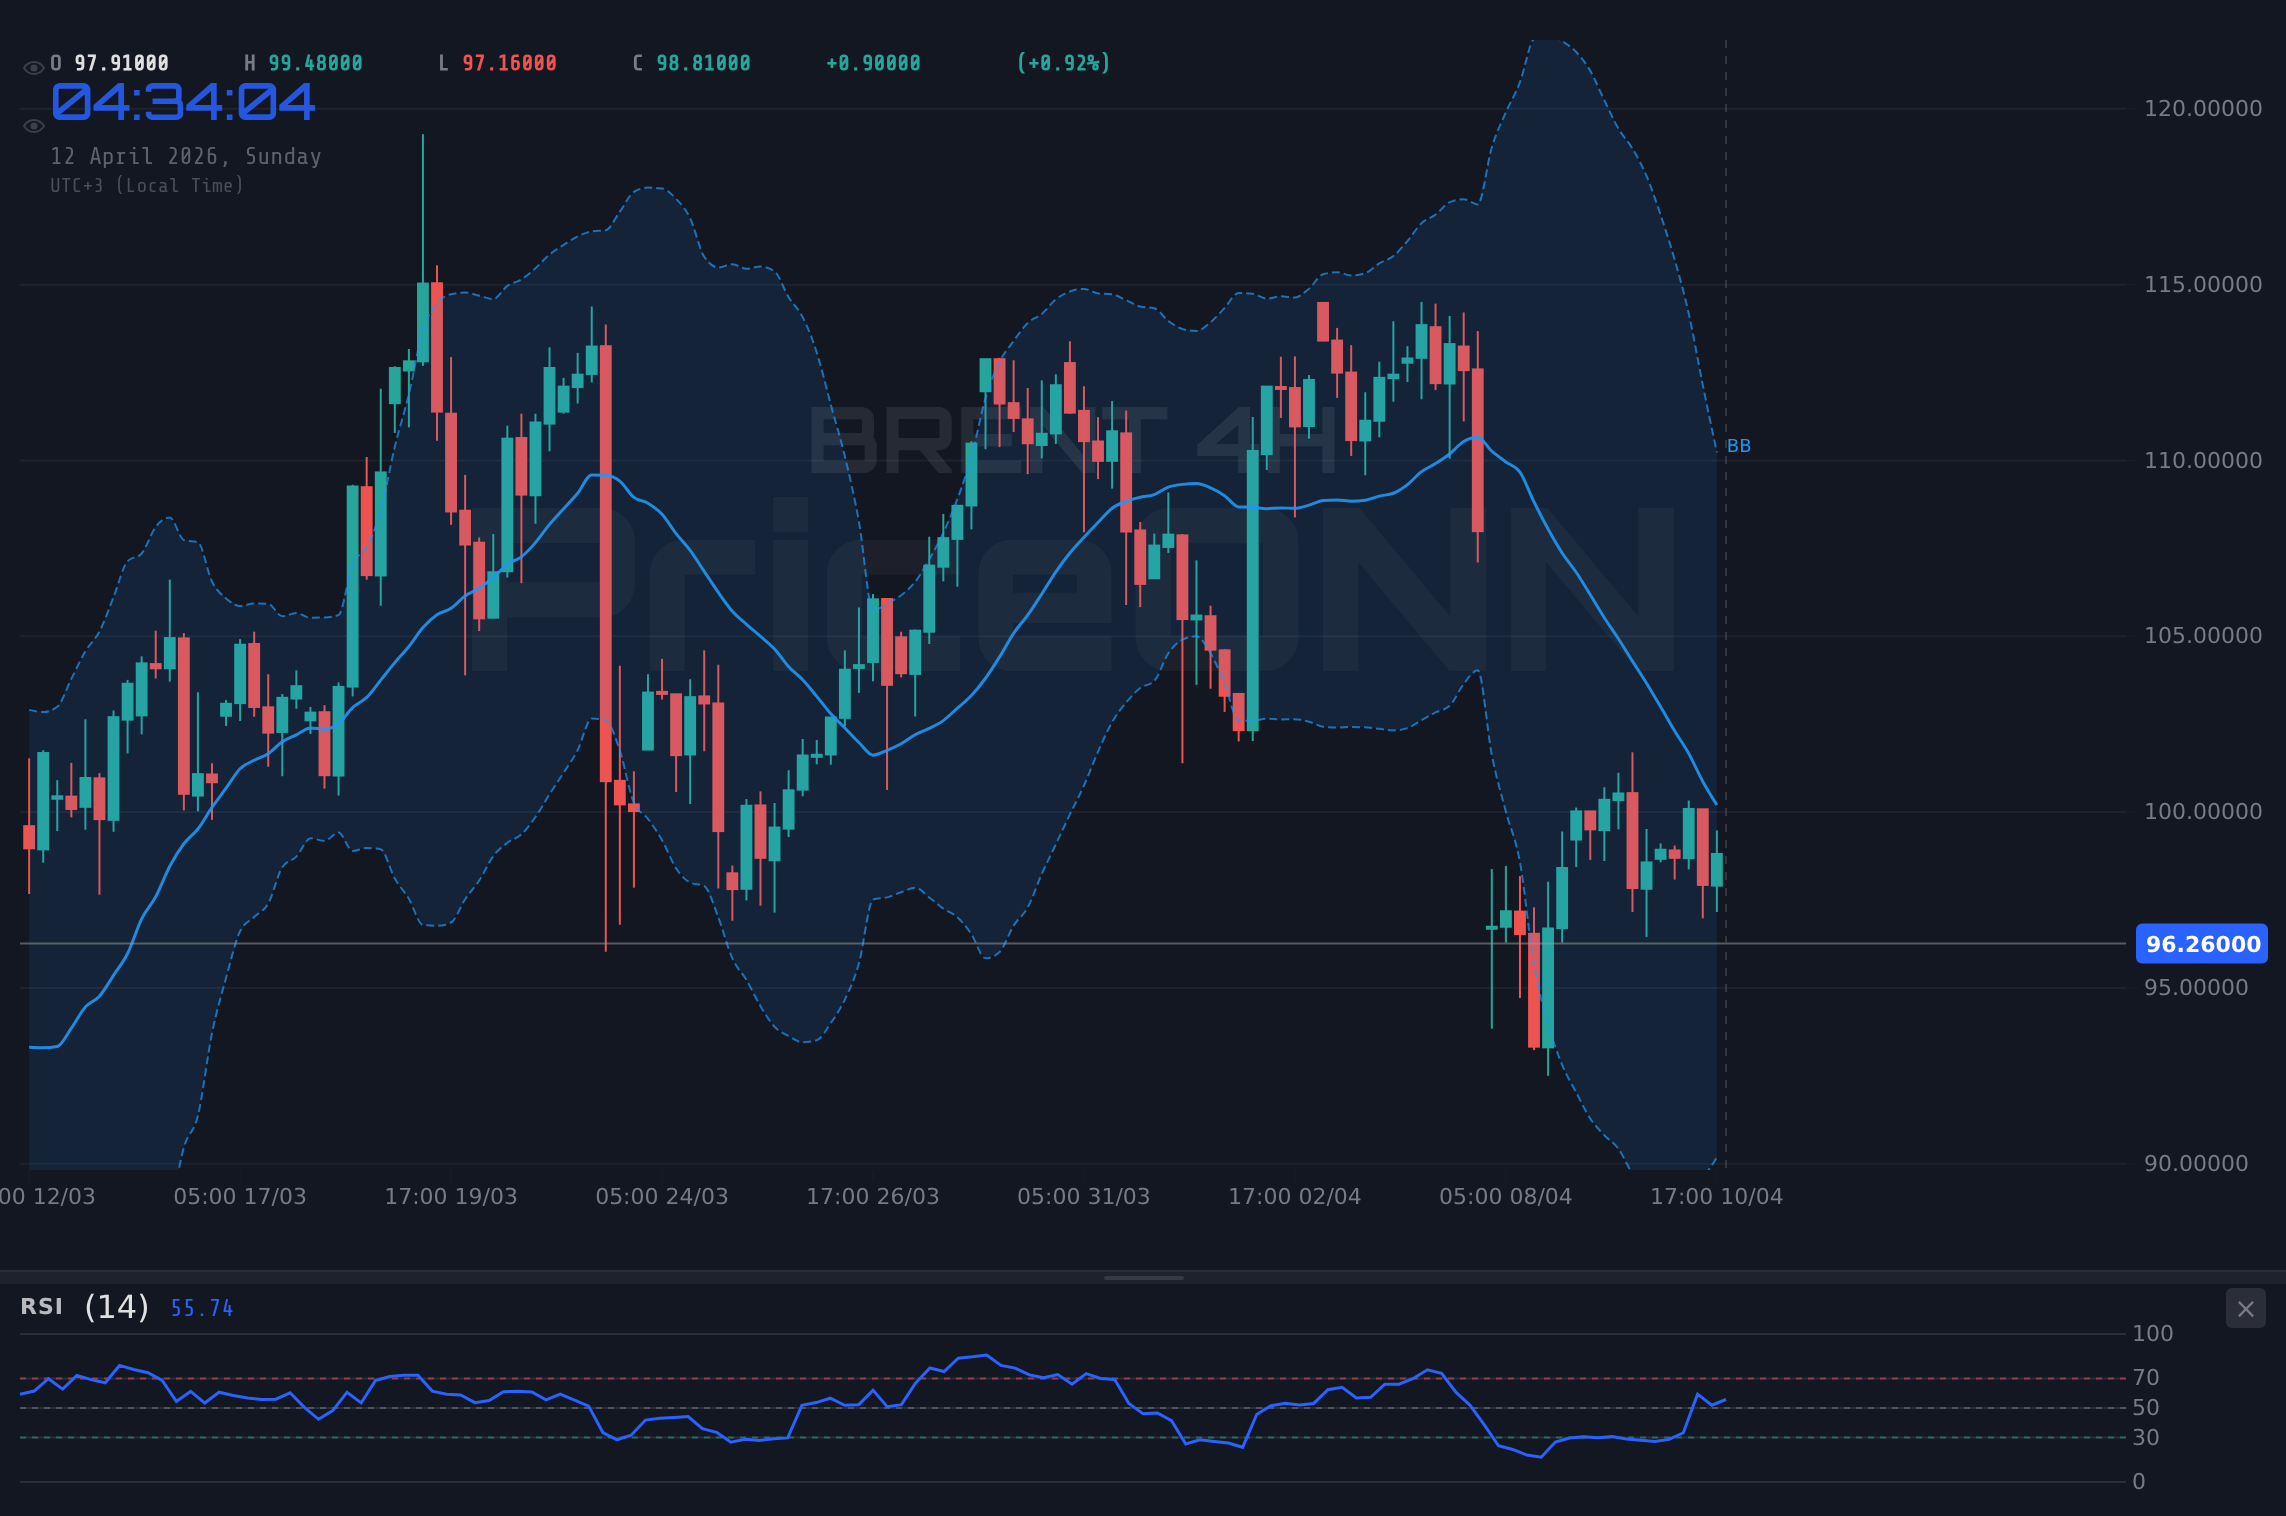
The Bull's Roadmap: Rekindling the Rally Above $98.14
For BRENT crude oil to regain its upward momentum, a decisive break and sustained hold above the immediate resistance level of $98.14 is paramount. This level represents the first significant hurdle that bulls must overcome to signal a potential reversal of the recent downtrend. A successful breach above $98.14, ideally with increasing volume and positive market sentiment, would then target the next resistance at $99.68. Should this level also yield, the psychological threshold of $100.00, and subsequently the higher resistance at $100.64, would become the next objectives. Such a bullish scenario would likely be supported by renewed geopolitical concerns, unexpected supply disruptions, or a significant shift in global economic outlook favoring higher energy demand. Technical indicators would need to align, with RSI moving decisively out of its current oversold territory (below 30, though currently at 36.27 on 1H), and MACD showing a bullish crossover above its signal line. The Stochastic oscillator, currently showing a K value of 20.76 and D value of 38.68 on the 1H chart, would need to turn upwards and break out of its oversold zone to confirm this bullish thesis.
The strength of the trend on the 4-hour chart, indicated by an ADX of 37.58, currently suggests that prevailing momentum is downwards, making a sustained breakout challenging without a significant catalyst. However, if risk appetite returns to the market, or if supply-side fears resurface, this bullish scenario could gain traction. The daily chart's ADX at 45.64 confirms a strong trend, but its direction needs to be confirmed by price action at these key levels. A close above $98.14 on the 1-hour chart, followed by confirmation on the 4-hour chart, would be the initial signal. For this scenario to fully materialize, we would need to see a sustained move above $99.68, ideally pushing towards $101.43 (a 4H resistance level) within the next 24-48 hours. This would suggest that the recent sell-off was merely a correction within a larger uptrend, rather than the beginning of a sustained bear market.
Where Bears Take Control: Testing the $95.64 Floor
Conversely, the bearish outlook for BRENT crude oil remains prominent, particularly given the recent price action and the strong downtrend signals observed across multiple timeframes. The immediate support level to watch is $95.64. A decisive close below this level on the 1-hour chart would confirm the bearish bias and open the door for further downside. The next significant support level lies at $94.68, followed by the more substantial floor at $93.14, which represents a key psychological and technical barrier. A break below $93.14 could trigger a cascade of selling, potentially leading to a rapid test of even lower levels, perhaps towards the $90.86 support identified on the daily chart.
This bearish scenario would be reinforced by continued de-escalation in the Middle East, disappointing economic data from major consuming nations like China or the US, or indications that global oil demand is softening more than anticipated. Technically, sustained readings below the 40 level for RSI on the 1-hour chart (currently 36.27) and a negative MACD crossover would support this view. The Stochastic oscillator's current position (K=20.76, D=38.68 on 1H) already favors further declines. If BRENT closes below $95.64 on the 4-hour chart, and subsequently breaks $94.68, the probability of testing $93.14 increases significantly. The ADX reading of 37.58 on the 4H and 45.64 on the 1D chart strongly suggests that the prevailing trend is downwards, making a bearish continuation the more probable path unless strong bullish catalysts emerge. A sustained period below the middle Bollinger Band on all timeframes would further solidify this bearish outlook.
The Waiting Game: Consolidation Between $95.64 and $98.14
In the absence of clear directional catalysts, BRENT crude oil could find itself consolidating within a defined range, primarily between the immediate support at $95.64 and the resistance at $98.14. This sideways movement often occurs when conflicting market forces are at play: lingering geopolitical fears on one side, and signs of easing tensions or potential demand slowdown on the other. During such a period, volatility might decrease, and price action could become choppy, making it difficult for clear trends to establish themselves. Technical indicators often provide mixed signals in range-bound markets, with RSI oscillating around the 50 level and MACD showing indecisive crossovers.
The ADX readings, currently indicating strong trends (37.58 on 4H, 45.64 on 1D), would typically argue against prolonged consolidation. However, if the geopolitical narrative continues to shift back and forth without a definitive resolution, or if economic data remains ambiguous, price could be trapped. In this neutral scenario, traders might look for opportunities to trade the range boundaries, buying near support ($95.64) and selling near resistance ($98.14), albeit with tighter stop-losses due to the potential for a breakout. The Stochastic oscillator, currently in oversold territory on the 1H chart, might offer short-term buying opportunities if it bounces from these levels, but a sustained move would require breaking out of the established range. This neutral phase could persist until a significant event – either a major geopolitical development or a critical economic data release – forces a resolution.
The Most Probable Path: Bears Still Have the Edge
Considering the current technical setup and the prevailing market narrative, the bearish scenario appears to hold the highest probability in the short to medium term. The strong ADX readings on both the 4-hour (37.58) and daily (45.64) charts strongly indicate that a downtrend is in force, and the recent price action confirms this momentum. While the easing of geopolitical tensions provides a fundamental reason for the decline, the technical indicators are reinforcing this bearish bias. The RSI on the 1-hour chart is hovering at 36.27, suggesting room for further downside before reaching oversold conditions, and the MACD is showing negative momentum. The Stochastic oscillator also favors further declines on the 1-hour timeframe.
Therefore, the most likely scenario is a continued test of support levels, with a higher probability of breaking below $95.64. The probability distribution reflects this bias: a 60% chance of further downside towards $93.14, a 25% chance of consolidation between $95.64 and $98.14, and only a 15% chance of a decisive bullish breakout above $98.14 in the immediate short term. This assessment is contingent on the absence of significant new geopolitical escalations or a sudden surge in global demand expectations. The market's current trajectory, supported by technical signals, suggests that caution is warranted, and traders should be more inclined to look for shorting opportunities or wait for confirmation of a bullish reversal before committing to long positions.
Bearish Continuation: The Path of Least Resistance
60% ProbabilityConsolidation Phase: Caught Between Fear and Hope
25% ProbabilityBullish Reversal: The Uphill Battle
15% ProbabilityWhat I'm Watching This Week
As we step into the new trading week, my focus remains squarely on the interplay between geopolitical headlines and the underlying technical structure of BRENT crude oil. The most crucial element will be the price action around the $95.64 support level. A decisive break below this mark, especially on the 4-hour chart, would significantly increase the probability of a further decline towards $93.14, aligning with the strong bearish trend indicated by the ADX. Conversely, any sustained move above $98.14, confirmed by increasing volume and positive shifts in momentum indicators like MACD, could signal a potential bottom and a move towards higher resistance levels.
Furthermore, I will be closely monitoring the economic calendar for any high-impact data releases, particularly from major economies like the US and China, which could influence global demand expectations. Any unexpected news regarding the Middle East situation, whether positive or negative, will also be critical. The correlation with the US Dollar Index (DXY), currently trading around 98.26 and showing a downtrend on the 1-hour chart, will also be important to watch. A weaker dollar typically supports oil prices, but the current bearish technicals on BRENT suggest this correlation might be temporarily overshadowed. Ultimately, confirmation will come from price action at these key levels, supported by aligned technical indicators.
The current technical picture for BRENT, characterized by strong downtrend signals on multiple timeframes and key levels approaching, suggests a bearish bias. However, the market remains sensitive to geopolitical headlines. A break below $95.64 is the primary bearish trigger, while a sustained move above $98.14 would be needed to invalidate this view and signal a potential bullish reversal. Traders should exercise caution and await clear directional confirmation.
| Indicator | Value | Signal | Interpretation |
|---|---|---|---|
| RSI (14) | 36.27 | Bearish | Nearing oversold conditions, suggesting potential for bounce or continued downtrend pressure. |
| MACD | -1.89 | Bearish | Negative momentum, MACD line below signal line, indicating selling pressure. |
| Stochastic | K:20.76, D:38.68 | Bearish | Both lines in oversold territory, %K below %D, favoring further declines. |
| ADX | 37.58 | Strong Downtrend | Confirms a strong existing trend, favoring continuation of recent price action. |
| Bollinger Bands | Middle Band at 97.05 | Below Middle Band | Price is trading below the middle band, indicating bearish pressure. |
Frequently Asked Questions: BRENT Analysis
What happens if BRENT breaks below the $95.64 support level?
A break below $95.64 on the 1-hour chart would confirm the bearish bias and likely trigger a move towards the next support at $94.68, with a more significant test expected at $93.14. This scenario is supported by strong downtrend signals from ADX and MACD.
Should I consider buying BRENT at current levels around $96.26 given the easing geopolitical risks?
Buying at current levels carries significant risk due to the prevailing bearish trend and strong ADX reading. A more prudent approach would be to wait for confirmation of a bullish reversal, such as a sustained break above $98.14, or for price to test the lower support levels for potential oversold bounces.
Is the RSI at 36.27 a sell signal for BRENT right now?
While the RSI at 36.27 is approaching oversold territory, it is not yet a definitive sell signal on its own. Combined with the MACD's negative momentum and the strong ADX trend, it reinforces the bearish outlook. A bounce might occur near current levels, but a sustained uptrend would require a more significant bullish catalyst.
How might upcoming economic data affect BRENT prices this week, considering the current geopolitical easing?
Upcoming high-impact economic data, particularly from the US and China, could shift focus from geopolitics to demand outlook. Stronger-than-expected economic data might support oil prices by signaling robust demand, potentially challenging the bearish trend. Conversely, weaker data could exacerbate the current sell-off.
Track markets in real-time
AI-powered analysis, technical indicators and real-time price data.
Join Our Telegram Channel
Breaking market news, AI analysis and trading signals instantly.
Join Channel