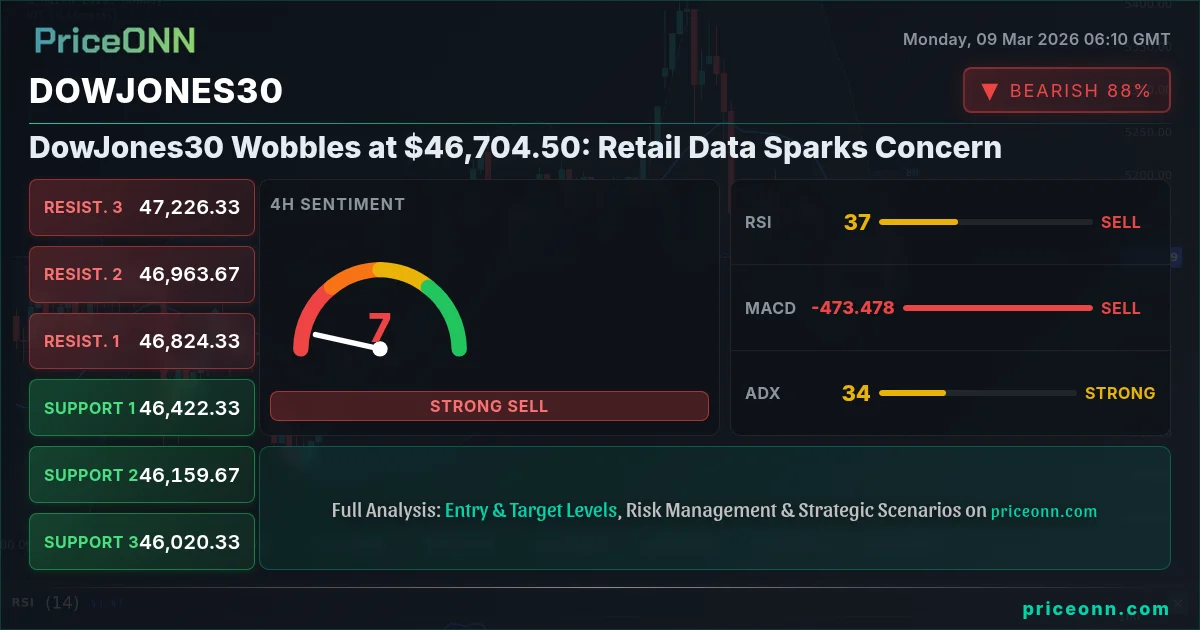
The DowJones30 is facing headwinds, currently hovering around $46,704.50, as weaker-than-expected retail data adds to existing market anxieties. The question now is whether this is a temporary dip or a sign of a more significant correction to come.
- RSI at 35.78 on the 1H chart suggests potential for oversold bounce but overall bearish momentum remains strong.
- Critical support lies at 46,433.33, a break below which could trigger further downside.
- MACD histogram confirms negative momentum, indicating selling pressure is likely to continue.
- DowJones30’s correlation with DXY is strengthening as dollar gains on safe-haven demand.
Having tracked DowJones30 through multiple cycles, the current setup is reminiscent of the Q4 2022 selloff, though the underlying drivers are different. Back then, it was aggressive Fed tightening; today, it’s a combination of growth fears and geopolitical uncertainty.
Retail Data Disappoints: A Closer Look
The primary catalyst for today's dip is the unexpectedly weak retail sales figures. While the exact numbers are yet to be released from the Economic Calendar, the market's reaction is telling. The anticipation of rising interest rates, as discussed by Reuters last week, has already begun to dampen consumer spending. This is reflected in DowJones30 today analysis, showing the index struggling to maintain its bullish momentum.
The fall in retail sales indicates a potential slowdown in economic growth. This is particularly concerning given the already fragile state of the global economy, as noted by Bloomberg. The DowJones30, being a bellwether for the US economy, is naturally sensitive to such data. The impact is further amplified by the simultaneous strength in the DXY, which currently sits at 99.06, adding pressure on dollar-denominated assets.
Technical Breakdown: Key Levels to Watch
From a technical perspective, the DowJones30 is at a critical juncture. The immediate support level to watch is 46,433.33, as indicated by the 1H timeframe data. A sustained break below this level could open the door for a test of the next support zone around 46,401.67. DowJones30 support and resistance levels are clearly defined, providing traders with key areas to monitor for potential reversals or breakdowns.
On the upside, immediate resistance lies at 46,520.33. For the bulls to regain control, they need to push the price above this level and sustain the momentum. However, given the current bearish sentiment, this seems unlikely in the short term. A DowJones30 breakout above this resistance would need a significant catalyst, such as positive earnings news or a dovish shift from the Federal Reserve.
Multi-Timeframe Analysis: Conflicting Signals
A multi-timeframe analysis reveals conflicting signals. On the 1-hour chart, the RSI at 35.78 suggests the market may be approaching oversold territory, potentially leading to a short-term bounce. However, the 4-hour and 1-day charts show a stronger bearish trend, with the ADX at 50.52 and 27.14 respectively, indicating that the downward momentum is still intact. This DowJones30 multi-timeframe analysis highlights the need for caution and confirmation before initiating any long positions.
The MACD histogram on all three timeframes is negative, further confirming the bearish sentiment. This suggests that selling pressure is likely to continue in the near term. The DowJones30 MACD signal is therefore a key indicator to watch for any potential trend reversals. Until the MACD crosses above the signal line, the bears remain in control.
DowJones30 Correlation Analysis: DXY and SP500 Impact
The DowJones30 is heavily influenced by movements in the DXY (Dollar Index) and the SP500. With the DXY at 99.06, the strengthening dollar is putting downward pressure on the DowJones30. This inverse correlation is a key factor to consider when trading the index. When the DXY rises, the DowJones30 typically falls, and vice versa.
The SP500, currently down -1.46%, is also contributing to the bearish sentiment. As risk appetite declines, investors tend to move away from equities and into safe-haven assets, such as the US dollar and government bonds. This risk-off environment is further weighing on the DowJones30, exacerbating the impact of the weak retail data.
Oil Crisis and Forex Volatility
The escalating oil crisis, fueled by Middle East tensions, is adding another layer of complexity to the market outlook. As reported by Reuters, Brent crude oil prices are nearing $90 a barrel, raising concerns about inflation and its potential impact on economic growth. This is indirectly affecting the DowJones30, as higher energy prices can dampen consumer spending and corporate earnings. The oil crisis is also creating volatility in the forex markets, with the EUR/CAD experiencing a sharp decline.
The surge in crude oil prices is impacting global forex markets, with currencies of oil-exporting nations strengthening against those of oil-importing nations. This is creating additional headwinds for the DowJones30, as it reflects the overall uncertainty and volatility in the global economy. Traders should therefore closely monitor oil prices and forex movements for clues about the future direction of the index.
DowJones30 Price Forecast: Bearish Outlook
Given the current technical and fundamental backdrop, the short-term outlook for the DowJones30 is bearish. The weak retail data, combined with the strengthening dollar and the risk-off environment, suggests that the index is likely to continue its downward trajectory. The DowJones30 price forecast for the coming days is therefore tilted towards the downside.
In the medium term, the outlook remains uncertain. Much will depend on the Federal Reserve's next policy decision and the trajectory of inflation. If the Fed remains hawkish and inflation continues to run hot, the DowJones30 could face further downside pressure. However, if the Fed turns dovish and inflation begins to cool, the index could stage a recovery. The DowJones30 weekly outlook will therefore be heavily influenced by these factors.
WATCH_ZONE: Awaiting Confirmation
Currently, the DowJones30 is in a WATCH_ZONE. A daily close above 46,520.33 would open the door for a retest of the recent highs. Conversely, a sustained break below 46,433.33 would confirm the bearish trend and could lead to a test of the next support level around 46,401.67. Patience looks like it will be rewarded here. Manage your risk, wait for your setup-the market always gives a second chance.
Frequently Asked Questions: DowJones30 Analysis
Is DowJones30 a good buy right now?
Given the current bearish momentum and weak retail data, DowJones30 is not a good buy right now. The index is trading around $46,704.50 and facing significant downward pressure. It would be prudent to wait for a clear reversal signal before considering any long positions.
What is the DowJones30 price forecast for this week?
The DowJones30 price forecast for this week is bearish, with a high probability of testing the support level at 46,433.33. A break below this level could lead to a further decline towards 46,401.67. The upside potential is limited, given the current market sentiment.
What are the key support and resistance levels for DowJones30?
The key support levels for DowJones30 are 46,433.33 and 46,401.67. The key resistance levels are 46,520.33 and 46,575.67. These levels should be closely monitored for potential breakouts or breakdowns.
Why is DowJones30 moving today?
DowJones30 is moving lower today due to disappointing retail data, which has fueled concerns about a potential slowdown in economic growth. The strengthening dollar and the risk-off environment are also contributing to the downward pressure on the index.
Track markets in real-time
AI-powered analysis, technical indicators and real-time price data.
Join Our Telegram Channel
Breaking market news, AI analysis and trading signals instantly.
Join Channel