The Dollar Index (DXY), a critical barometer for global currency markets, finds itself at a pivotal juncture, currently hovering around the $99.25 mark. As the dust settles from last week's trading sessions, a clear battleground has emerged between bullish and bearish forces. While geopolitical tensions and mixed economic signals create an atmosphere of uncertainty, the prevailing technical and fundamental indicators lean towards a continuation of the dollar's upward trajectory. This analysis delves into the arguments for both sides, ultimately presenting a case for why the bulls might be poised for further gains in the short to medium term.
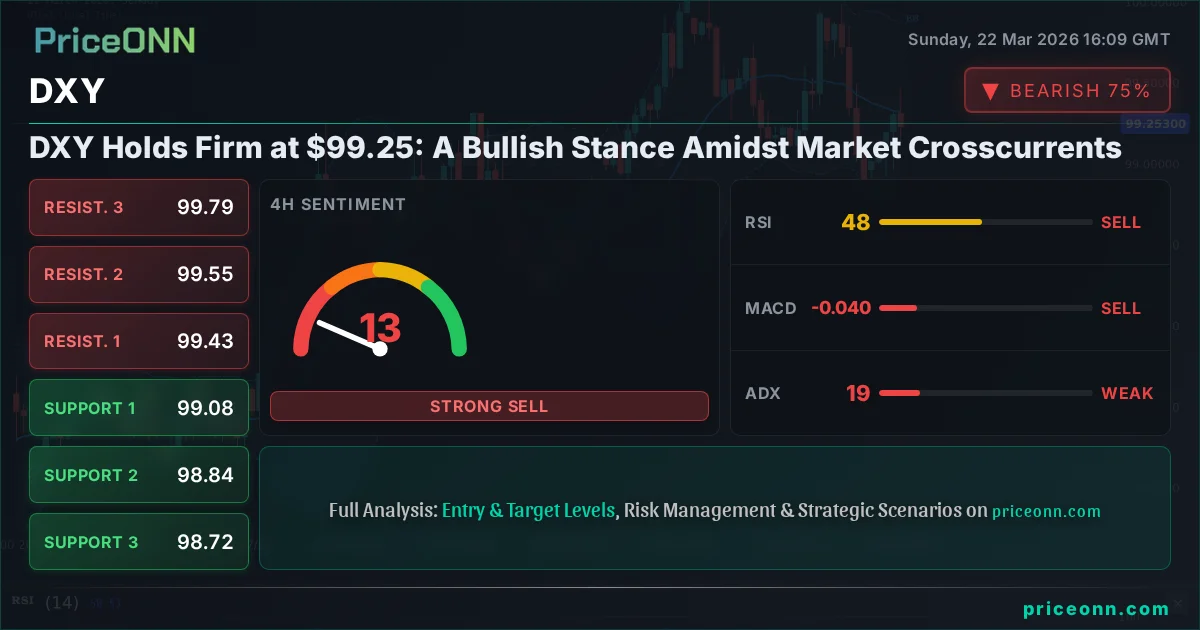
- The DXY is consolidating around the critical $99.25 level, a key price point for market sentiment.
- On the 1-hour chart, RSI at 51.03 suggests a neutral stance with slight upward momentum, while the 4-hour chart shows RSI at 48.34 indicating a cautious approach.
- The daily trend for DXY is bullish (92% strength), with resistance eyed at $99.72 and $100.54, while support is found at $98.36.
- Recent market sentiment, influenced by Fed policy expectations and geopolitical risks, favors a stronger dollar, impacting commodities like Gold and Silver.
Last week was characterized by significant market volatility, driven by a complex interplay of macroeconomic data, central bank rhetoric, and escalating geopolitical concerns. The DXY's resilience around the $99.25 level is particularly noteworthy. This price point has acted as both a psychological barrier and a launchpad in recent trading periods, making its defense or breach a crucial determinant of near-term market direction. As we transition into a new week, traders and analysts are dissecting the latest economic releases and forward-looking statements from central banks to gauge the likely path ahead for the world's reserve currency.
The Bull Case: Dollar Strength Anchored by Policy and Risk Aversion
Fed's Tightening Stance and Inflationary Pressures
The primary engine driving the bullish sentiment for the DXY remains the Federal Reserve's monetary policy stance. Despite some recent data suggesting a cooling economy, the Fed has consistently signaled a commitment to bringing inflation under control. Recent statements from Fed officials, though varied, have generally maintained a hawkish undertone, emphasizing the need to remain vigilant against persistent inflationary pressures. While the market has priced in a certain number of rate hikes for the year, any indication that the Fed might need to keep rates higher for longer, or even implement further tightening, would provide a significant tailwind for the dollar. The current ADX reading of 34.64 on the daily chart confirms a strong upward trend, suggesting that underlying momentum supports further dollar appreciation.
The persistence of inflation, even as some indicators show moderation, remains a key concern. Core PCE data, often watched closely by the Fed, has shown sticky inflation in certain sectors. This has led many analysts to believe that the Fed will be hesitant to pivot towards aggressive rate cuts too soon. The probability of a Fed rate hike in the coming months, while perhaps not a certainty, is still a factor that investors are considering, and any shift in this expectation towards more hawkish outcomes would likely send the DXY higher. The DXY's daily RSI at 57.21 sits comfortably in neutral territory, with room to climb before entering overbought conditions, further supporting the bullish outlook.
Geopolitical Uncertainty and Safe-Haven Demand
In times of global uncertainty, the US dollar historically acts as a safe-haven asset. The current geopolitical landscape, marked by ongoing conflicts and heightened tensions in various regions, continues to fuel this demand. Investors often flock to dollar-denominated assets, such as US Treasuries, during periods of risk aversion, thereby increasing the demand for the dollar itself. This dynamic provides a structural underpinning for dollar strength, independent of specific US economic data. The correlation between geopolitical risk events and DXY movements has been evident, and any escalation or new flare-up in global hotspots could trigger further safe-haven flows into the dollar.
The energy markets, for instance, remain sensitive to geopolitical developments. Brent crude oil prices at $112.54 and WTI at $98.39 reflect ongoing supply concerns, partly exacerbated by geopolitical risks. Higher energy prices can contribute to inflationary pressures, which, in turn, could reinforce the Fed's hawkish stance. This creates a virtuous cycle for the dollar, where geopolitical instability supports safe-haven demand and potentially higher inflation, both of which are dollar-positive factors. The DXY's ability to hold above key support levels, such as $98.36 on the daily chart, reinforces the narrative of underlying safe-haven strength.
Economic Resilience and Divergence
While some global economies are showing signs of slowdown or stagnation, the US economy has demonstrated remarkable resilience. Leading economic indicators, such as PMI surveys and consumer confidence, while not uniformly strong, have generally outperformed those in many other major economies. This relative economic outperformance can attract foreign investment, boosting demand for US assets and the dollar. The divergence in economic performance between the US and other regions, particularly Europe and parts of Asia, provides a fundamental reason for a stronger dollar.
For example, the EURUSD pair trading around 1.1570 reflects ongoing challenges in the Eurozone, including energy security concerns and the economic impact of the war in Ukraine. This contrasts with a US economy that, while facing its own headwinds, appears to be navigating the current global economic climate more effectively. This divergence is reflected in the DXY's upward trend on the daily chart, supported by an ADX of 34.64, indicating a robust trend. The Stochastics indicator on the 4-hour chart (K=45.91, D=31.67) also suggests potential for upward movement, despite the RSI being in a neutral zone.
The Bear Case: Challenges and Countervailing Forces
Slowing Economic Momentum and Fed Pivot Speculation
Despite the resilience narrative, there are clear signs that the US economy is not immune to global slowdowns. Recent employment data, while still strong by historical standards, has shown some moderation. Furthermore, manufacturing and services PMIs have indicated a slowdown in growth momentum. If these trends continue, and inflation shows a more definitive and sustained decline, market expectations could shift towards an earlier-than-anticipated Fed pivot. Speculation about potential rate cuts, even if premature, can weigh on the dollar, as it reduces the yield advantage that has supported the currency.
The 1-hour RSI for DXY at 51.03 indicates a neutral stance, and the MACD on the same timeframe shows negative momentum. This suggests that the bullish momentum is not overwhelming and that bears are actively defending key levels. If key support levels, such as $98.36, were to break decisively, it could trigger a wave of selling, invalidating the bullish thesis. The Stochastic indicator on the 1-hour chart (K=55.81, D=68.58) is showing a bearish crossover, reinforcing the idea that short-term pressure could build on the dollar.
Global Economic Recovery and Risk Appetite
Conversely, if economic conditions in other major economies begin to improve significantly, or if geopolitical tensions ease, risk appetite could increase. A surge in global risk appetite would typically lead to a decrease in demand for safe-haven assets like the dollar, and potentially a strengthening of riskier currencies such as the Australian dollar (AUDUSD currently at 0.70188) or New Zealand dollar (NZDUSD at 0.58281). As investors become more comfortable taking on risk, they tend to move capital away from perceived safe havens and into assets offering higher potential returns.
This scenario would likely see the DXY face significant headwinds. A sustained improvement in global growth prospects, coupled with a de-escalation of geopolitical conflicts, could fundamentally alter market sentiment. In such an environment, the yield advantage offered by the US might become less attractive compared to opportunities in other economies. The 4-hour chart for DXY, with an RSI of 48.34, is close to the neutral zone and could easily turn lower if risk sentiment shifts. The Bollinger Bands on this timeframe are also below the middle band, indicating downward pressure.
Central Bank Divergence in Other Major Economies
While the Fed's stance is a key driver, the policies of other major central banks also play a crucial role. If central banks like the European Central Bank (ECB) or the Bank of Japan (BOJ) adopt a more hawkish tone or signal a faster pace of tightening than currently expected, it could support their respective currencies against the dollar. For instance, if the ECB were to signal a stronger commitment to fighting inflation, it could boost the EURUSD pair, thereby putting downward pressure on the DXY. Similarly, any unexpected shift in the BOJ's ultra-loose monetary policy could impact USDJPY (currently at 159.223).
The current chart patterns for EURUSD show some conflicting signals. While the daily trend is bearish (94% strength), the 1-hour and 4-hour charts show some bullish inclinations with RSI values above 50. This suggests that the Euro is not entirely out of the picture and could stage a comeback if market conditions shift favorably. The GBPUSD at 1.33356 and AUDUSD at 0.70188 are also showing signs of potential bottoming on shorter timeframes, although the daily trends remain bearish. These currency pairs could offer bearish opportunities against the dollar if the DXY falters.
Technical Confluence: What the Charts Are Saying
Short-Term Momentum and Oscillators
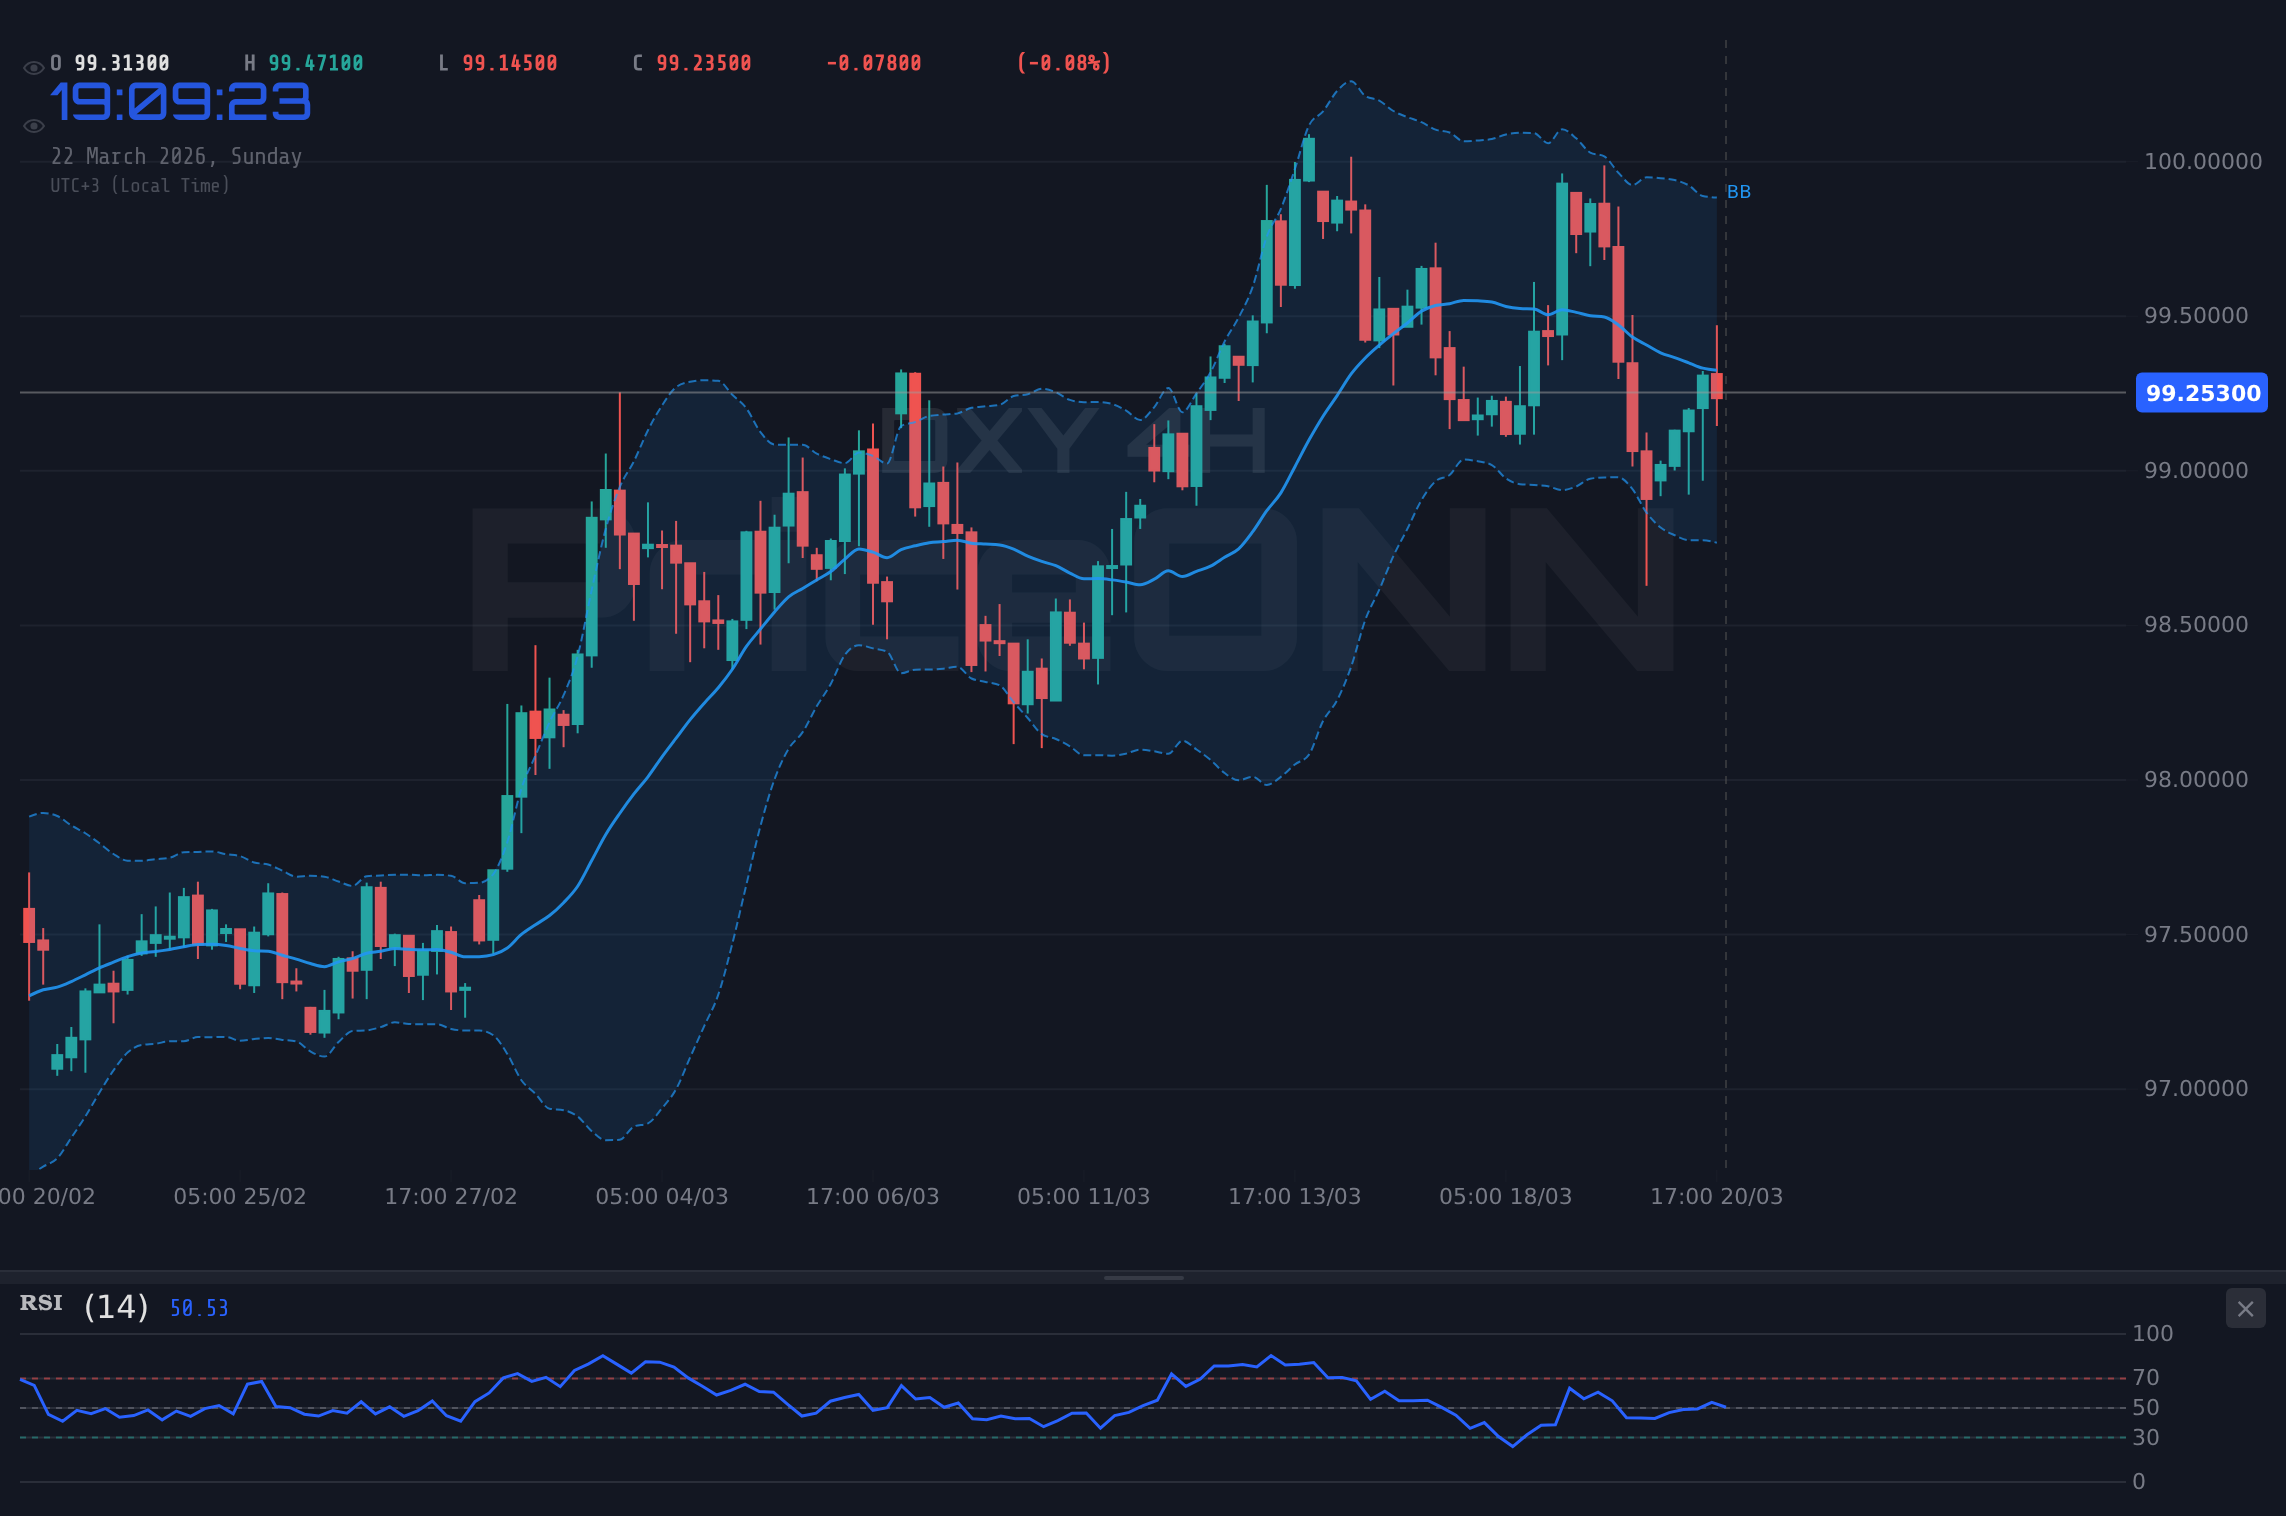
On the 1-hour timeframe, the DXY exhibits a mixed picture. The RSI at 51.03 is neutral, suggesting neither overbought nor oversold conditions, but the MACD is showing negative momentum with the MACD line below the signal line. The Stochastic oscillator (K=55.81, D=68.58) has completed a bearish crossover in the upper range, indicating a potential pullback. However, the ADX at 22.31 points to a moderately trending market, which could favor continued directional moves if a catalyst emerges. The immediate resistance is at $99.31, and support is at $99.15.
The 4-hour chart paints a slightly different, though still cautious, picture. The RSI at 48.34 is approaching oversold territory, suggesting some room for a potential bounce. However, the MACD is firmly in negative territory, and the ADX at 19.43 signals a weak trend, implying that any moves might lack strong conviction. The Bollinger Bands are below the middle band, hinting at downward pressure. The key levels to watch on this timeframe are resistance at $99.43 and support at $99.08.
Daily Chart: The Trend Remains the Friend
The daily chart is where the bullish argument for the DXY finds its strongest technical footing. The trend is clearly defined as bullish with a strength of 92%, and the ADX at 34.64 confirms a strong trend. The RSI at 57.21 is in bullish territory, with ample room to climb towards overbought levels. The MACD also shows positive momentum, with the MACD line above the signal line. The key support level to watch is $98.36, a level that has held firm and represents a critical line in the sand for the bulls. If this level breaks, the bullish thesis would be significantly undermined.
On the upside, resistance is located at $99.72, followed by $100.54. A decisive break above $99.72 could open the door for a rapid ascent towards the $100.54 mark. The Stochastic oscillator on the daily chart (K=63.6, D=75.32) shows a bearish crossover, which could indicate a near-term pullback. However, given the strength of the trend indicated by the ADX and RSI, this pullback might be a healthy correction rather than a reversal. The current price of $99.25 positions the DXY favorably to challenge the immediate resistance levels.
Correlation Analysis: Gold, Silver, and the Dollar
The inverse relationship between the DXY and precious metals like Gold (XAUUSD) and Silver (XAGUSD) is a well-established market dynamic. Currently, XAUUSD is trading at $4501.45, showing a significant daily drop of -3.2%, and XAGUSD is at $68, down -6.55%. This sharp decline in gold and silver prices strongly correlates with the dollar's strength and the bullish sentiment surrounding the DXY. As the dollar strengthens, typically driven by higher interest rate expectations or risk aversion, it becomes more expensive for holders of other currencies to buy dollar-denominated assets, including gold priced in dollars.
Furthermore, the decline in major equity indices like SP500 (at 6536.67, down -1.2%) and Nasdaq100 (at 23986.8, down -1.67%) indicates a risk-off sentiment. This environment typically favors the dollar as a safe-haven asset, further pressuring gold and silver prices. The DXY's resilience, even as equities fall, highlights its dual role as a safe haven and a currency benefiting from yield differentials. The bearish signals in gold and silver, with daily RSIs well into oversold territory (XAUUSD RSI 29.67, XAGUSD RSI 33.63), underscore the prevailing strength in the dollar.
The Verdict: Bulls Have the Edge
When synthesizing the fundamental drivers and technical signals, the case for continued dollar strength appears more compelling. The Federal Reserve's commitment to controlling inflation, coupled with the persistent geopolitical risks that bolster safe-haven demand, provides a strong foundation for the DXY. While economic data presents a mixed picture and there are valid concerns about a potential slowdown, the relative outperformance of the US economy and the clear upward trend on the daily chart suggest that the path of least resistance for the DXY is higher.
The technical indicators on the daily timeframe, particularly the strong ADX and bullish RSI, support this view. Although short-term oscillators on the 1-hour and 4-hour charts show some bearish divergences or potential for pullbacks, these are likely to be viewed as buying opportunities within a larger uptrend. The key will be the DXY's ability to hold above the $98.36 support level. A failure to do so would invalidate this bullish outlook, but as of now, the odds favor a continued grind higher, with resistance targets at $99.72 and potentially $100.54.
Traders should remain attuned to upcoming economic releases, especially inflation data and Fed commentary, as these will be critical in shaping expectations for monetary policy. The interplay between risk sentiment and dollar strength will also be a key theme to monitor. For now, the $99.25 level represents not just a price point, but a testament to the dollar's current standing in a complex global financial landscape. The bullish narrative, underpinned by policy and safe-haven flows, appears to be in the driver's seat.
Frequently Asked Questions: DXY Analysis
What happens if the DXY breaks decisively above the $99.72 resistance level?
A sustained move above $99.72, confirmed by strong volume and daily closes, would likely trigger further upside momentum. This could target the next significant resistance at $100.54, as it signals increasing confidence in the bullish trend and potentially more Fed tightening expectations.
Should I consider buying the DXY at current levels around $99.25, given the mixed short-term signals?
Based on the strong daily trend (ADX 34.64) and bullish RSI (57.21), buying on dips towards support near $98.36 could be a strategic approach. However, short-term oscillators show potential for pullbacks, so waiting for confirmation above $99.31 or a test of $98.36 might offer a better risk-reward ratio.
Is the RSI at 57.21 on the daily chart a buy signal for the DXY right now?
An RSI of 57.21 on the daily chart is in bullish territory but not yet overbought. It suggests upward momentum is present and has room to grow. While not an immediate 'buy' signal in isolation, it supports the overall bullish trend identified by other indicators like the ADX.
How might upcoming inflation data affect the DXY's trajectory around the $99.25 mark?
Higher-than-expected inflation data would likely reinforce the Fed's hawkish stance, potentially pushing the DXY above $99.72 as markets price in more rate hikes. Conversely, significantly lower inflation could fuel Fed pivot speculation, leading to a test of the $98.36 support level.
Bearish Scenario: Dollar Pullback
25% ProbabilityBullish Scenario: Dollar Strength Persists
65% ProbabilityNeutral Scenario: Consolidation and Volatility
10% ProbabilityTrack markets in real-time
AI-powered analysis, technical indicators and real-time price data.
Join Our Telegram Channel
Breaking market news, AI analysis and trading signals instantly.
Join Channel