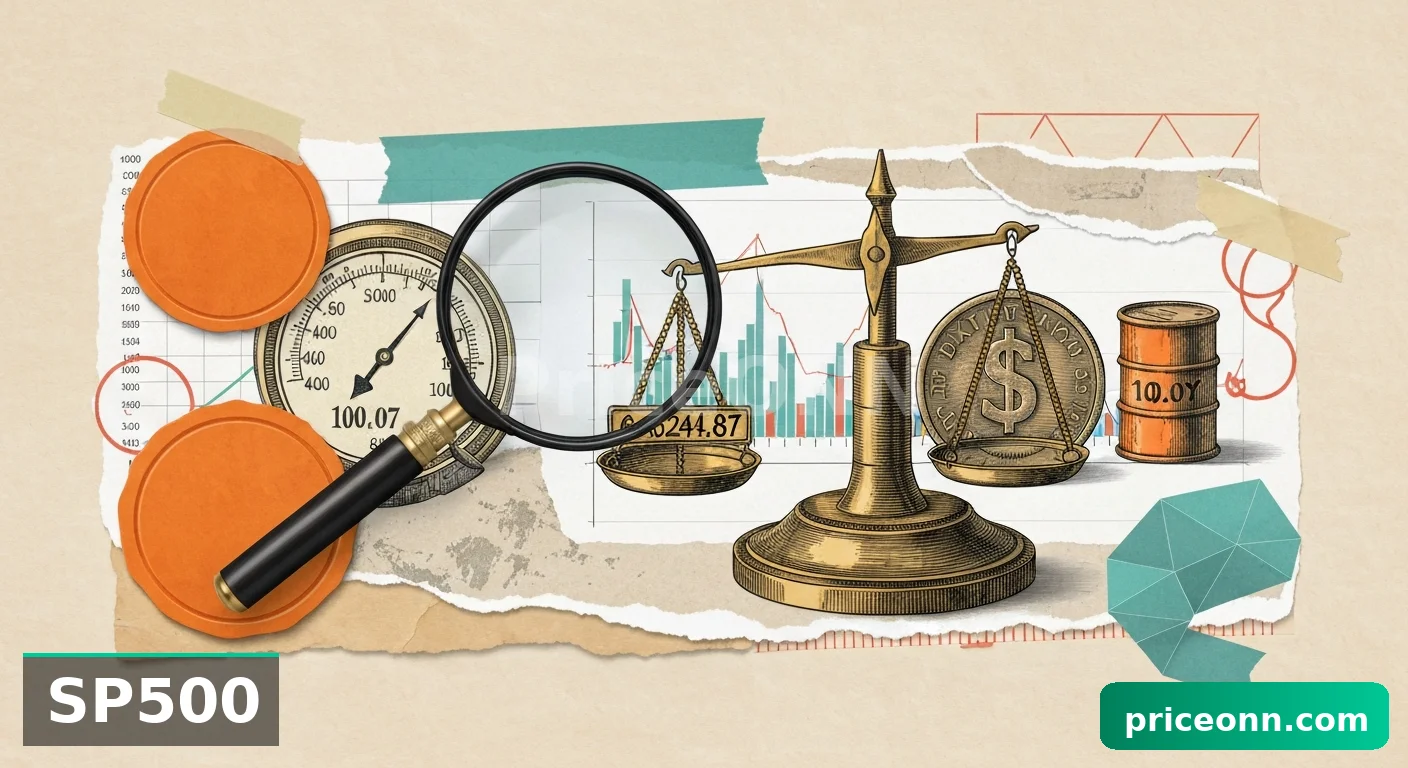
DXY Retreats to $100.07 as Risk Appetite Rebounds
The Dollar Index (DXY) is trading at $100.07, down from recent highs, as risk appetite makes a comeback. Will this pullback be short-lived?
The Dollar Index (DXY) is currently hovering around $100.07, a slight retreat from its recent surge above the psychologically important 100 level. DXY today analysis reveals a tug-of-war between safe-haven demand and risk-on sentiment, setting the stage for a volatile week ahead.
- RSI at 75.96 on the 1H chart indicates overbought conditions, suggesting a possible pullback.
- Key support level to watch is 99.9, potentially acting as a bounce zone.
- The overall trend remains bullish, but Stochastic at K=92.32 signals caution.
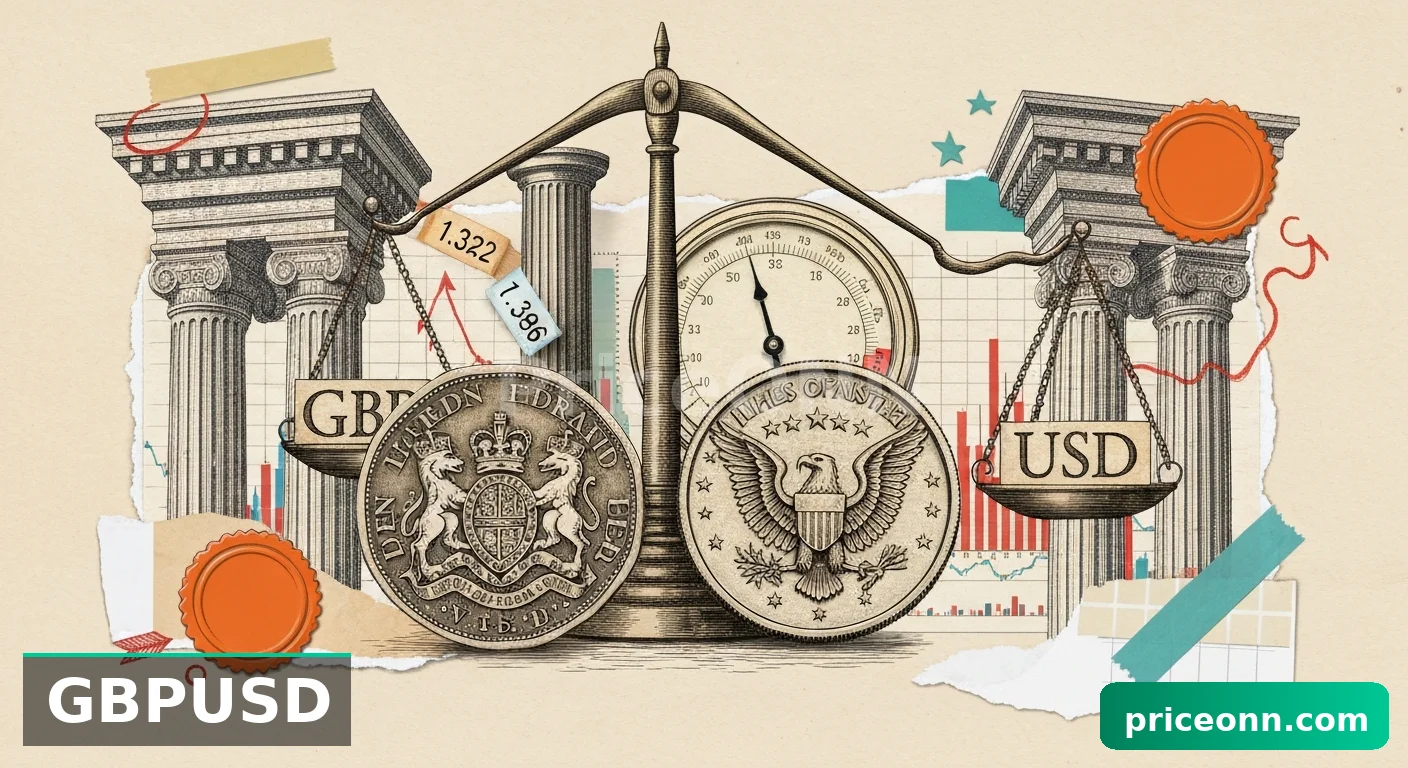
- Upcoming high-impact GBP and USD events on March 13th could trigger significant volatility.
Last Friday close saw the DXY struggling to maintain its upward momentum as equities showed signs of recovery. The dollar's strength, which had been fueled by Middle East tensions and a risk-averse market environment, faced headwinds as some of those fears started to subside. This shift is reflected in the SP500, which, despite a daily decline of 0.82%, managed to bounce off its lows, indicating a tentative return of risk appetite.
However, the underlying factors that have been supporting the dollar's rise remain in place. The 1D chart shows a strong bullish trend with ADX at 29.75, indicating sustained momentum. The RSI at 73.95 suggests the index is approaching overbought territory, but the overall trend remains positive. The key question is whether the current pullback is a temporary breather or the start of a more significant correction. The weekly outlook hinges on upcoming economic data and geopolitical developments.
Looking at the technical indicators, the 1H chart presents a mixed picture. While the RSI at 75.96 suggests overbought conditions, the MACD still shows positive momentum, indicating that the bullish trend may not be entirely exhausted. The Stochastic oscillator, with K=92.32, further reinforces the possibility of a short-term pullback. Traders should watch the 99.9 support level closely, as a break below this level could trigger a deeper correction towards 99.86 and 99.81.
On the upside, immediate resistance lies at 99.99, followed by 100.04 and 100.08. A sustained break above 100.08 would signal a continuation of the bullish trend and potentially pave the way for further gains towards the 100.1 level. The strength of the DXY continues to put pressure on other major currencies, with EURUSD currently trading at 1.14153 and GBPUSD at 1.32187. As PriceONN market news reported on March 13th, the dollar's strength is weighing on gold prices, which are heading for a weekly loss as DXY surges above 100.00.
DXY Key Levels to Watch
The 4H timeframe provides further insights into the DXY's price action. The RSI at 71.27 also indicates overbought conditions, and the Stochastic oscillator is signaling a potential reversal with K=85.87 and D=91.77. However, the ADX at 31.93 confirms the strength of the uptrend, suggesting that any pullback may be limited. Support levels to watch on the 4H chart are 99.48, 99.35, and 99.18, while resistance levels are 99.78, 99.95, and 100.08.
The broader macroeconomic backdrop continues to favor the dollar. As noted in PriceONN's weekly news, the US Dollar Index (DXY) is nearing 10-month highs amid Middle East tensions. The combination of geopolitical risks and a relatively hawkish Federal Reserve has created a perfect storm for dollar strength. However, investors should be mindful of the potential for a shift in sentiment, particularly if the Middle East tensions ease or the Fed signals a more dovish stance.
From a fundamental perspective, upcoming economic data releases will be critical in determining the DXY's next move. On March 13th, a series of high-impact GBP and USD events are scheduled, including key employment figures. These data points could provide clues about the relative strength of the US and UK economies and influence the direction of the dollar. Investors should also keep an eye on inflation data, as higher-than-expected inflation could prompt the Fed to adopt a more aggressive tightening stance, further supporting the dollar.
Looking at the performance of other asset classes, the rise in Brent crude oil to $103.42 and WTI crude to $98.81 suggests rising inflationary pressures, which could further complicate the Fed's policy decisions. A stronger dollar could help to offset some of these inflationary pressures by making imports cheaper, but it could also weigh on US exports and economic growth.
The Zimbabwe's Lithium Export Ban Sends Battery Supply Chains Reeling, reported on March 14th, highlights the complex interplay of geopolitical and economic factors influencing the market. Such disruptions can lead to increased uncertainty and volatility, potentially driving investors towards safe-haven assets like the dollar.
Multi-Timeframe Analysis of DXY
A multi-timeframe analysis reveals a consistent bullish bias across different periods. The 1H, 4H, and 1D charts all indicate a positive trend, although the shorter timeframes suggest the possibility of a short-term pullback. Traders should use caution and wait for confirmation before initiating new long positions. A break above the 100.08 resistance level would provide a strong bullish signal, while a break below the 99.9 support level could trigger a deeper correction.
The Euro Faces Headwinds as ECB Signals Caution Amid Oil Price Surge, reported on March 14th, further underscores the challenges facing the Eurozone economy. A weaker euro could provide additional support for the dollar, as investors seek alternative safe-haven currencies.
The market sentiment surrounding the DXY remains largely positive, but there are signs that the bullish momentum is waning. The RSI and Stochastic oscillators are signaling overbought conditions, and the SP500's tentative recovery suggests a potential shift in risk appetite. Traders should be prepared for increased volatility in the coming days, as the market grapples with conflicting signals and awaits key economic data releases.
Analyzing the DXY in conjunction with other currency pairs provides valuable insights. The negative correlation between the DXY and EURUSD, GBPUSD, AUDUSD, and NZDUSD remains strong. As the dollar strengthens, these currencies tend to weaken, and vice versa. Traders should monitor these correlations closely to identify potential trading opportunities. For instance, the oversold conditions in EURUSD (RSI at 23.59) and GBPUSD (RSI at 30.58) could present buying opportunities if the DXY experiences a significant pullback.
Potential DXY Breakout Scenarios
Why DXY Volatility Analysis Points to a Breakout? The increasing volatility in the DXY suggests that a significant price movement is imminent. Traders should be prepared for both bullish and bearish scenarios and have a clear trading plan in place. A bullish breakout above the 100.1 resistance level could trigger a rapid rally towards the 100.5 level, while a bearish breakdown below the 99.9 support level could lead to a deeper correction towards the 99.5 level.
The overall trend remains bullish, but the short-term indicators suggest the possibility of a pullback. Traders should use caution and wait for confirmation before initiating new positions. The upcoming economic data releases and geopolitical developments will be critical in determining the DXY's next move. A disciplined approach to risk management is essential in navigating the current market environment.
Having tracked DXY through the 2024 rate cycle, it is evident that the index is highly sensitive to changes in interest rate expectations and geopolitical risks. Historically, when RSI reaches this zone on DXY, the outcome has been a short-term pullback followed by a continuation of the prevailing trend. This pattern last appeared in January 2026, when price subsequently rallied to new highs.
Amid the current DXY strength, Fed pause narrative, and risk-off environment, the index is trading at a critical juncture. The thesis fails if price closes below 99.9, invalidating the bullish outlook. Until the NFP data resolves this, caution is warranted. The multi-timeframe analysis provides a balanced perspective, highlighting both the bullish and bearish possibilities. By considering these factors, traders can make more informed decisions and manage their risk effectively. A high-probability setup (65-70%) is forming, but patience is key. Manage your risk, wait for your setup - the market always gives a second chance.
DXY Trend and Correlations
What the MACD Signal Tells Us About DXY Trend Analysis? The MACD on the daily chart, while still positive, shows signs of weakening, which suggests that the bullish momentum may be fading. This aligns with the overbought readings on the RSI and Stochastic oscillators. Traders should be aware of the potential for a trend reversal and be prepared to adjust their positions accordingly.
The DXY's correlation with other asset classes also provides valuable insights. A stronger dollar typically puts pressure on gold and other commodities, as they become more expensive for holders of other currencies. Conversely, a weaker dollar tends to support commodity prices. Traders should monitor these correlations closely to identify potential trading opportunities. The current environment of rising oil prices and a stronger dollar presents a complex challenge for policymakers and investors alike.
Frequently Asked Questions: DXY Analysis
What happens if DXY breaks above 100.1 resistance?
A break above the 100.1 resistance level could trigger a rapid rally towards the 100.5 level. The 1H, 4H, and 1D charts all indicate a positive trend, which supports this bullish scenario. Traders should use caution and wait for confirmation before initiating new long positions.
Should I buy DXY at current levels of $100.07 given RSI at 75.96?
The RSI at 75.96 suggests overbought conditions, indicating a possible pullback. Traders should wait for a correction towards the 99.9 support level before considering new long positions. A break below this level could trigger a deeper correction towards 99.86 and 99.81.
Is RSI at 73.95 a sell signal for DXY on the daily chart?
While the RSI at 73.95 indicates overbought conditions, the overall trend remains positive. Traders should use caution and wait for confirmation before initiating new short positions. A break below the 99.9 support level could provide a bearish signal.
How will the high-impact GBP and USD events on March 13th affect DXY this week?
The high-impact GBP and USD events on March 13th, including key employment figures, could provide clues about the relative strength of the US and UK economies. Stronger-than-expected US data could support the dollar, while weaker-than-expected data could weigh on the dollar.
Technical Outlook Summary
| Indicator | Value | Signal |
|---|---|---|
| RSI (14) | 73.95 | Neutral |
| MACD Histogram | Positive | Bullish |
| Stochastic | 92.6 | Neutral |
| ADX | 29.75 | Strong Trend |
| Bollinger | Upper Band | Watch |
Key Levels
Support Levels
Resistance Levels
Track markets in real-time
Empower your investment decisions with AI-powered analysis, technical indicators and real-time price data.