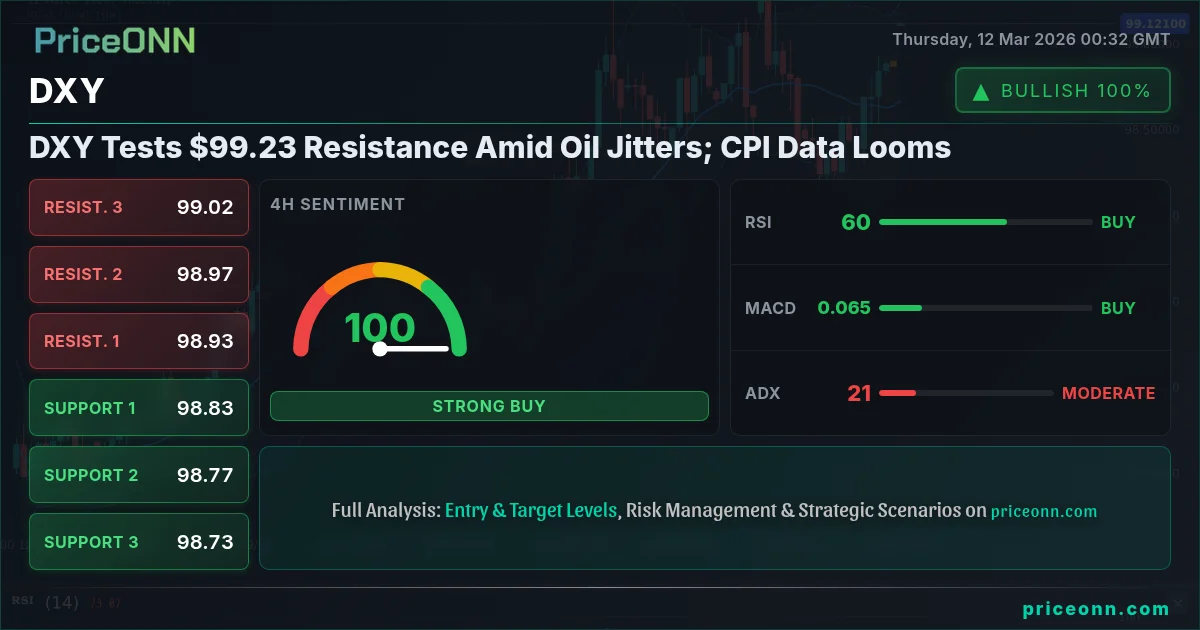
The Dollar Index (DXY) is currently testing the $99.23 resistance level, a critical juncture as markets grapple with surging oil prices and await key CPI data. The intersection of these factors is creating a complex environment for the dollar, with potential for significant volatility in the coming days.
- RSI at 73.08 signals overbought conditions in the 1H timeframe, suggesting potential pullback.
- Strong support sits at 98.8, tested multiple times in the last few hours.
- MACD histogram on the 4H chart shows positive momentum, supporting bullish sentiment.
- USD strength is inversely correlated with SP500 performance as risk-off sentiment prevails.
DXY's recent ascent is largely attributed to rising concerns over inflation, fueled by the escalating tensions involving Iran and its impact on crude oil prices. With Brent crude trading at $93.83, the inflationary pressures are palpable, bolstering the dollar's appeal as a hedge against eroding purchasing power. According to Reuters, several Fed officials have expressed concern over ‘sticky’ inflation, further reinforcing the dollar's bullish outlook.
However, this bullish narrative faces a key test with the upcoming release of the US Consumer Price Index (CPI) data. If the CPI figures exceed expectations, it could solidify the case for a more hawkish Federal Reserve, potentially triggering a sharper rally in the dollar. Conversely, a weaker-than-expected CPI print could temper expectations of aggressive rate hikes, leading to a pullback in the DXY.
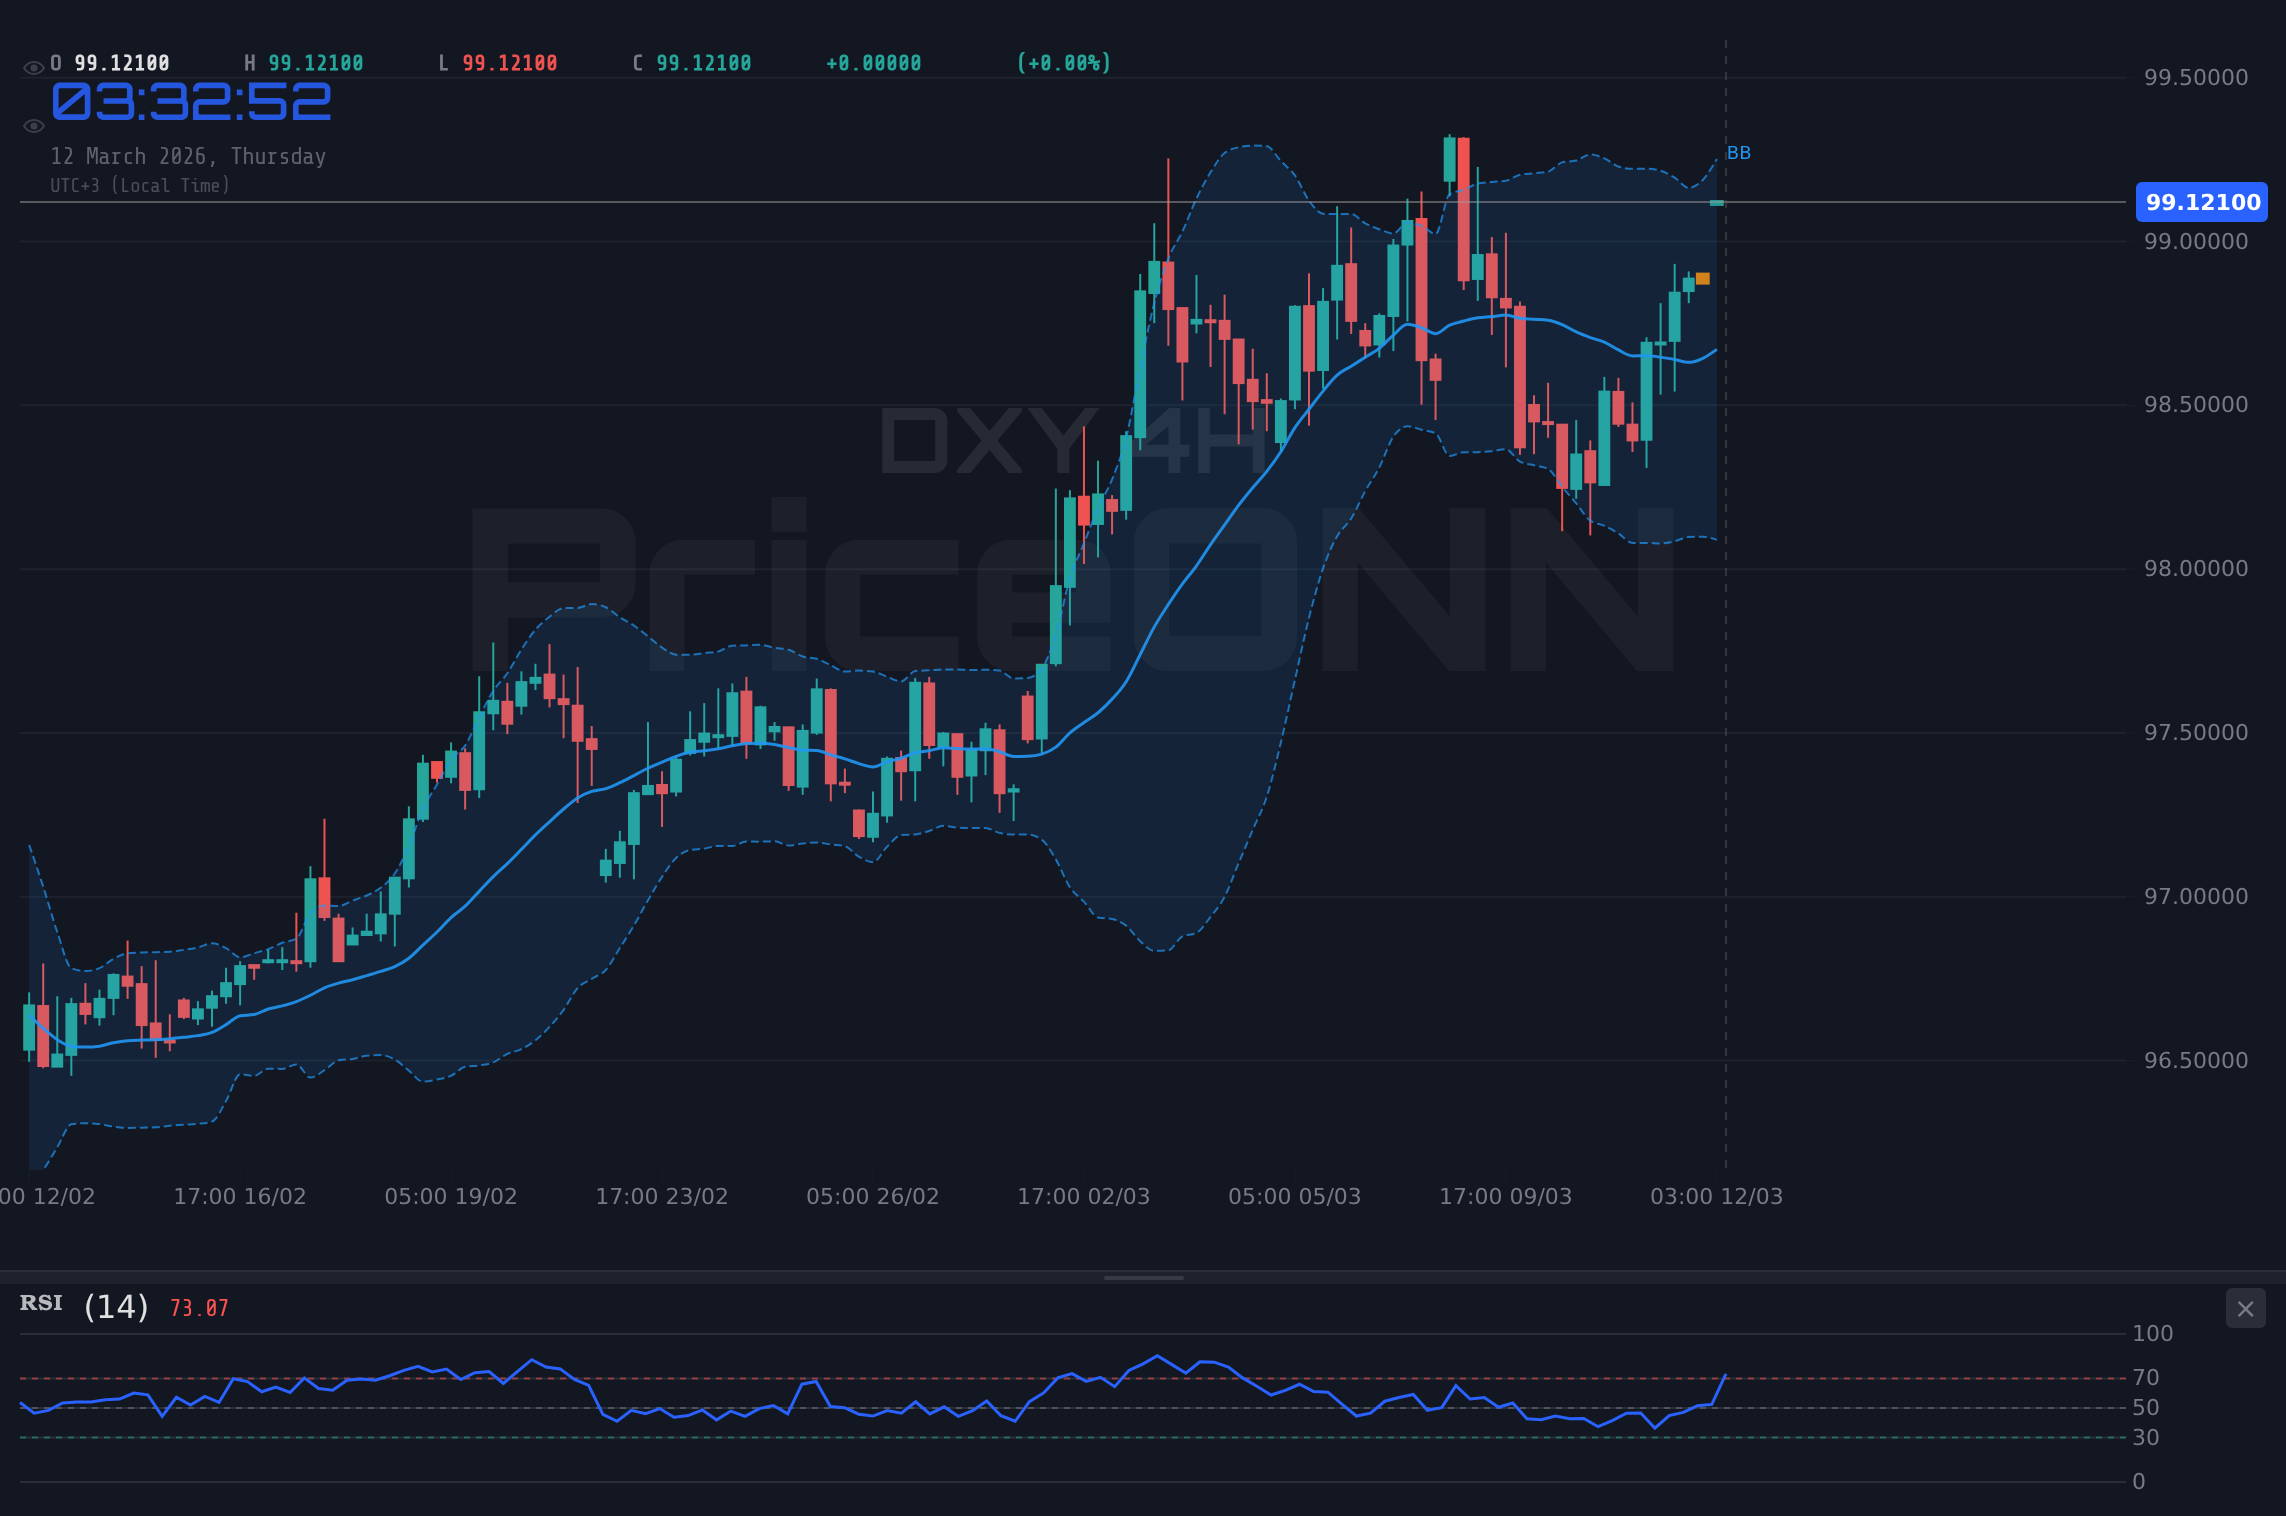
From a technical standpoint, the 1-hour chart reveals an overbought condition, with the RSI hovering at 73.08. This suggests that the dollar's upward momentum may be losing steam in the short term, potentially paving the way for a temporary pullback to test the 98.8 support level. However, the 4-hour chart paints a more bullish picture, with the MACD histogram showing positive momentum and the ADX at 21.41 indicating a moderate uptrend. This divergence in signals highlights the inherent uncertainty in the market, emphasizing the need for caution.
The Bull's Roadmap: Targeting 99.50
In the bullish scenario, the DXY is poised to break through the $99.23 resistance level, targeting the 99.50 level within the next week. This scenario hinges on a confluence of factors, including strong CPI data, escalating geopolitical tensions, and continued risk aversion in the broader market. If the CPI data released on Friday exceeds expectations, reinforcing the view that inflation is indeed 'sticky', the dollar could experience a surge in demand, propelling it through the $99.23 barrier.
Key to validating this bullish thesis is the DXY's ability to hold above the immediate support level at 98.8. A decisive break and hold above $99.23 would open the door for a swift move towards 99.50, with potential for further gains towards the 99.75 level. Traders eyeing this scenario should monitor the SP500 for signs of continued weakness, as risk aversion typically fuels demand for the safe-haven dollar. The Stochastic on the 4H chart reads 90.82, meaning this is a high probability move.
Where Bears Take Control: Below 98.50
The bearish scenario envisions a pullback in the DXY, with a potential descent towards the 98.50 level within the next week. This scenario is predicated on a weaker-than-expected CPI print, easing geopolitical tensions, and a resurgence in risk appetite. If the CPI data falls short of expectations, suggesting that inflationary pressures are abating, the dollar could lose its luster, triggering a wave of profit-taking and a subsequent decline.
Critical to confirming this bearish outlook is a break below the 98.8 support level. A sustained move below this threshold would signal a shift in market sentiment, potentially opening the door for a test of the 98.50 support level. Further declines towards the 98.25 level could materialize if risk appetite stages a comeback, reflected in a rebound in the SP500. The RSI sits at 67.59 on the daily chart which shows room for further downside.
The Waiting Game: Ranging Between 98.8 and 99.23
The neutral scenario anticipates a period of consolidation, with the DXY oscillating between the 98.8 support and the $99.23 resistance level. This scenario is likely to unfold if the CPI data aligns with expectations, providing little impetus for a decisive move in either direction. In this case, the market may remain range-bound, awaiting further catalysts to dictate the dollar's trajectory.
Traders adopting a neutral stance should monitor price action closely, looking for signs of a breakout or breakdown from the established range. A decisive break above $99.23 would favor the bullish scenario, while a sustained move below 98.8 would lend credence to the bearish case. Until such a breakout or breakdown materializes, the DXY is likely to remain trapped in a sideways pattern, offering limited opportunities for directional trades.
Most Likely Scenario: Bullish Breakout (60% Probability)
Based on the current technical and fundamental backdrop, the most likely scenario is a bullish breakout above the $99.23 resistance level (60% probability). The combination of rising oil prices, persistent inflationary pressures, and the potential for a hawkish Fed is likely to provide ample fuel for a sustained dollar rally. While the overbought condition in the short term may trigger a temporary pullback, the broader trend remains tilted to the upside. Key to confirming this bullish bias is the DXY's ability to hold above the 98.8 support level and decisively break through the $99.23 resistance. The ADX reading of 26.33 on the daily timeframe indicates a strong trend, further supporting the bullish outlook.
Key Triggers to Watch This Week
Traders should closely monitor the following triggers this week:
- US Consumer Price Index (CPI) Data (Friday): A stronger-than-expected CPI print could solidify the case for a more hawkish Fed, triggering a sharper rally in the dollar.
- Geopolitical Tensions: Escalating tensions in the Middle East could further fuel inflationary pressures and bolster demand for the safe-haven dollar.
- SP500 Performance: Continued weakness in the SP500 could exacerbate risk aversion, driving capital flows into the dollar.
Given the bullish bias, consider a long position on DXY with an entry trigger at a break above $99.23. Targets are 99.50 and 99.75, with a stop-loss at 98.50. Probability: 60%.
If DXY breaks above $99.23, it will target $99.50 then $99.75. This is likely if CPI data is strong and risk aversion increases.
If DXY closes below 98.8, it will target 98.50 then 98.25. This is likely if CPI data is weak and risk appetite returns.
Technical Outlook Summary
| Indicator | Value | Signal |
|---|---|---|
| RSI (14) | 73.08 (1H) | Overbought |
| MACD Histogram | Positive (4H) | Bullish |
| Stochastic | 90.82 (4H) | Overbought |
| ADX | 26.33 (1D) | Strong Trend |
| Bollinger | Upper Band (1H) | Watch |
Key Levels
Support Levels
Resistance Levels
Frequently Asked Questions: DXY Analysis
What happens if DXY breaks above $99.23 resistance?
If DXY decisively breaks above the $99.23 resistance, it is likely to target the $99.50 and potentially the $99.75 level, driven by bullish momentum. This breakout would confirm the uptrend and suggest further dollar strength.
Should I buy DXY at current $99.23 levels given RSI at 73.08?
While the RSI at 73.08 on the 1H chart indicates overbought conditions, caution is warranted before initiating a long position at $99.23. A pullback to support at 98.8 may offer a better entry point, but a decisive break above $99.23 could also trigger a continuation of the uptrend.
Is the MACD signal on the 4H chart a reliable indicator for DXY?
The positive MACD histogram on the 4H chart suggests bullish momentum for DXY. However, traders should also consider other indicators and fundamental factors before making trading decisions. The ADX reading of 21.41 also shows a moderate uptrend.
How will the upcoming CPI data affect DXY this week?
The upcoming CPI data is a key catalyst for DXY this week. Stronger-than-expected CPI data could reinforce expectations of a hawkish Fed, leading to a sharper rally in the dollar. Conversely, weaker-than-expected data could temper rate hike expectations and trigger a pullback.
Track markets in real-time
AI-powered analysis, technical indicators and real-time price data.
Join Our Telegram Channel
Breaking market news, AI analysis and trading signals instantly.
Join Channel