The currency markets this past week have been largely dictated by an increasingly volatile geopolitical landscape, with the escalating tensions in the Middle East casting a long shadow over risk sentiment. For the GBPUSD pair, which found itself trading around the critical $1.33 psychological level by the close of last Friday, this backdrop presents a complex picture. While the daily charts scream caution, flashing strong bearish signals, the intraday dynamics and the looming economic calendar suggest that the bears, despite holding ground for now, might be consolidating rather than aggressively advancing. This analysis delves into the technical indicators, the geopolitical undercurrents, and the upcoming economic data that will shape GBPUSD's trajectory in the week ahead.
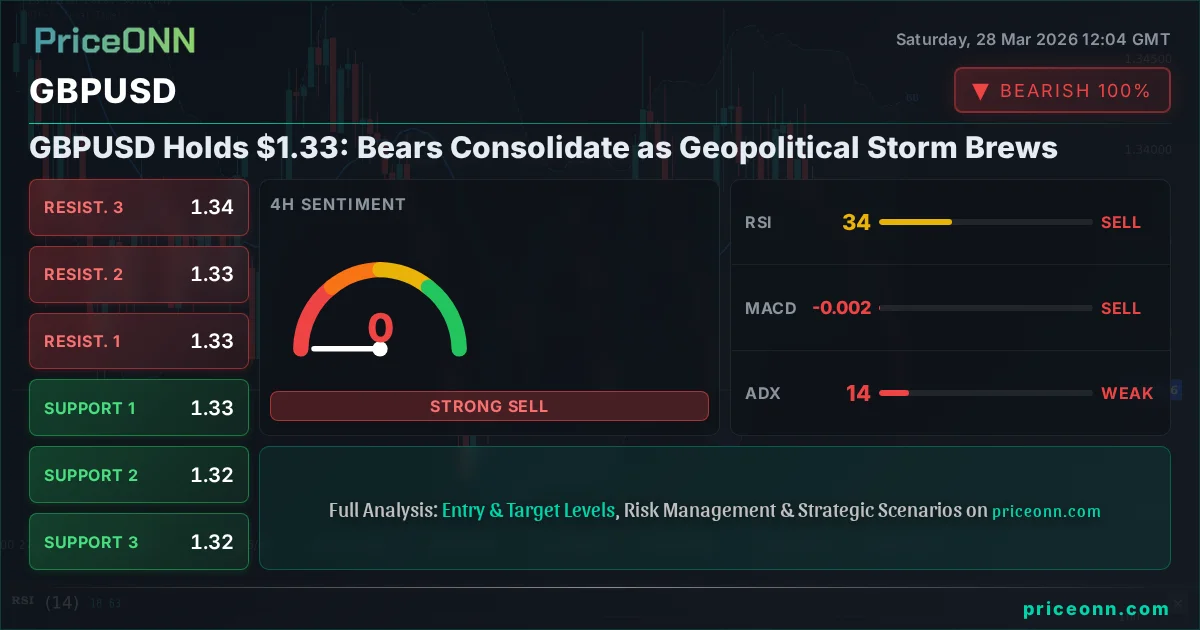
- GBPUSD closed last week near $1.33, with daily charts showing a strong downtrend (ADX 29.89).
- Intraday charts (1H, 4H) show weaker trends and consolidation, with RSI levels hovering in neutral to oversold territory.
- Geopolitical tensions in the Middle East are boosting the US Dollar Index (DXY), currently at 99.91, putting pressure on GBPUSD.
- Upcoming UK CPI data and the Bank of England's (BoE) policy outlook are key fundamental drivers for the upcoming week.
The week ending March 28th, 2026, saw significant market movements, driven primarily by a surge in crude oil prices past $100 per barrel for WTI and Brent, a direct consequence of Iran's actions in the Strait of Hormuz. This geopolitical flare-up immediately sent ripples through global markets, boosting the US Dollar Index (DXY) to 99.91 and simultaneously hammering risk assets like the S&P 500, which plunged 2% to 6357.55, and the Nasdaq 100, down 2.23% to 23092.5. Against this backdrop, the Pound Sterling (GBP) struggled, with GBPUSD retreating to $1.32699 by Friday's close. The narrative of 'risk-off' dominated, pushing safe-haven demand towards the dollar, and by extension, weighing on Sterling.
From a GBPUSD perspective, the daily technical picture paints a decidedly bearish canvas. The Average Directional Index (ADX) on the daily timeframe stands at a robust 29.89, indicating a strong prevailing trend. This is corroborated by the Relative Strength Index (RSI) at 41.23, which, while not deeply oversold, clearly shows bearish momentum. The Moving Average Convergence Divergence (MACD) also remains in negative territory, with its histogram below the signal line, reinforcing the downward pressure. The price action itself has been consistently printing lower highs and lower lows, and the pair has struggled to reclaim key psychological levels, including the recently tested $1.34 handle, which now acts as a significant resistance. The stark contrast between the daily bearish signals and the more neutral intraday indicators highlights a potential for consolidation or even a short-term bounce, but the overarching trend remains undeniably to the downside.
Navigating the Technical Maze: A Multi-Timeframe View
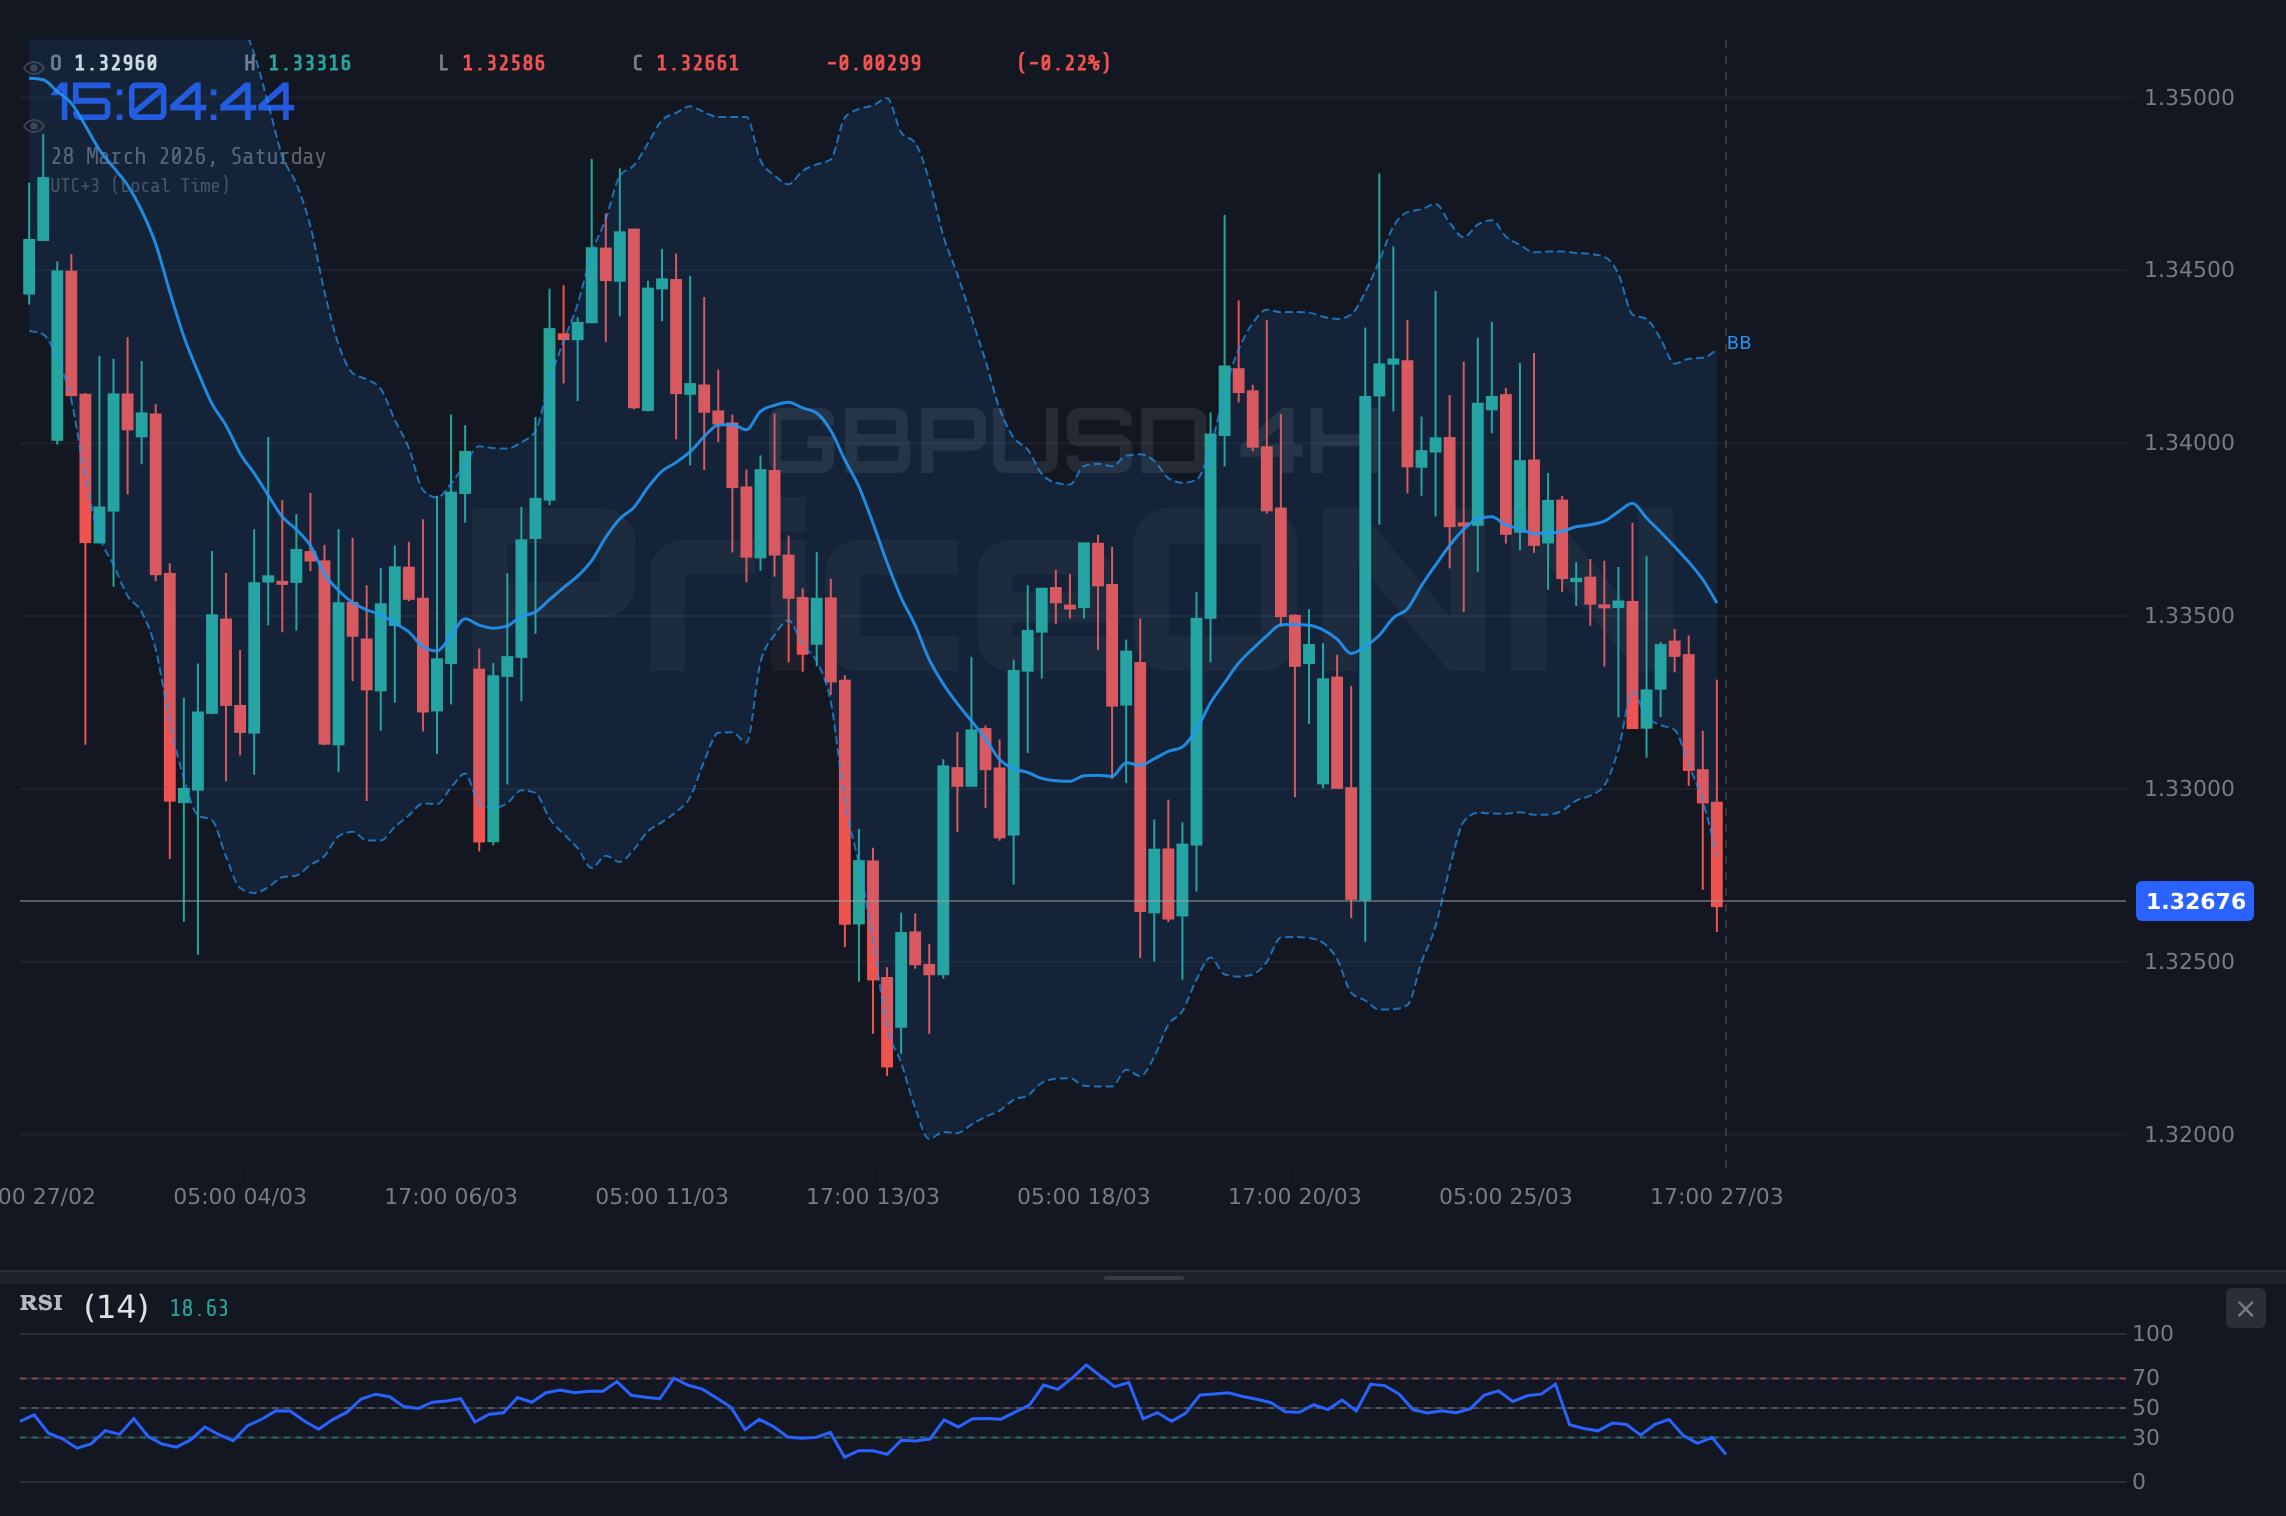
Zooming into the shorter timeframes reveals a more nuanced, and perhaps less decisive, picture for GBPUSD. On the 1-hour chart, the trend strength (ADX) plummets to a mere 16.17, suggesting a lack of directional conviction. The RSI hovers around 33.58, indicating oversold conditions that could precede a short-term bounce, while the Stochastic oscillator's %K line (13.7) is below its %D line (23.9), further supporting a potential snap-back. Similarly, the 4-hour chart shows an ADX of 13.78, signaling a weak trend and choppy market conditions. Here, the RSI sits at 33.57, and the Stochastic shows %K at 12.07 and %D at 21.64, both in oversold territory and suggesting a potential for a rebound. This divergence between the strong daily downtrend and the weaker, potentially oversold intraday signals is crucial. It implies that while the larger trend is down, the immediate path might involve sideways movement or a temporary retracement as the market digests recent moves and awaits fresh catalysts.
The current price of $1.32699, sitting just above the 1.32501 support level on the 1H chart and above the 1.32723 support on the 4H chart, represents a critical juncture. A failure to hold these levels could accelerate the decline towards the daily support at 1.32313. Conversely, a sustained bounce from these intraday support zones could see GBPUSD test the immediate resistance levels around 1.32753 and 1.32814 on the 1H chart, and 1.33183 on the 4H chart. The market sentiment, as indicated by the broad risk-off move in equities and the strengthening dollar (DXY at 99.91), heavily favors downside scenarios. However, the oversold readings on intraday oscillators cannot be ignored; they suggest that any further downside might be met with increasing buying pressure, especially if geopolitical fears begin to recede or if upcoming UK data surprises to the upside.
The Geopolitical Storm: Iran, Oil, and the Dollar's Ascent
The most significant driver impacting GBPUSD, and indeed most global currency pairs, over the past week has been the escalation of geopolitical tensions in the Middle East. Iran's assertive actions in the Strait of Hormuz, a vital chokepoint for global oil supply, triggered a sharp spike in crude oil prices. WTI surged to $101.19 and Brent crude to $110.64, marking substantial daily gains of 7.69% and 6.77% respectively. This surge in energy prices, historically a precursor to broader inflationary pressures, immediately put central banks on alert. For the market, this translated into a flight to safety, bolstering demand for the US dollar. The DXY, a basket of major currencies against the dollar, climbed to 99.91, reflecting this renewed dollar strength.
This dynamic directly impacts GBPUSD. As the dollar strengthens, the pound, by definition, weakens against it. The correlation between DXY and GBPUSD, while not always perfect, is a crucial factor. With DXY pushing higher, it creates a natural headwind for GBPUSD. Furthermore, the surge in oil prices, if sustained, could reignite inflation concerns not only in the US but also globally, including in the UK. This adds another layer of complexity for the Bank of England (BoE). While higher energy prices might normally suggest a more hawkish stance from the central bank to combat inflation, the current economic climate and the broader risk-off sentiment might force the BoE to tread cautiously, potentially leading to a dovish tilt if growth concerns dominate. This potential divergence in central bank policy expectations - a strong dollar supported by geopolitical risk versus a potentially cautious BoE - is a key theme to watch.
The impact of these geopolitical events is palpable across other markets as well. The S&P 500's 2% drop to 6357.55 and the Nasdaq's 2.23% decline to 23092.5 underscore the prevailing risk-aversion. Investors are shedding riskier assets and seeking refuge in perceived safe havens. This sentiment is crucial for GBPUSD. A sustained 'risk-off' environment typically favors the dollar and can weigh on Sterling, which is often seen as a more sensitive currency to global economic health. The question remains whether the current geopolitical situation will lead to a prolonged period of dollar strength and risk aversion, or if market participants will begin to price in a de-escalation, which could lead to a reversal of these trends. The market's reaction to upcoming news flow from the Middle East will be paramount.
Fundamental Forces: UK Inflation and BoE's Tightrope Walk
Looking ahead to the upcoming week, the fundamental picture for GBPUSD is dominated by critical UK economic data, particularly the upcoming Consumer Price Index (CPI) release. While the exact date is not specified in the provided economic calendar, high-impact events like these are pivotal. Historically, sticky inflation figures have prompted a more hawkish stance from central banks. For the Bank of England (BoE), persistently high inflation would normally necessitate further tightening or at least a prolonged period of holding interest rates at elevated levels. However, the current economic climate presents a difficult balancing act. The global slowdown fears, exacerbated by geopolitical risks, coupled with the potential for imported inflation from rising energy prices, create a complex scenario for policymakers.
If the UK CPI data comes in hotter than the forecast of 3 (previous was 3), it could bolster expectations for a hawkish BoE, potentially providing some support for the Pound. Traders will be scrutinizing the actual figures against the forecast to gauge the market's reaction. A print significantly above expectations might lead to a reassessment of BoE rate cut timelines, pushing Sterling higher. Conversely, a softer inflation print could fuel bets on earlier rate cuts, adding further downward pressure on GBPUSD, especially if it coincides with a strong dollar. The market's interpretation of the data and its implications for future BoE policy will be key. We must also consider the US side of the equation; while the UK data is crucial, the Fed's own policy path, heavily influenced by US inflation and employment figures, will continue to be a major determinant of dollar strength.
The provided economic calendar highlights several US data releases, including a significant figure for 'Actual: 6.926' versus 'Forecast: -1.3' for an unspecified USD event, and another with 'Actual: 210' versus 'Forecast: 211'. These discrepancies, particularly the positive actual versus negative forecast in the former, suggest potential dollar strength if similar trends continue. Market participants will be closely watching these US indicators for clues about the Federal Reserve's next move. If US economic data continues to paint a robust picture, it could reinforce the Fed's hawkish bias or delay rate cut expectations, further supporting the DXY and weighing on GBPUSD. The interplay between UK inflation data and US economic strength will be a critical battleground for GBPUSD next week.
Furthermore, the recent PriceONN market news suggests a narrative of improving market sentiment, with some headlines hinting at a potential rebound for GBPUSD. However, this often occurs within the context of broader geopolitical jitters. For instance, headlines like "Is GBP/USD Poised for a Rally as Market Sentiment Shifts and Iran Oil Shock Fades?" indicate that any easing of geopolitical tensions could trigger a GBPUSD recovery. This highlights the sensitivity of the pair to global risk appetite. A de-escalation in the Middle East would likely see a reversal of the 'risk-off' flows, benefiting Sterling and potentially leading to a test of higher resistance levels for GBPUSD. The current consolidation around $1.33, therefore, sits at a precipice, awaiting clearer signals from both the geopolitical front and the economic data releases.
Scenarios for the Week Ahead
Bearish Scenario: Downside Momentum Persists
65% ProbabilityNeutral Scenario: Range-Bound Consolidation
25% ProbabilityBullish Scenario: Short-Covering Rally
10% ProbabilityFrequently Asked Questions: GBPUSD Analysis
What happens if GBPUSD breaks below the $1.3250 support level?
A break below $1.3250 on the 1-hour chart, especially if confirmed by a daily close below $1.3231, would likely trigger further downside momentum. This could see GBPUSD targeting the $1.3190 level as the bearish trend continues.
Should I buy GBPUSD at current levels of $1.32699 given the oversold intraday signals?
While intraday charts show oversold conditions (RSI 33.58), the daily trend remains bearish (ADX 29.89). A contrarian buy would require strong confirmation, such as a break above $1.3350, and carries a higher risk due to the dominant downtrend. A probability of only 10% is assigned to a bullish scenario.
Is the RSI at 41.23 a sell signal for GBPUSD?
An RSI of 41.23 on the daily chart is not a direct sell signal but indicates bearish momentum is present and the pair is not yet oversold. It suggests that selling pressure could continue, especially if it fails to recover towards the 50-level, which is often seen as a neutral zone.
How will the upcoming UK CPI data affect GBPUSD this week?
A UK CPI figure significantly above the forecast of 3 could bolster BoE hawkish expectations, potentially supporting GBPUSD. Conversely, a softer print might lead to increased bets on BoE rate cuts, adding downward pressure, especially if US data remains strong.
Track markets in real-time
AI-powered analysis, technical indicators and real-time price data.
Join Our Telegram Channel
Breaking market news, AI analysis and trading signals instantly.
Join Channel