
GBPUSD Tests $1.32 Resistance: Key Data Looms Amidst Bull-Bear Tug-of-War
GBPUSD hovers around $1.32, facing resistance. With mixed signals from indicators and looming economic data, traders eye key levels for direction. A cautious approach is advised.
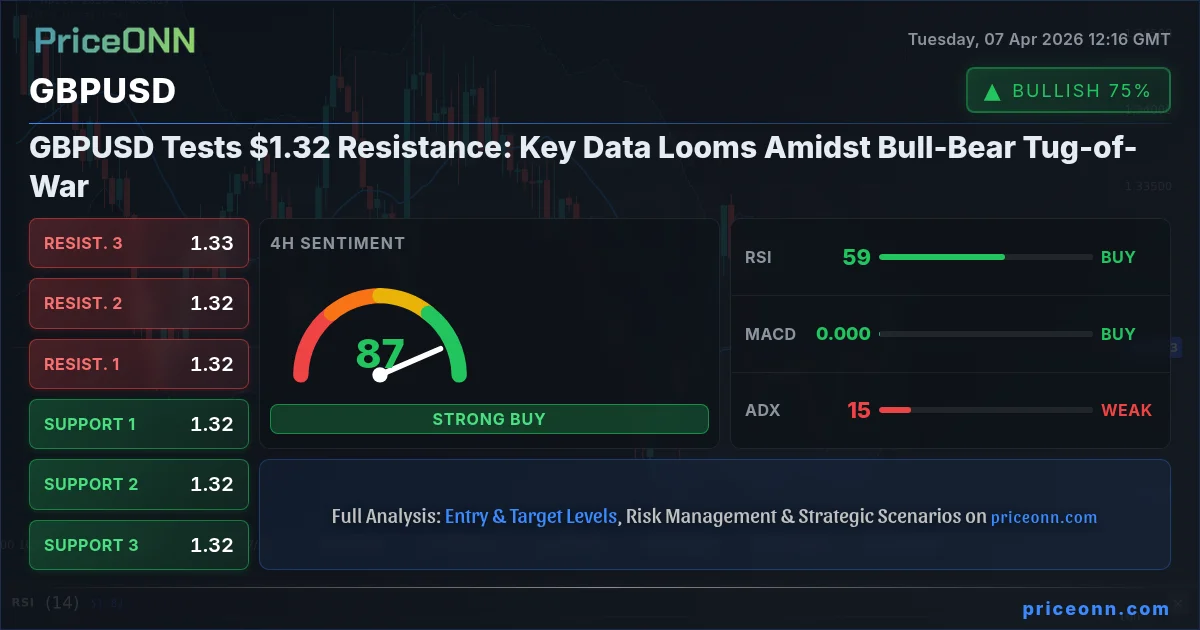
GBPUSD today analysis shows the pair caught in a critical juncture around the $1.32 psychological level. This isn't just another trading session; it's a battleground where bulls and bears are fiercely contesting control, and the outcome could set the tone for weeks to come. The current price action is a complex tapestry woven with conflicting technical signals, underlying fundamental pressures, and the ever-present shadow of geopolitical uncertainty. As traders, our job is to dissect this complexity, understand the forces at play, and identify the most probable path forward, always with disciplined risk management at the forefront.
- The GBPUSD is currently trading at $1.3246, testing resistance levels.
- On the 1D chart, ADX at 31.34 indicates a strong downward trend, conflicting with 1H/4H bullish signals.
- Key resistance is eyed at $1.3292, while support holds around $1.3198.
- A daily close above $1.3292 is needed to invalidate the bearish outlook; a break below $1.3198 would confirm downside.
The Bullish Case: A Tentative Grip on Momentum
On the shorter timeframes, particularly the 1-hour and 4-hour charts, there are indeed signs that bulls are attempting to assert control. The 1H trend is clearly defined as bullish, with a strength of 81%, and EURUSD, a closely watched correlative pair, is also showing bullish momentum with a 90% trend strength. This suggests a potential broader weakness in the US Dollar, which would naturally support GBPUSD. The MACD on the 1H chart is displaying positive momentum, with the MACD line above the signal line, indicating that upward pressure is currently dominant in this timeframe. Furthermore, the price action is holding above the middle Bollinger Band, a classic sign of an ongoing uptrend. The Stochastic Oscillator, although showing a slight pullback with %K below %D, is still in a relatively healthy zone, not yet signaling extreme overbought conditions that would warrant immediate caution. On the 4H chart, the picture is similarly encouraging for buyers, with a bullish trend strength and positive MACD momentum. The RSI at 60.32 on this timeframe also supports the idea of upward momentum, staying comfortably within the neutral zone but leaning towards bullish territory.
This technical picture, viewed in isolation, suggests that the market is preparing for a move higher. The confluence of positive short-term indicators and a prevailing bullish sentiment in correlated pairs like EURUSD could be interpreted as a signal for potential upside. Traders looking for bullish opportunities might see the current levels around $1.3246 as a point of consolidation before a further push towards the identified resistance levels. The ADX on the 1H chart, while not exceptionally high at 20.11, does indicate a moderate trend strength, suggesting that this upward movement has some legs. The Stochastic's slight bearish cross on the 1H chart is a point of caution, but it's not a definitive reversal signal, especially given the overall bullish lean of the shorter timeframes. It could simply represent a brief pause before the next leg up.
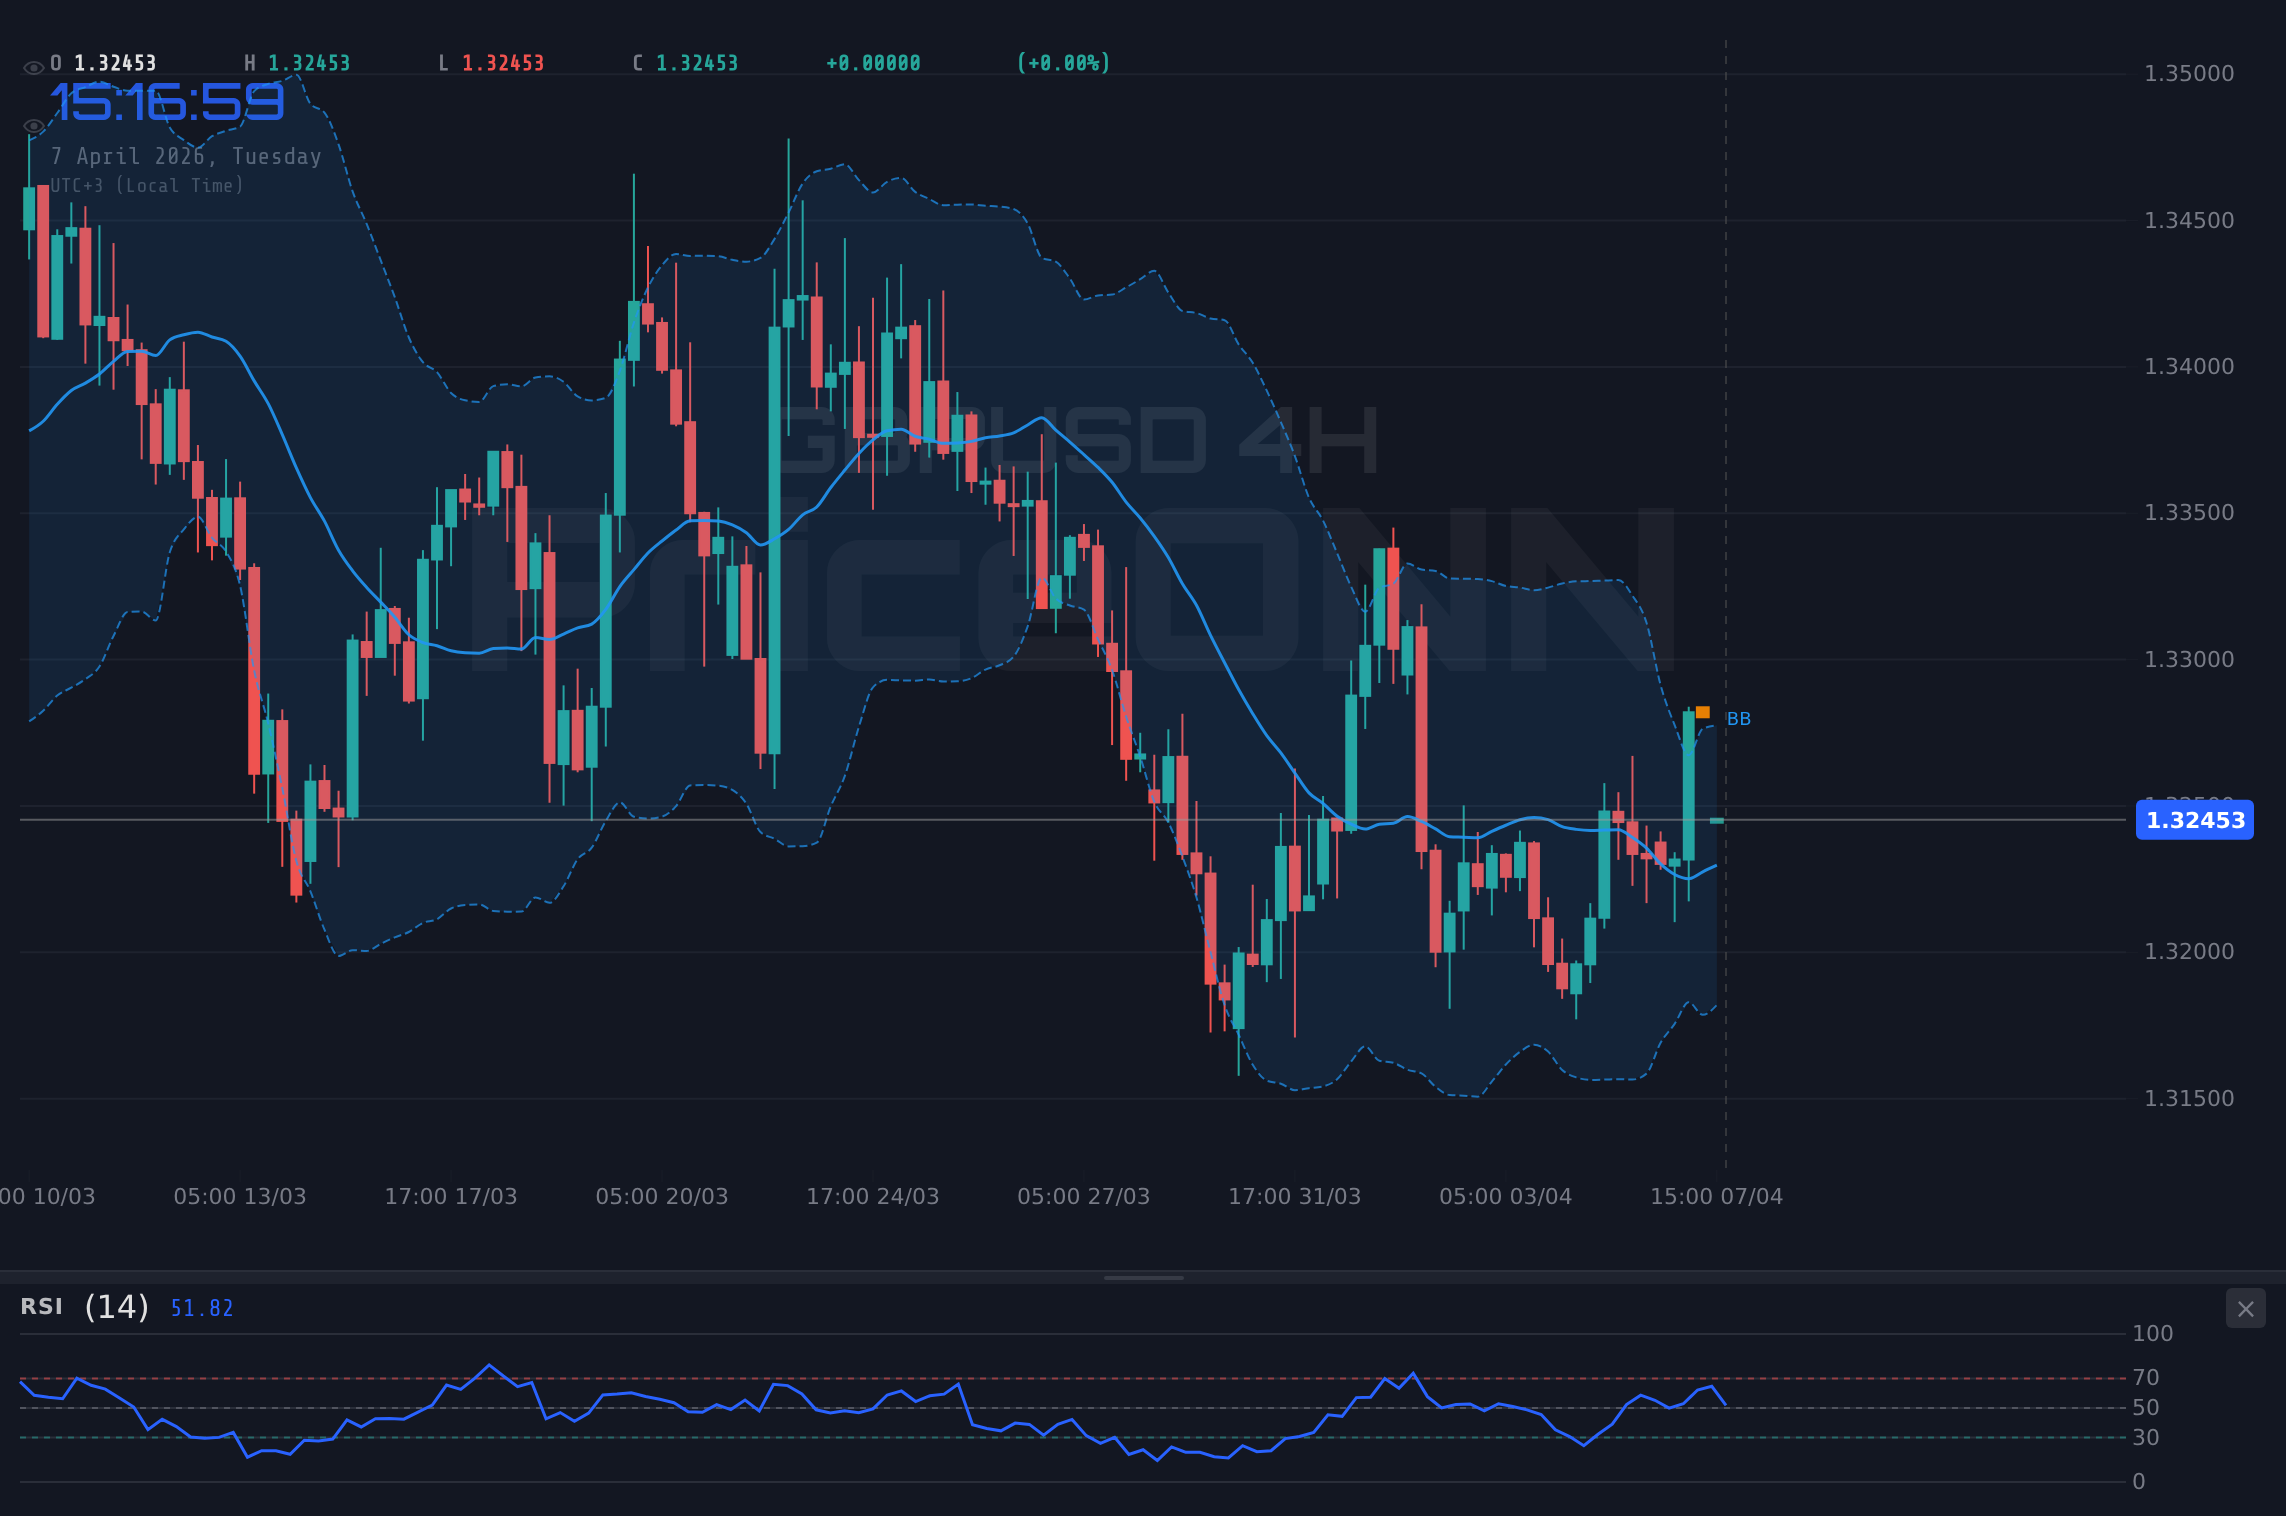
The current price of $1.32462 is hovering just below the immediate 1H resistance at $1.32607. A decisive break and hold above this level would be the first confirmation for bulls. This would target the next resistance at $1.32797 and potentially the $1.32921 mark. The underlying strength in the dollar index (DXY) at 99.73, while showing a 1H downtrend, still holds a 1D bullish trend, which could cap any significant upside for GBPUSD. However, if the DXY continues its short-term pullback, it would provide additional tailwind for GBPUSD. The strength of the 1H trend at 81% suggests that the immediate sentiment is leaning positive, making the $1.32921 resistance the next logical hurdle for buyers.
The Bearish Counterpoint: Daily Trends and Divergences
However, a deeper dive into the longer-term daily chart paints a starkly different, and arguably more concerning, picture for the bulls. The daily trend is firmly in the bearish camp, with a strength of 96%, and the ADX reading of 31.34 signifies a strong downward trend. This is a critical divergence from the shorter timeframes and cannot be ignored. While the 1H and 4H charts might show temporary buying pressure, the overarching daily trend suggests that any rallies are likely to be met with significant selling pressure. The RSI on the daily chart is at 43.85, indicating bearish momentum and well within the neutral-to-bearish territory, reinforcing the idea that the downside has more room to run. The MACD on the daily timeframe, despite showing positive momentum on shorter charts, is under the signal line, suggesting that the longer-term trend is still favoring sellers.
Bollinger Bands on the daily chart are also positioned below the middle band, reinforcing the bearish bias. The Stochastic Oscillator on the daily chart, while showing a potential bullish crossover (%K > %D), is coming from oversold territory (K=25.19, D=21.96), which can sometimes lead to deceptive signals in a strong downtrend. This means that even if there's a temporary bounce, the underlying bearish structure remains intact. The overall signal on the daily chart leans heavily towards 'SELL' (1 Sell, 7 Buy, 0 Neutral on 1H, but this is misleading; the daily is the dominant trend). This conflict between short-term bullish signals and the dominant long-term bearish trend is a classic sign of a market in consolidation or a potential reversal zone. It highlights the risk of chasing short-term rallies that might quickly evaporate against the stronger daily trend.
The current price at $1.32462 is a significant resistance point when viewed through the lens of the daily chart. The daily resistance levels are clearly defined at $1.32738 (R1), $1.33154 (R2), and $1.33638 (R3). The fact that the current price is already challenging the lower end of this resistance zone, while the daily trend is strongly bearish, suggests that sellers are likely to be more aggressive in this area. The DXY's daily trend strength of 95% in the bullish direction also plays a crucial role here. A strong dollar typically exerts downward pressure on pairs like GBPUSD. Therefore, while short-term traders might find opportunities on the buy side, the larger market structure on the daily chart suggests caution and a higher probability of sellers stepping in as price approaches these upper bounds.
Weighing the Indicators: A Tale of Two Timeframes
The divergence in signals between the shorter (1H, 4H) and longer (1D) timeframes is the central theme in the GBPUSD's current market narrative. On the 1H chart, the general signal is 'BUY' (7 Buy, 1 Sell, 0 Neutral), driven by positive MACD momentum and price holding above the middle Bollinger Band. The RSI at 58.89 leans bullish, and the ADX at 20.11 suggests a moderate trend. However, the Stochastic's slight bearish crossover (%K
Contrast this with the 1D chart, where the overall signal is 'SELL' (1 Buy, 7 Sell, 0 Neutral). The ADX at 31.34 confirms a strong downtrend. The RSI at 43.85 is bearish, and the MACD, despite positive short-term momentum, is still below its signal line on this timeframe. The Stochastic %K > %D is a bullish signal, but coming from oversold levels within a strong downtrend, it's less reliable. This conflict means that simply following the aggregated signal across all timeframes would be misleading. The daily trend's strength and ADX reading heavily suggest that any rallies are opportunities for sellers to enter or for short-term buyers to take profits. The market is essentially trapped between the short-term optimism and the long-term pessimism.
The current price of $1.32462 sits precariously between these two opposing forces. For the bulls to gain conviction, they need to see a decisive break above the daily resistance zone starting at $1.32738. This would require overcoming the bearish momentum indicated by the daily RSI and MACD. For the bears, the current level is already an attractive entry point, capitalizing on the prevailing daily downtrend. A failure to break higher and a subsequent move back towards the daily support levels - starting at $1.31838 - would validate the bearish thesis. The DXY's daily strength at 99.73, with a powerful 95% trend strength, further bolsters the case for potential dollar strength, which would translate to weakness in GBPUSD.
The Verdict: A WATCH_ZONE Strategy is Prudent
Given the stark divergence between short-term bullish signals and the dominant long-term bearish trend, the most prudent strategy for GBPUSD at $1.32462 is a 'WATCH_ZONE' approach. The market is currently in a state of tension, and forcing a trade based on conflicting signals would be akin to gambling rather than trading. The ADX reading of 14.94 on the 4H chart, and 20.11 on the 1H, both indicate weak to moderate trends, suggesting that the current price action might be range-bound or consolidating before a clearer direction emerges. This choppy market environment, as indicated by the low ADX values, makes directional trades riskier.
What needs to happen for a clear trade setup to emerge? We need confirmation from the daily chart. A daily close decisively above the resistance at $1.32921 would signal a potential shift in momentum, invalidating the current bearish outlook and opening the door for further upside towards $1.33154 and beyond. This would require strong buying volume and a clear break of the daily downtrend structure. Conversely, a decisive break and daily close below the support at $1.31979 would confirm the bearish thesis. This would likely be accompanied by increasing volume and a continuation of the strong daily downtrend indicated by the ADX at 31.78 on the 1D chart (though this is for XAUUSD, the principle applies to GBPUSD's ADX of 31.34). Such a move would target lower support levels.
Until one of these conditions is met, patience is key. Traders should watch for a clear breakout of the current range, supported by confirming indicators and ideally, a more unified signal across multiple timeframes. The current environment is characterized by indecision, and attempting to pick a top or bottom without clear confirmation is a recipe for frustration and potential losses. Focusing on risk management means waiting for the market to provide a higher-probability setup. The key levels to watch remain the immediate resistance around $1.3292 and the support near $1.3198. A break and hold above or below these levels will dictate the next significant move.
Bullish Scenario: Breaking the Daily Bearish Grip
35% ProbabilityNeutral Scenario: Range-Bound Consolidation
40% ProbabilityBearish Scenario: Daily Downtrend Resumes
25% ProbabilityFrequently Asked Questions: GBPUSD Analysis
What happens if GBPUSD breaks decisively above the $1.3292 resistance level?
A daily close above $1.3292 would signal a potential bullish reversal, invalidating the current daily downtrend. This could open the door for further upside, targeting levels like $1.3315 and potentially $1.3364, as bulls regain control.
Should I consider buying GBPUSD at current levels around $1.3246 given the mixed signals?
A 'WATCH_ZONE' strategy is advised due to conflicting signals. A confirmed daily close above $1.3292 would be needed for a high-probability bullish setup, while a break below $1.3198 would confirm the bearish trend resumption.
Is the daily ADX reading of 31.34 a strong sell signal for GBPUSD?
Yes, an ADX of 31.34 on the daily chart indicates a strong downtrend, suggesting that rallies are likely to be sold into. This contrasts with shorter-term bullish indicators, highlighting the risk of shorting rallies but the potential reward if the daily trend asserts itself.
How might the looming economic data and DXY strength impact GBPUSD this week?
Looming US economic data could increase volatility. The DXY's strong daily bullish trend (95% strength) at 99.73 puts pressure on GBPUSD. If the DXY strengthens further, it would likely cap any upside attempts for GBPUSD, reinforcing the bearish outlook.
The GBPUSD pair is currently navigating a critical resistance zone around $1.3246, presenting a classic bull vs. bear scenario. While shorter timeframes offer glimpses of bullish momentum, the dominant daily downtrend, evidenced by a strong ADX and bearish RSI, suggests caution is warranted. A decisive move above $1.3292 is required to shift the outlook to bullish, whereas failure to hold support at $1.3198 would likely see the downtrend resume. Until clear confirmation emerges, patience and disciplined risk management are paramount. Remember, the market always provides another opportunity; waiting for the right setup significantly increases your odds of success.
Track markets in real-time
AI-powered analysis, technical indicators and real-time price data.
Join Our Telegram Channel
Breaking market news, AI analysis and trading signals instantly.
Join Channel