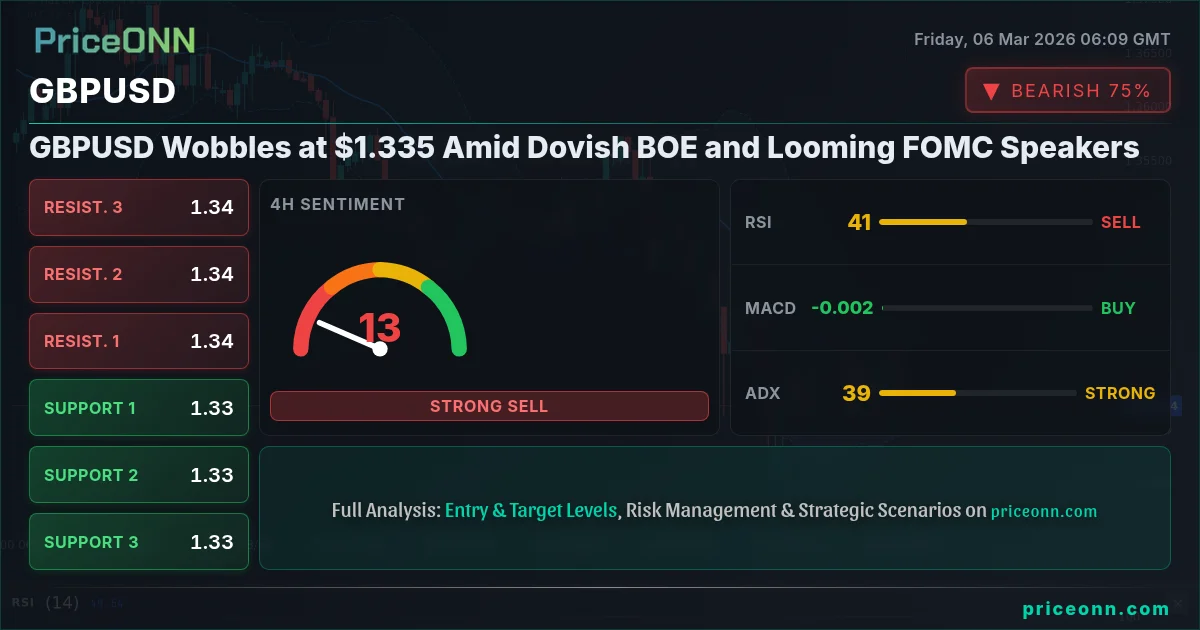
Why is the pound falling today? GBPUSD is currently trading around $1.335, a level that is proving to be a critical juncture as traders weigh dovish signals from the Bank of England against the potential for hawkish rhetoric from upcoming FOMC speakers. The currency pair is caught in a tug-of-war, with the dollar's strength and geopolitical uncertainties adding to the mix. A key factor driving this price action is the market's anticipation of these FOMC statements, which could offer clues about the Federal Reserve's future interest rate path and overall monetary policy stance.
- RSI on the 1D timeframe sits at 36.55, indicating potential for further downside momentum.
- Critical support level to watch is 1.33047, a break below which could trigger a sharper sell-off.
- The MACD histogram confirms negative momentum, suggesting bearish pressure is likely to continue.
- DXY strength is exacerbating GBPUSD weakness, with the dollar index currently trading at 98.8.
Having tracked GBPUSD through various economic cycles, it's clear that the pair is highly sensitive to interest rate differentials and central bank policy announcements. The recent dovish comments from BOE officials are weighing on the pound, creating a challenging environment for bulls. On the other hand, the dollar is finding support as geopolitical tensions and positive economic data fuel safe-haven demand. This dynamic is evident in the DXY's recent performance, which currently sits at 98.8. The strength of the dollar is putting downward pressure on GBPUSD, making it difficult for the pair to sustain any meaningful rallies.
The 1-hour chart presents a neutral trend, but the RSI reading of 51.62 suggests that bullish momentum is not strong enough to drive a sustained upward move. The MACD is showing positive momentum, but the overall picture remains mixed. This is where the importance of multi-timeframe analysis comes into play. While the 1-hour chart might offer some short-term bullish signals, the longer-term charts paint a different picture. Scalpers may find short-term opportunities, but swing traders and long-term investors should exercise caution.
Looking at the 4-hour timeframe, the trend also appears neutral, but the RSI dips to 46.41, indicating the possibility of a looming downturn. The ADX reading of 38.7 suggests a strong downtrend on this timeframe. A reading above 25 typically indicates a strong trend, and the current ADX value confirms that bearish momentum is present. This suggests that the bears are still in control on the 4-hour chart, and any attempts by the bulls to stage a rally may be short-lived.
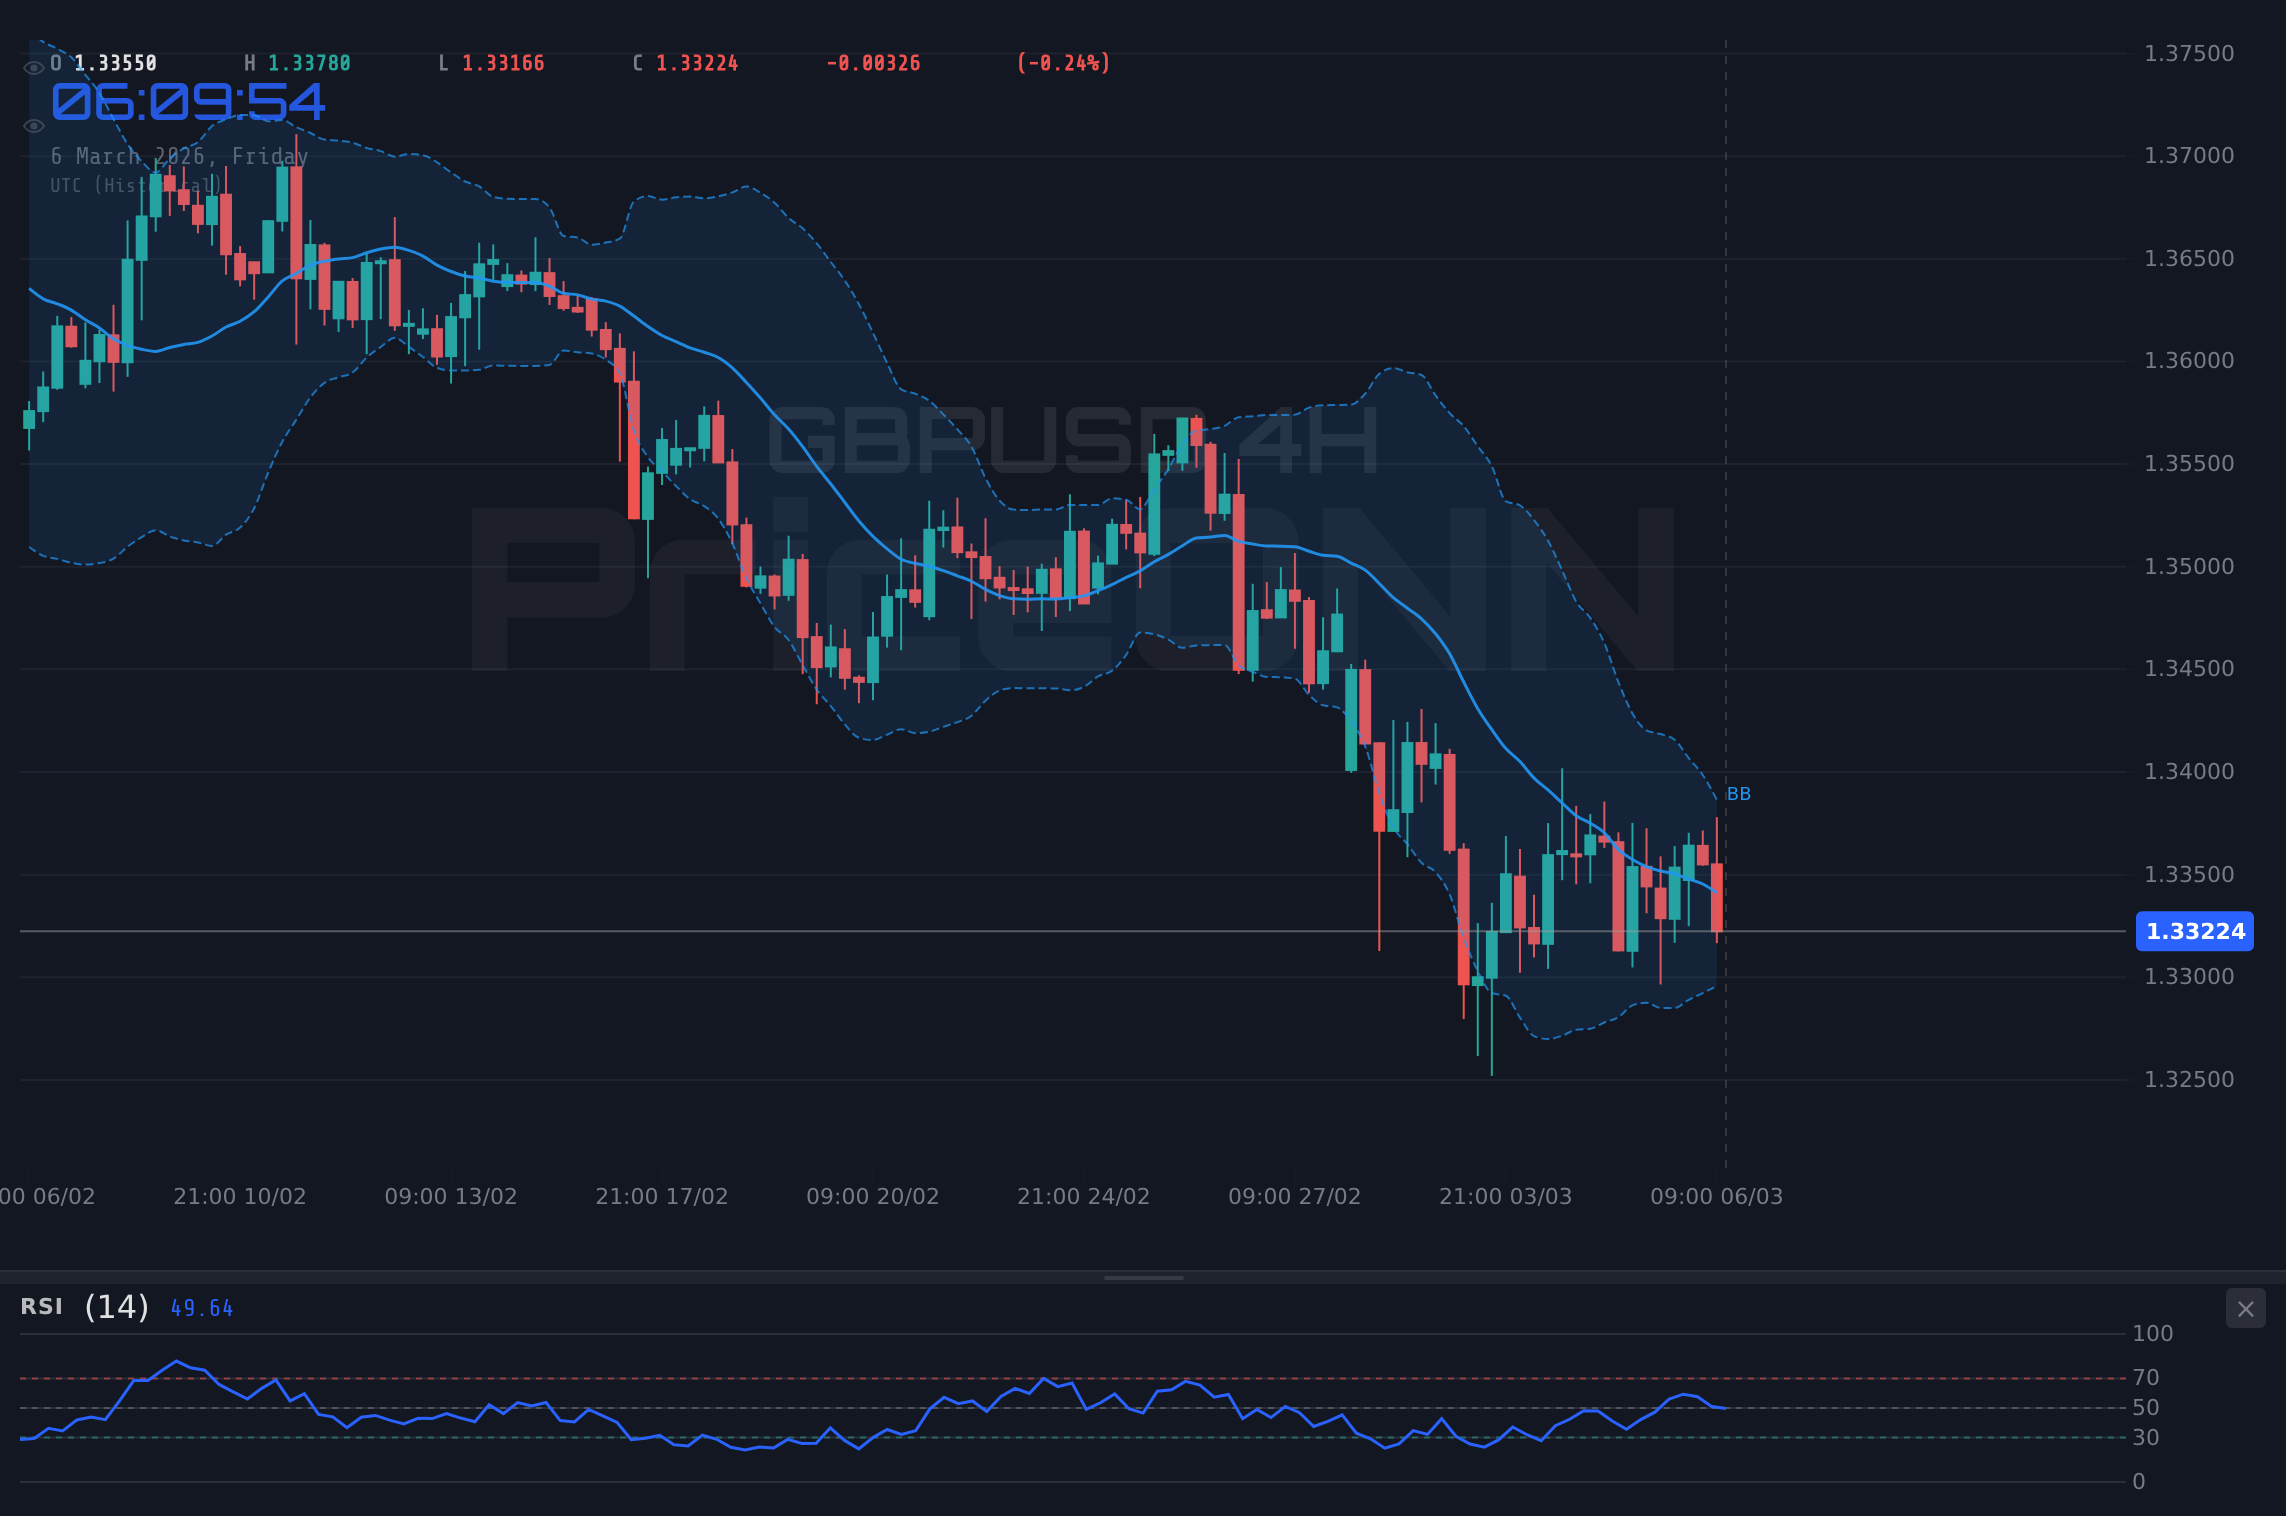
The daily chart reveals a bearish trend. The RSI stands at 36.55, which is a relatively low value. The Stochastic oscillator shows K=32.98, D=30.94 - indicating a potential bullish crossover, however, it is still in the oversold territory, suggesting the downside is far from over. The ADX is at 28.82, confirming a strong downtrend. This reinforces the bearish outlook for GBPUSD, suggesting that the pair is likely to face continued downward pressure in the coming days and weeks.
From a fundamental perspective, the divergence in monetary policy between the Bank of England and the Federal Reserve is a significant driver of GBPUSD's performance. As the BOE signals a more cautious approach to raising interest rates, the dollar is gaining an edge. This is compounded by geopolitical risks, which are further bolstering the dollar's safe-haven appeal. According to Reuters, Fed officials are closely monitoring inflation data as they assess the timing of future rate hikes. This hawkish stance is in stark contrast to the BOE's more dovish tone, contributing to the downward pressure on GBPUSD.
The key levels to watch for GBPUSD are 1.33047 as the immediate support. A break below this level could lead to a test of the next support at 1.32561. On the upside, 1.33938 acts as the immediate resistance. If the bulls manage to overcome this hurdle, the next resistance lies at 1.34343. These levels are crucial for understanding the potential price action in the short term. Scalpers may use these levels to identify quick profit-taking opportunities, while swing traders will be closely monitoring these levels for potential breakout or breakdown scenarios.
The overall signal is bearish on the daily timeframe, suggesting that the bears are in control. However, the shorter-term timeframes present a more mixed picture, with some bullish signals emerging. This is where the importance of risk management comes into play. Traders should be prepared for potential volatility and should use stop-loss orders to protect their capital. It's also important to consider position sizing, as the potential for whipsaws and false breakouts is high in the current market environment.
Looking ahead, the upcoming FOMC speakers will be a key catalyst for GBPUSD. If these speakers strike a hawkish tone, the dollar is likely to strengthen further, putting additional downward pressure on the pair. On the other hand, if they adopt a more cautious stance, the pound could stage a relief rally. The market is currently pricing in a high probability of further rate hikes by the Fed, but this could change quickly depending on the data and the tone of these FOMC speakers. It's also important to keep an eye on geopolitical developments, as any escalation in tensions could further boost the dollar's safe-haven appeal.
From a correlation perspective, the DXY is inversely related to GBPUSD. The SP500 and Nasdaq indexes are also important to watch, as they can provide insights into overall risk sentiment. If the SP500 and Nasdaq start to decline, this could signal a shift towards risk aversion, which would likely benefit the dollar and put further pressure on GBPUSD. Oil prices are also relevant, as they can influence inflation expectations and central bank policy. If oil prices continue to rise, this could lead to higher inflation, which could prompt the Fed to adopt a more aggressive stance on interest rates. WTI crude is currently trading at $80.47, while Brent is at $65.73.
Historically, GBPUSD has tended to exhibit mean-reverting behavior. Periods of significant strength or weakness have often been followed by a reversal back towards the mean. This suggests that the current bearish trend may not last forever, and a relief rally is possible at some point. However, it's important to wait for confirmation before attempting to fade the trend. A break above the 1.33938 resistance level could signal the start of a more sustained recovery. Until then, the bears remain in control.
For scalpers, the key is to focus on the shorter-term timeframes and to use tight stop-loss orders. The 1-hour chart can provide valuable insights into potential entry and exit points. Swing traders should focus on the 4-hour and daily charts, looking for potential breakout or breakdown scenarios. Long-term investors should take a broader perspective, considering the overall macroeconomic environment and the divergence in monetary policy between the Bank of England and the Federal Reserve.
A daily close above 1.33938 would open the door for a test of the next resistance at 1.34343. This level is crucial for the bulls, as a break above it could signal the start of a more sustained recovery. However, the bears are likely to defend this level aggressively, and a failure to overcome it could lead to a renewed sell-off. The market is currently in a wait-and-see mode, as traders await further clarity from the upcoming FOMC speakers and key economic data releases.
Frequently Asked Questions: GBPUSD Analysis
Is GBPUSD a good buy right now?
Given the current bearish trend and potential for further dollar strength, GBPUSD is not a strong buy right now. A more attractive entry point might present itself near the 1.33047 support level, but only if accompanied by bullish confirmation signals.
What is the GBPUSD price forecast for this week?
The GBPUSD price forecast for this week is cautiously bearish. The pair is likely to trade in a range between 1.33047 and 1.33938, with a 60% probability of breaking lower if FOMC speakers lean hawkish.
What are the key support and resistance levels for GBPUSD?
Key support levels for GBPUSD are 1.33047, 1.32561, and 1.32156. Resistance levels are 1.33938, 1.34343, and 1.34829, as indicated by the current market data.
Why is GBPUSD moving today?
GBPUSD is moving today due to a combination of factors, including dovish signals from the Bank of England, dollar strength driven by geopolitical concerns, and anticipation of upcoming FOMC speakers who may influence the Fed's monetary policy.
Volatility creates opportunity-those prepared will be rewarded.
Track markets in real-time
AI-powered analysis, technical indicators and real-time price data.
Join Our Telegram Channel
Breaking market news, AI analysis and trading signals instantly.
Join Channel