Iran Crisis Market Analysis: What Monday's Opening Means for Gold, Silver, and Crypto Investors
The elimination of Iran's Supreme Leader Khamenei in a joint U.S.-Israeli strike has sent shockwaves through global markets. With gold surging past $5,280, silver exploding 6.26% to $93.75, and Bitcoin swinging between $63,000 and $68,000, here is what investors must know before Monday's market opening.
The weekend of February 28, 2026 will be etched into financial history alongside the assassination of Qasem Soleimani and the outbreak of the Russia-Ukraine war as a geopolitical event that reshaped market dynamics overnight. The joint U.S.-Israeli military strike that killed Iran's Supreme Leader Ayatollah Ali Khamenei, along with several senior IRGC commanders, has created a seismic shift in the Middle Eastern power balance - and by extension, in global financial markets.
As traders and investors around the world prepare for Monday's opening bell on March 2, 2026, one question dominates every trading desk: is this the beginning of a broader conflict that will send safe-haven assets to unprecedented heights, or will the leadership vacuum in Tehran accelerate a diplomatic resolution? The answer likely lies somewhere in between, and the next 72 hours will be critical.
In this comprehensive analysis, we break down the real-time market data, evaluate technical levels, and present multiple scenarios for gold, silver, and cryptocurrency investors navigating what could be the most volatile week of 2026.
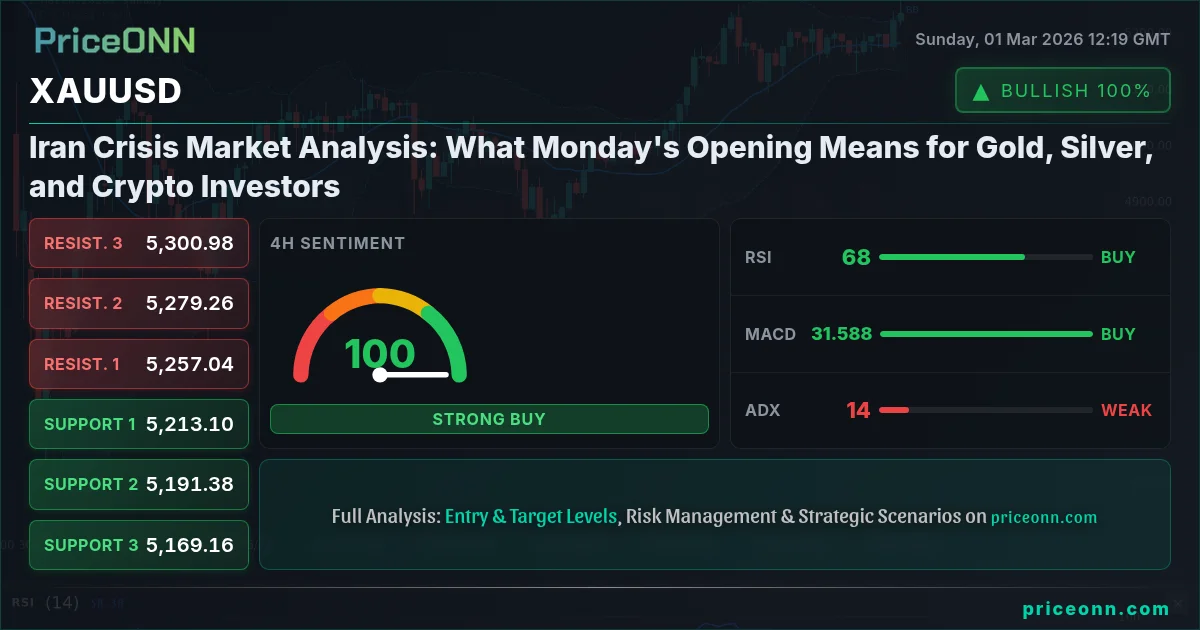
- Gold surged past $5,280 with daily technical indicators showing 93/100 bullish strength - a geopolitical premium that could persist for weeks
- Silver exploded 6.26% to $93.75, outperforming gold 3.5x as the gold-silver ratio compresses toward crisis levels
- Bitcoin swung from $63,000 to $68,200 over the weekend, revealing its dual identity as both risk asset and emerging safe haven
- Polymarket data shows 61% ceasefire probability by March 31, suggesting weeks of elevated volatility ahead
The Geopolitical Catalyst: What Happened and Why It Matters for Markets
On Friday evening, February 28, the United States and Israel launched a coordinated military operation targeting Iran's leadership infrastructure in Tehran. Iranian state media confirmed on Saturday, March 1, that Supreme Leader Ayatollah Ali Khamenei was killed in the strikes. Multiple senior Islamic Revolutionary Guard Corps (IRGC) commanders were also reported killed.
The immediate market implications are profound for several reasons:
The Strait of Hormuz Factor
Approximately 20% of the world's daily oil supply passes through the Strait of Hormuz, which Iran has historically threatened to close during escalations. With Brent crude already jumping to $65.73 (up 1.96%) and WTI surging to $67.38 (up 2.82%), any disruption to this critical chokepoint could send energy prices - and by extension, inflation expectations - significantly higher. Rising inflation expectations are the single most bullish catalyst for precious metals.
The Leadership Vacuum
Iran's appointment of Alireza Arafi to lead an interim council suggests a degree of institutional continuity, but the power struggle that follows the death of a supreme leader - a position designed to be held for life - is inherently destabilizing. Markets hate uncertainty, and this is uncertainty of the highest order.
The Escalation vs. De-escalation Calculus
According to Polymarket data, which has attracted a record $529 million in trading volume on Iran-related contracts, there is currently only a 4% chance of a U.S.-Iran ceasefire by March 2, but this rises to 61% by March 31. In other words, prediction markets are pricing in weeks of tension before a resolution - a timeframe that favors sustained safe-haven positioning.
Gold (XAU/USD): The Ultimate Safe Haven Enters Uncharted Territory
Gold has been the standout performer of 2026 even before the Iran crisis, driven by central bank buying, de-dollarization trends, and persistent inflation concerns. The Khamenei strike has now added a powerful geopolitical premium that could push prices to levels that seemed unimaginable just months ago.
Technical Analysis: What the Charts Are Telling Us
The technical picture for gold heading into Monday is overwhelmingly bullish, but with important caveats:
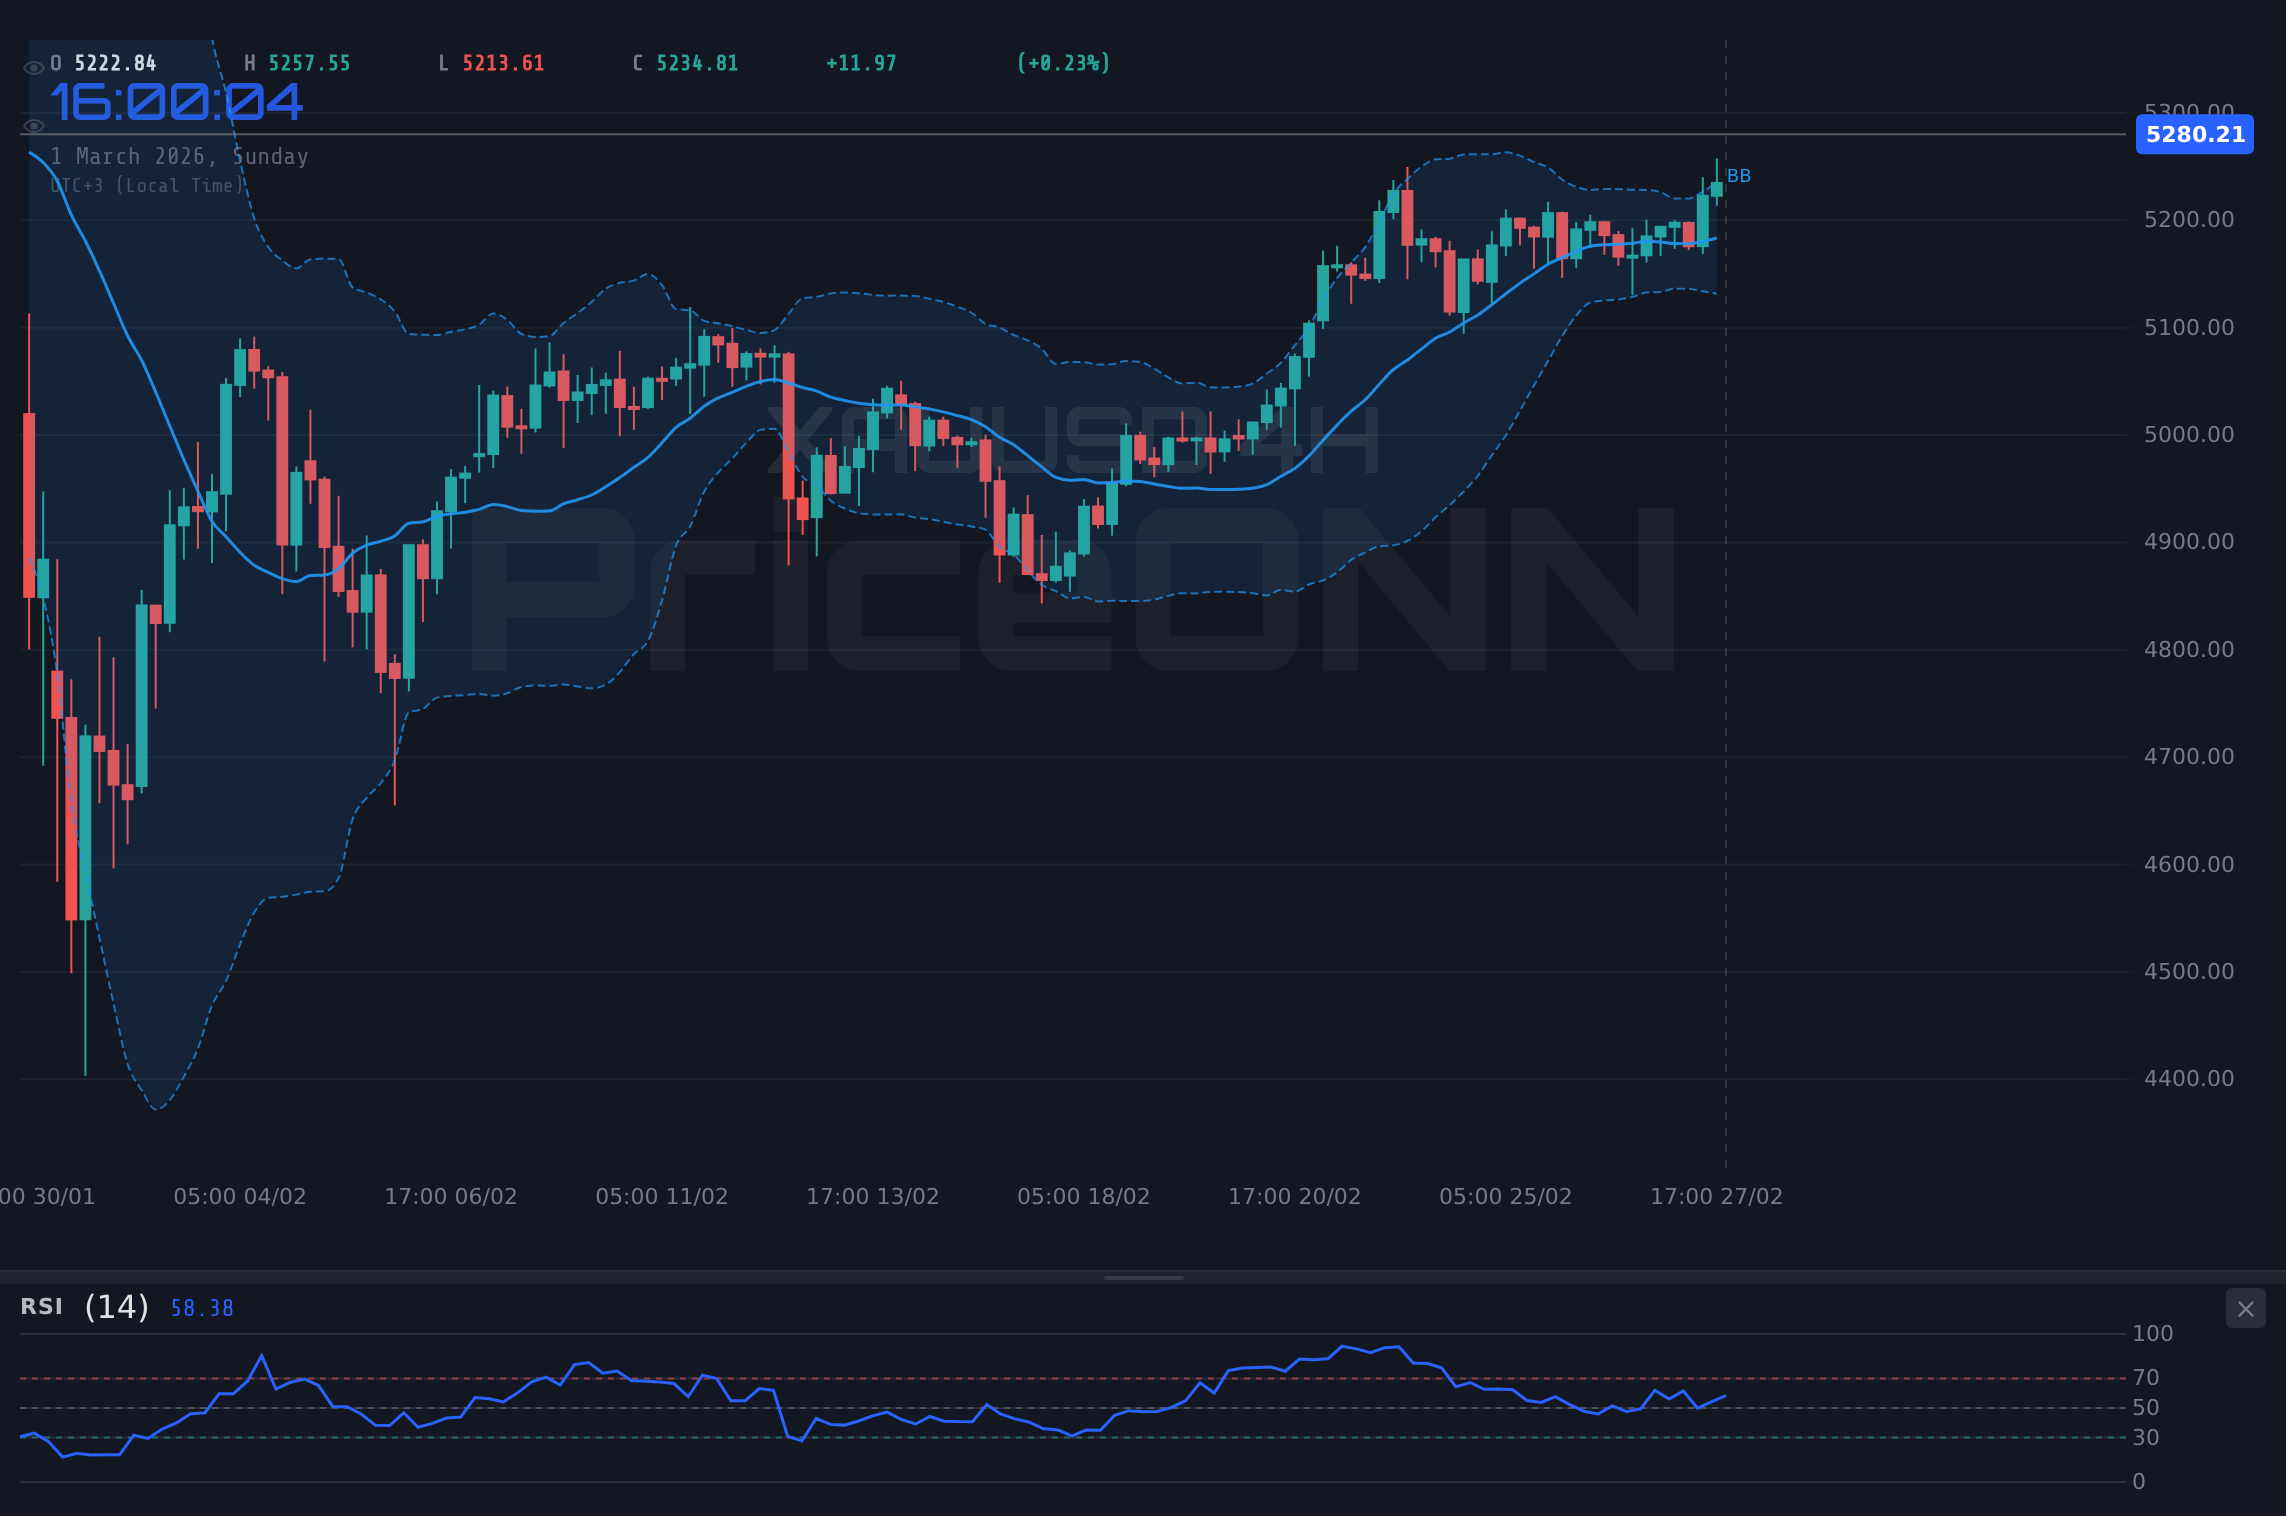
Daily Timeframe: RSI stands at 61.91, firmly in buy territory with room to run before reaching overbought levels. The MACD histogram at +9.10 confirms strong positive momentum, with the MACD line ($110.09) well above the signal line ($100.99). Gold is trading above all major moving averages - SMA 20 ($5,019), SMA 50 ($4,795), and SMA 200 ($3,959) - confirming a robust long-term uptrend. The daily indicator summary shows 7 buy signals versus just 1 sell, yielding a bullish strength score of 93/100.
Hourly Timeframe: The 1H RSI at 75.60 is in overbought territory, and Bollinger Bands show price trading above the upper band ($5,267). The Stochastic oscillator at 92.54 also signals short-term overextension. While the trend strength is maximum (ADX at 30.24 with +DI at 35.87 vs -DI at 7.09), the overbought signals suggest that Monday could open with a brief pullback before resuming the uptrend.
- Immediate Resistance: $5,291 (daily R3) → $5,300 (psychological) → $5,324 (4H R3)
- Support Zone: $5,216 (daily R1) → $5,174 (daily pivot) → $5,142 (daily S1)
- Critical Support: $5,099 (daily S2) - a break below this would signal short-term trend exhaustion
Scenarios for Gold Investors
Bullish Scenario (60% probability): Iran retaliates with proxy attacks or missile strikes on U.S. bases, escalating the conflict. Oil spikes above $70, inflation expectations surge, and gold breaks decisively above $5,300 en route to $5,400–$5,500 within the week. In this scenario, gold could test $5,800 by end of March.
Base Case Scenario (30% probability): Iran's interim leadership signals restraint while consolidating power internally. Tensions remain elevated but contained. Gold consolidates between $5,150 and $5,350, with a gradual grind higher as geopolitical risk premium remains embedded in prices. This is the "slow burn" scenario that ultimately benefits patient investors.
Bearish Scenario (10% probability): A rapid diplomatic breakthrough facilitated by Gulf states leads to de-escalation within days. Gold corrects sharply to the $5,000–$5,100 range as the geopolitical premium evaporates. However, even in this scenario, the structural bull case for gold - driven by central bank demand and fiscal deficits - remains intact, making any dip a buying opportunity.
Silver (XAG/USD): The Leveraged Play That Is Stealing the Show
If gold is the safe-haven king, silver is the crown prince with a growth hormone problem. Silver's 6.26% single-day surge is nearly 3.5 times gold's move, which is characteristic of silver's leveraged beta to gold during geopolitical crises. The gold-to-silver ratio has compressed from approximately 60:1 to 56:1 in a single session, a move that silver bulls have been anticipating for months.
Why Silver Is Outperforming
Silver's dual nature as both a precious metal and an industrial commodity creates a unique dynamic during geopolitical crises:
- Safe-haven demand pulls silver higher alongside gold, but silver typically moves with 2–3 times the percentage magnitude due to its smaller market size and greater speculative participation.
- Industrial supply chain fears add another layer of urgency. Iran is not a major silver producer, but the broader supply chain disruptions that a Middle Eastern conflict could trigger - particularly in energy-intensive refining processes - support industrial commodity prices.
- The gold-silver ratio compression trade is now firmly in play. Historically, when the ratio drops from elevated levels during crisis events, silver tends to outperform gold on a percentage basis for weeks or even months. The current ratio around 56:1 still has significant room to compress toward the 45:1–50:1 range that has historically marked crisis peaks.
Silver approaching the psychological $100 mark - a level never seen in modern history - is generating enormous buzz. However, the road from $93.75 to $100 is fraught with profit-taking and psychological resistance.
Bitcoin and Crypto: A Battlefield Between Fear and Opportunity
The cryptocurrency market's response to the Iran crisis has been a masterclass in the ongoing identity struggle of digital assets: are they risk-on speculative instruments, or are they emerging safe havens? The answer, as Friday's price action demonstrated, is both - depending on the timeframe.
The Weekend's Crypto Rollercoaster
The sequence of events was revealing:
Phase 1 - Panic Selloff (Friday, Feb 28): When news of the strikes broke, Bitcoin plummeted from $66,731 to a low of $63,038 - a 5.5% drop that wiped approximately $128 billion from the total crypto market cap within hours. This "shoot first, ask questions later" reaction confirmed that in the initial moments of geopolitical shocks, crypto still behaves like a risk asset.
Phase 2 - Rationalization Rally (Saturday, Mar 1): Once Iranian state media confirmed Khamenei's death, the market narrative shifted dramatically. Traders reasoned that a decapitation of Iran's leadership could accelerate the end of hostilities rather than prolong them. Bitcoin surged to $68,203, recovering all losses and then some. Solana led the recovery with a 10.8% bounce, while Ethereum reclaimed the critical $2,000 level.
Phase 3 - Cautious Consolidation (Sunday, Mar 1): As the weekend progressed, the initial euphoria faded. Bitcoin settled around $66,537, reflecting the market's recognition that while the worst-case scenario (immediate full-scale war) seemed less likely, significant uncertainty remained.
Bitcoin Technical Outlook for Monday
Bitcoin's technical picture is mixed heading into the week. The daily RSI hovers around neutral territory, providing room for movement in either direction. The key battleground is the $64,000–$68,000 range established over the weekend.
- A decisive break above $68,200 (Friday's recovery high) would signal that the market has priced in the geopolitical risk and is ready to resume its uptrend.
- A failure to hold $66,000 could trigger another leg down toward $63,000 or even $60,000.
- Polymarket's 61% ceasefire probability by March 31 suggests weeks of elevated uncertainty - a period during which Bitcoin could oscillate violently within the $60,000–$72,000 range.
Ethereum and Altcoins: The Beta Play
Ethereum's position at $1,986 - tantalizingly close to the psychologically important $2,000 level - makes it a critical bellwether for altcoin sentiment. A sustained break above $2,000 would likely trigger a broader altcoin rally, as capital flows down the risk curve. Conversely, a rejection at $2,000 and a Bitcoin move below $64,000 could trigger significant altcoin pain, with smaller tokens potentially losing 15–25% within days.
The Oil–Gold–Dollar Nexus: Understanding the Interconnections
No analysis of a Middle Eastern crisis would be complete without examining the critical interplay between oil, gold, and the U.S. dollar:
- Oil (Brent at $65.73, WTI at $67.38): Energy prices are the transmission mechanism through which Middle Eastern geopolitics reach global consumers. Every $10 increase in oil prices adds approximately 0.4% to global inflation. If Brent were to spike above $80 due to Hormuz disruption fears, the inflationary impulse would be enough to delay central bank rate cuts - a scenario that is profoundly bullish for gold and potentially bearish for crypto.
- U.S. Dollar Index (DXY at 97.32, -0.14%): The dollar is weakening modestly, which is supportive for both gold and crypto (both are priced in dollars). A continued DXY decline toward 96 would provide additional tailwinds for precious metals.
- S&P 500 (6,871.77, -0.29%): Equity markets closed Friday with modest losses, suggesting that the full impact of the Iran crisis has not yet been priced into stocks. Monday's opening could see a much sharper reaction, particularly in energy, defense, and travel sectors.
Strategic Recommendations for the Week of March 2, 2026
For Gold and Silver Investors
- Position Management: If you are already long gold and silver, this is not the time to take profits. The geopolitical premium is likely to persist for weeks, not days. Consider tightening stop-losses to protect against a sudden diplomatic breakthrough. For gold, a stop-loss at $5,099 (daily S2) provides a reasonable floor. For silver, $85 offers similar protection.
- New Entries: Wait for the Monday opening and the first 60–90 minutes of trading to assess the gap direction. If gold gaps up but fails to break $5,300, a pullback toward $5,200 would be an attractive entry. If silver retraces toward $88–$90, the risk-reward is compelling for a move toward $100.
- Hedge Consideration: Gold miners (GDX) and silver miners (SIL) typically provide 2–3x leverage to underlying metal prices during sustained uptrends. However, broader equity market weakness could dampen mining stock performance, so physical or ETF exposure may be preferable for pure geopolitical plays.
For Crypto Investors
- Risk Management Is Paramount: The crypto market will likely experience extreme volatility on Monday and throughout the week. Use position sizing that accounts for potential 10–15% intraday swings. This is not the week for leverage.
- Range-Bound Strategy: Consider buying Bitcoin near $64,000–$65,000 with a stop at $62,000, and taking partial profits near $68,000–$69,000. This range-bound approach is better suited to the current uncertainty than a directional bet.
- Watch the Ceasefire Odds: Polymarket and other prediction markets will serve as leading indicators for crypto direction. Any significant increase in ceasefire probability will likely trigger a sharp crypto rally.
- Ethereum as a Leverage Play: If you believe the crisis will be resolved within weeks, Ethereum's proximity to $2,000 makes it an attractive leveraged bet on a resolution. A ceasefire-driven rally could push ETH to $2,200–$2,400 relatively quickly.
What History Tells Us About Geopolitical Shocks and Markets
For perspective, it is worth examining how markets have historically responded to comparable events:
- Soleimani Assassination (January 2020): Gold spiked 3.5% in the first session, reaching $1,611, before settling into a sustained uptrend that eventually carried it to $2,075. The initial volatility lasted approximately two weeks.
- Russia-Ukraine War (February 2022): Gold surged from $1,900 to $2,070 in three weeks. Oil spiked above $130. Bitcoin initially dropped 8% before recovering over the following month.
- The Current Crisis: With gold already at $5,280 and silver at $93.75, the starting point is dramatically higher than previous crises. This suggests that while the percentage moves may be smaller, the absolute dollar moves will be significant. A 5% gold rally from here means $264 per ounce - more than the entire Soleimani-era spike in dollar terms.
Conclusion: Prepare for Volatility, Position for Opportunity
The assassination of Iran's Supreme Leader is the most significant geopolitical event for financial markets since the Russian invasion of Ukraine. The coming week will test every investor's discipline, risk management, and conviction.
For precious metals investors, the structural case has never been stronger. Gold and silver are not merely reacting to a geopolitical shock - they are responding to a fundamental shift in global risk perception that has been building throughout 2025 and 2026. Central bank accumulation, de-dollarization, fiscal deficits, and now a major Middle Eastern crisis create a confluence of factors that support significantly higher prices.
For crypto investors, the picture is more nuanced. Bitcoin's maturation as a potential safe-haven asset is being tested in real-time, and the results are mixed. The asset class remains correlated to risk appetite in the short term but shows increasing resilience during geopolitical events compared to previous cycles.
One thing is certain: the markets that open on Monday, March 2, 2026, will not be the same markets that closed on Friday. The only question is whether you are positioned to turn this volatility into opportunity.
This analysis is for educational purposes only and does not constitute financial advice. All investments carry risk, and past performance is not indicative of future results. Readers should conduct their own research and consult with qualified financial advisors before making investment decisions.
Track markets in real-time
AI-powered analysis, technical indicators and real-time price data.
Join Our Telegram Channel
Breaking market news, AI analysis and trading signals instantly.
Join Channel