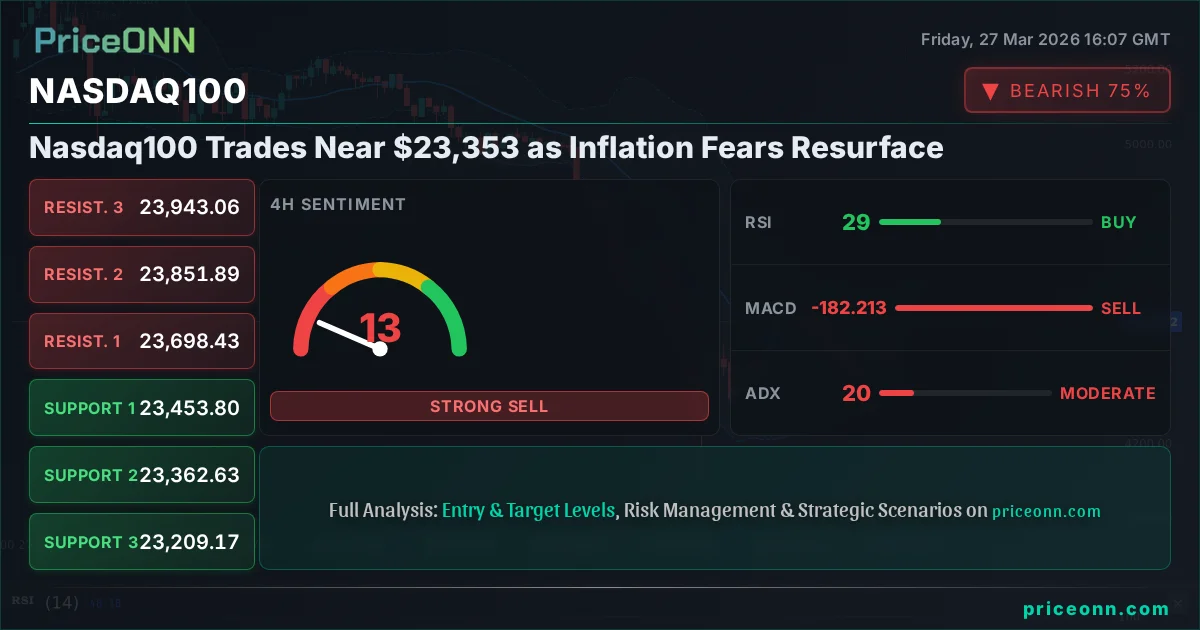
The Nasdaq 100 is currently navigating a critical juncture, trading near the $23,353.19 mark. This isn't just another price point; it's a level where conflicting market forces are battling for control. On one side, we have the persistent drumbeat of inflation fears, amplified by recent economic data that suggests the Federal Reserve might be forced to reconsider its dovish stance. On the other, the relentless march of technology and innovation, which has been the bedrock of this index's impressive run. Having tracked the Nasdaq 100 through the volatile landscape of the past year, I've learned that these periods of uncertainty often precede significant market shifts. The current technical readings, combined with the shifting macroeconomic narrative, suggest that traders need to be exceptionally vigilant. This analysis delves into the data, dissecting the signals to understand what might be driving the Nasdaq 100 and where it could head next.
- The Nasdaq 100 is trading near $23,353.19, a critical level amid mixed market signals.
- RSI at 28.7 on the 1H chart indicates oversold conditions, potentially offering a short-term bounce opportunity.
- Key support is identified at $23,259.15, with a close below this level signaling further downside pressure.
- Resurfacing inflation fears and a potential Fed rate hike are increasing correlation with the DXY, currently at 99.84.
Navigating the Inflationary Storm
The economic calendar has recently delivered data that's sending ripples of concern through the market. The latest figures show [USD] PMI data coming in at 52.4, exceeding the forecast of 51.5 and the previous reading of 51.6. This isn't just a minor uptick; it signals a more robust expansion in the services sector than anticipated. While strong economic activity is generally positive, in the current climate, it feeds directly into inflation worries. When demand is this strong, businesses often have more pricing power, leading to higher costs for consumers. This inflationary pressure puts the Federal Reserve in a difficult position. Their mandate is to maintain price stability, and if inflation proves more stubborn than expected, they may be forced to abandon plans for rate cuts and even consider rate hikes, a scenario traders are now pricing in with a 52% chance by year-end, according to market sentiment.
This shift in Fed expectations is a significant headwind for growth-oriented assets like the Nasdaq 100. Higher interest rates increase borrowing costs for companies, potentially slowing down expansion and innovation, which are the very engines driving tech valuations. Furthermore, higher rates make fixed-income investments more attractive, drawing capital away from riskier assets. The correlation between the Nasdaq 100 and the US Dollar Index (DXY) becomes particularly important here. With the DXY currently at 99.84 and showing a strong upward trend on multiple timeframes, a strengthening dollar typically puts pressure on global equities as foreign capital flows into the US in search of higher yields. This dynamic is a crucial piece of the puzzle for understanding the Nasdaq 100's current predicament.
Technical Crossroads: Support Under Pressure
Looking at the Nasdaq 100's charts, the technical picture is equally compelling, albeit concerning for bulls. On the 1-hour timeframe, the index is trading at $23,353.19, with the Relative Strength Index (RSI) at a very telling 28.7. This places it firmly in oversold territory, a reading that historically can precede a short-term bounce. However, we must tread carefully. An oversold RSI doesn't automatically signal a buy; it simply indicates that selling momentum has been strong and might be due for a pause. The MACD histogram is negative, confirming the current downward momentum, and the MACD line is below its signal line, reinforcing the bearish short-term outlook. The ADX at 34.12 on this timeframe also highlights a strong downtrend, suggesting that any bounce might be a counter-trend move rather than a sustained reversal.
The 4-hour chart paints a similar, if not more bearish, picture. The Nasdaq 100 is hovering above key support at $23,259.15. A decisive break below this level would be a significant bearish signal, potentially triggering further liquidations and pushing the index towards the next support at $23,197.31. The RSI here is at 29.17, still deeply oversold, while the MACD continues to show negative momentum. The ADX on the 4-hour chart is at 20.35, indicating a strong downtrend is in play. It's crucial to note that while the 1-hour and 4-hour charts show clear bearish signals and oversold conditions, the daily timeframe presents a slightly different narrative, which we'll explore next. This multi-timeframe analysis is essential for understanding the immediate versus the longer-term potential moves.
The Daily Chart's Divergent Signal
While the short-term technicals are flashing red for the Nasdaq 100, the daily chart offers a glimmer of hope, or at least a reason for caution against immediate bearish bets. The index closed yesterday below the 200-day moving average, a significant technical event that often signals a shift in the longer-term trend. Currently trading at $23,353.19, the daily RSI stands at 30.94. While not as extreme as the shorter timeframes, this is still within the lower range of the neutral zone, suggesting that the selling pressure might be nearing exhaustion on a daily basis. The MACD on the daily chart is negative, but the histogram is narrowing, which could hint at a potential slowdown in the bearish momentum. The ADX on the daily chart is a robust 44.94, confirming a strong downtrend is in place, but this strength in the downtrend itself can sometimes lead to sharp reversals when momentum shifts.
The key takeaway from the daily chart is that while the trend is undeniably down, the conditions are maturing for a potential technical bounce. This is where market participants need to differentiate between a short-term trading opportunity and a longer-term trend reversal. The Stochastic Oscillator on the daily chart shows K=17.3 and D=30.08, indicating a bearish signal as %K is below %D, but both are in oversold territory. This confluence of oversold conditions on shorter timeframes and a strong, but potentially maturing, downtrend on the daily chart creates a complex trading environment. It means that while the path of least resistance appears to be lower in the immediate term, the risk of a sharp, short-covering rally increases as we approach key support levels like $23,150.20.
Correlations and Macro Drivers: DXY and Oil's Influence
The Nasdaq 100 doesn't trade in a vacuum. Its movements are deeply intertwined with broader market forces, chief among them the US Dollar Index (DXY) and oil prices. The DXY is currently at 99.84, showing a strong upward trend across all analyzed timeframes. This strength is largely driven by the renewed focus on inflation and the possibility of the Fed tightening policy. As the dollar strengthens, it makes US assets more expensive for foreign investors, potentially dampening demand for equities like those in the Nasdaq 100. The correlation is clear: a rising DXY often coincides with pressure on global risk assets. This makes monitoring the DXY's trajectory absolutely critical for anyone trading the Nasdaq 100.
Meanwhile, oil prices, particularly Brent crude at $108.01 and WTI at $98.39, are surging. This rise is fueled by geopolitical tensions and strong demand, as evidenced by the high ADX values on the daily charts (62.51 for Brent, 57.15 for WTI), indicating powerful uptrends. Rising oil prices have a dual impact. Firstly, they are a significant component of inflation, further pressuring central banks to act. Secondly, they increase operating costs for many companies, especially in the technology sector which relies on global supply chains and transportation. While some energy stocks might benefit, the broader inflationary impact and potential for slower economic growth can weigh heavily on the Nasdaq 100. This interplay between a strengthening dollar and rising energy prices creates a challenging environment, signaling increased volatility and a need for careful risk management.
Sector Spotlight: Tech's Resilience Tested
Within the Nasdaq 100, the performance of individual technology sectors is crucial. While the index as a whole is facing headwinds, certain sub-sectors might be showing relative strength or weakness that offers clues to future direction. Semiconductor stocks, for instance, have been a bellwether for the tech industry. However, the current data doesn't provide specific sector breakdowns, forcing us to infer based on broader market trends. Typically, a risk-off environment disproportionately impacts high-growth tech companies, particularly those with high valuations and less established profitability. Companies reliant on significant capital expenditure or consumer discretionary spending are often the first to feel the pinch when interest rates rise or economic growth slows.
The recent sharp declines in the S&P 500 (currently at 6424.05) and the Nasdaq 100 itself, with daily ADX values around 47.43 and 44.94 respectively, suggest a broad market selloff rather than sector-specific weakness. This indicates that investor sentiment has soured considerably, leading to a flight from riskier assets across the board. The fact that the Nasdaq 100 is trading near its support levels implies that institutional investors are either re-evaluating their positions or looking for specific entry points amidst the volatility. The upcoming earnings season will be critical in determining which companies can weather this storm and which might falter, providing a clearer picture of sector-specific resilience.
The Fed's Tightrope Walk: Inflation vs. Growth
The Federal Reserve finds itself walking a very fine line. The latest economic data, particularly the stronger-than-expected PMI figures, presents a dilemma. On one hand, the labor market is showing signs of balance, which might suggest that the economy can withstand tighter monetary policy without a severe recession. The fact that [USD] Nonfarm Payrolls data, though not explicitly detailed here with actuals, is expected to show a controlled environment, supports this view. However, the persistent inflationary pressures, exacerbated by rising energy costs and strong consumer demand, cannot be ignored. If the Fed believes inflation is becoming entrenched, they will prioritize price stability over growth concerns, even if it means risking a harder economic landing.
The market's reaction to this uncertainty is palpable. Treasury yields, which are not explicitly provided but are implicitly linked to Fed policy expectations, are likely experiencing volatility. A hawkish shift from the Fed would typically lead to rising yields, increasing the cost of capital for businesses and investors alike. This environment makes it incredibly challenging for growth stocks, which often rely on future earnings that are heavily discounted by higher interest rates. The Nasdaq 100, being heavily weighted towards technology and growth companies, is particularly sensitive to these policy shifts. The coming weeks, especially with any further economic data releases or Fed commentary, will be crucial in shaping expectations and, consequently, market direction.
Trading Scenarios for the Nasdaq 100
Bearish Scenario: Downside Momentum Continues
65% ProbabilityNeutral Scenario: Consolidation Near Support
25% ProbabilityBullish Scenario: Short-Covering Rally
10% ProbabilityFrequently Asked Questions: Nasdaq100 Analysis
What happens if Nasdaq100 breaks below $23,259.15 support?
A close below the key support level of $23,259.15 on the 1-hour chart would invalidate any immediate bullish hopes and likely trigger further downside momentum. This could pave the way for a test of the $23,197.31 level, as indicated in our bearish scenario.
Should I buy Nasdaq100 at current levels near $23,353.19 given the RSI at 28.7?
While the RSI at 28.7 on the 1H chart suggests oversold conditions, it's not a direct buy signal in the current strong downtrend. A more prudent approach would be to wait for confirmation, such as a hold above $23,259.15 and signs of bullish divergence, before considering a short-term long position. The risk of catching a falling knife is significant.
Is the MACD histogram showing negative momentum a sell signal for Nasdaq100 right now?
The negative MACD histogram confirms the current bearish momentum on shorter timeframes. While it supports the downside pressure, it's crucial to consider it alongside other indicators. On the daily chart, the histogram is narrowing, hinting that the selling pressure might be easing, which could lead to a temporary bounce rather than a sustained trend change.
How will resurfacing inflation fears affect Nasdaq100 this week?
Resurfacing inflation fears, coupled with strong PMI data at 52.4, increase the probability of the Fed maintaining a hawkish stance or even hiking rates. This directly impacts the Nasdaq 100 by raising borrowing costs and making growth stocks less attractive compared to yields. Expect continued volatility and pressure on the index until inflation data provides clearer direction.
Track markets in real-time
AI-powered analysis, technical indicators and real-time price data.
Join Our Telegram Channel
Breaking market news, AI analysis and trading signals instantly.
Join Channel