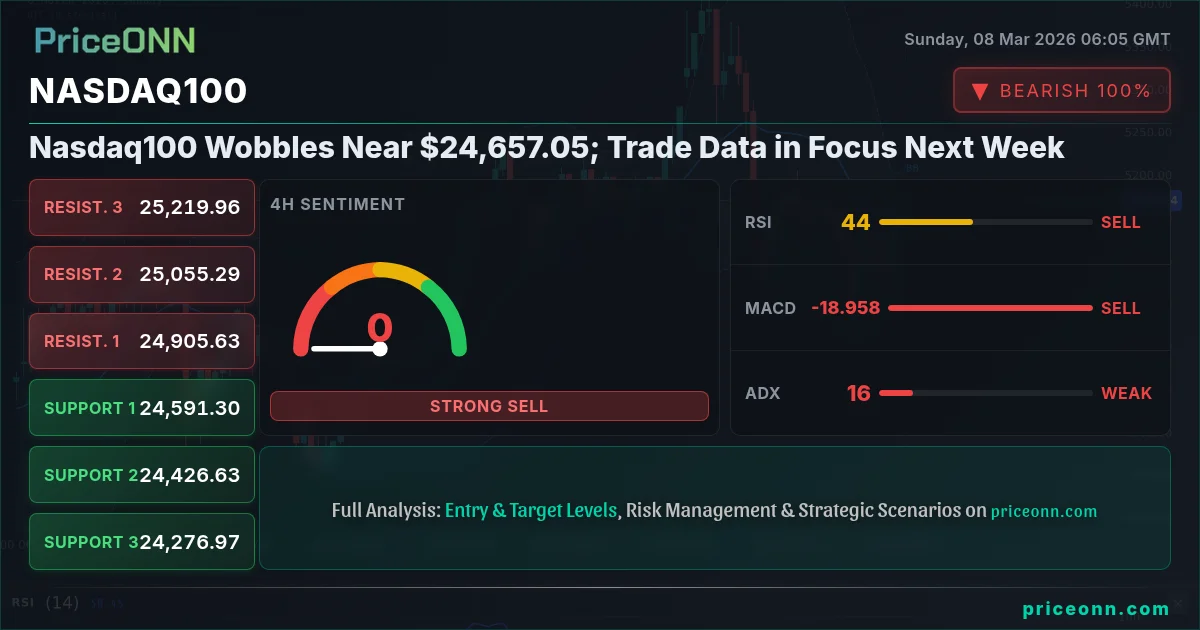
Is the Nasdaq100 poised for a breakout, or is it setting up for a deeper correction? Having tracked the Nasdaq100 through various market cycles, my take is that we're currently in a consolidation phase near $24,657.05, but the lack of clear direction this past week suggests traders are awaiting a fresh catalyst. Why is Nasdaq falling today? The answer lies in the confluence of factors, from mixed economic data to geopolitical uncertainty. Let's dive into the key levels and potential scenarios to watch.
- RSI at 43.95 suggests further downside potential if bearish momentum continues.
- Critical support level to watch sits at $24,734.19, tested multiple times this week.
- MACD histogram shows positive momentum, but the signal is weak, requiring confirmation.
- Upcoming trade data releases are expected to drive Nasdaq100 correlation with the DXY.
Last Week's Nasdaq100 Performance: A Sideways Shuffle
Last week saw the Nasdaq100 essentially trading sideways, bouncing between $24,576.28 and $25,104.43. This lack of clear direction is somewhat surprising, given the underlying strength we've seen in tech earnings and the overall economic recovery narrative. However, the U.S. Weekly Economic & Financial Commentary released on March 7th, highlighting a slip in nonfarm payrolls by 92K, likely contributed to investor caution. The index closed last Friday near $24,657.05, a level that now acts as a crucial pivot point.
Looking back at PriceONN's weekly analysis, the recurring theme has been the tug-of-war between growth optimism and inflation concerns. The market is clearly pricing in the expectation of continued economic expansion, but the fear of rising interest rates and tighter monetary policy is keeping a lid on any significant upside. This is a classic 'wait and see' scenario, where traders are hesitant to commit to a firm directional bias until more data becomes available.
Key Technical Levels to Watch
From a technical perspective, the Nasdaq100 is currently caught between key support and resistance levels. The first level of support lies at $24,734.19. A break below this level could open the door for a test of the $24,500.22 support, followed by $24,266.61. On the upside, immediate resistance is seen at $25,201.77, followed by $25,435.38 and $25,669.35. These levels are derived from a combination of Fibonacci retracements, prior swing highs and lows, and psychological round numbers. For scalpers, these levels offer short-term trading opportunities, while swing traders will be watching for a sustained break above or below these zones to establish a longer-term position.
The RSI(14) currently sits at 43.95, indicating that the index is neither overbought nor oversold. This neutral reading suggests that the market could move in either direction, depending on the catalyst. However, the MACD histogram is showing positive momentum, albeit weak, suggesting that the bulls may have a slight edge. The ADX, however, reads 26.76, indicating a strong downtrend. This divergence in signals suggests that caution is warranted, and traders should wait for confirmation before taking a position.
Analyzing Nasdaq100 with Multi-Timeframe Analysis
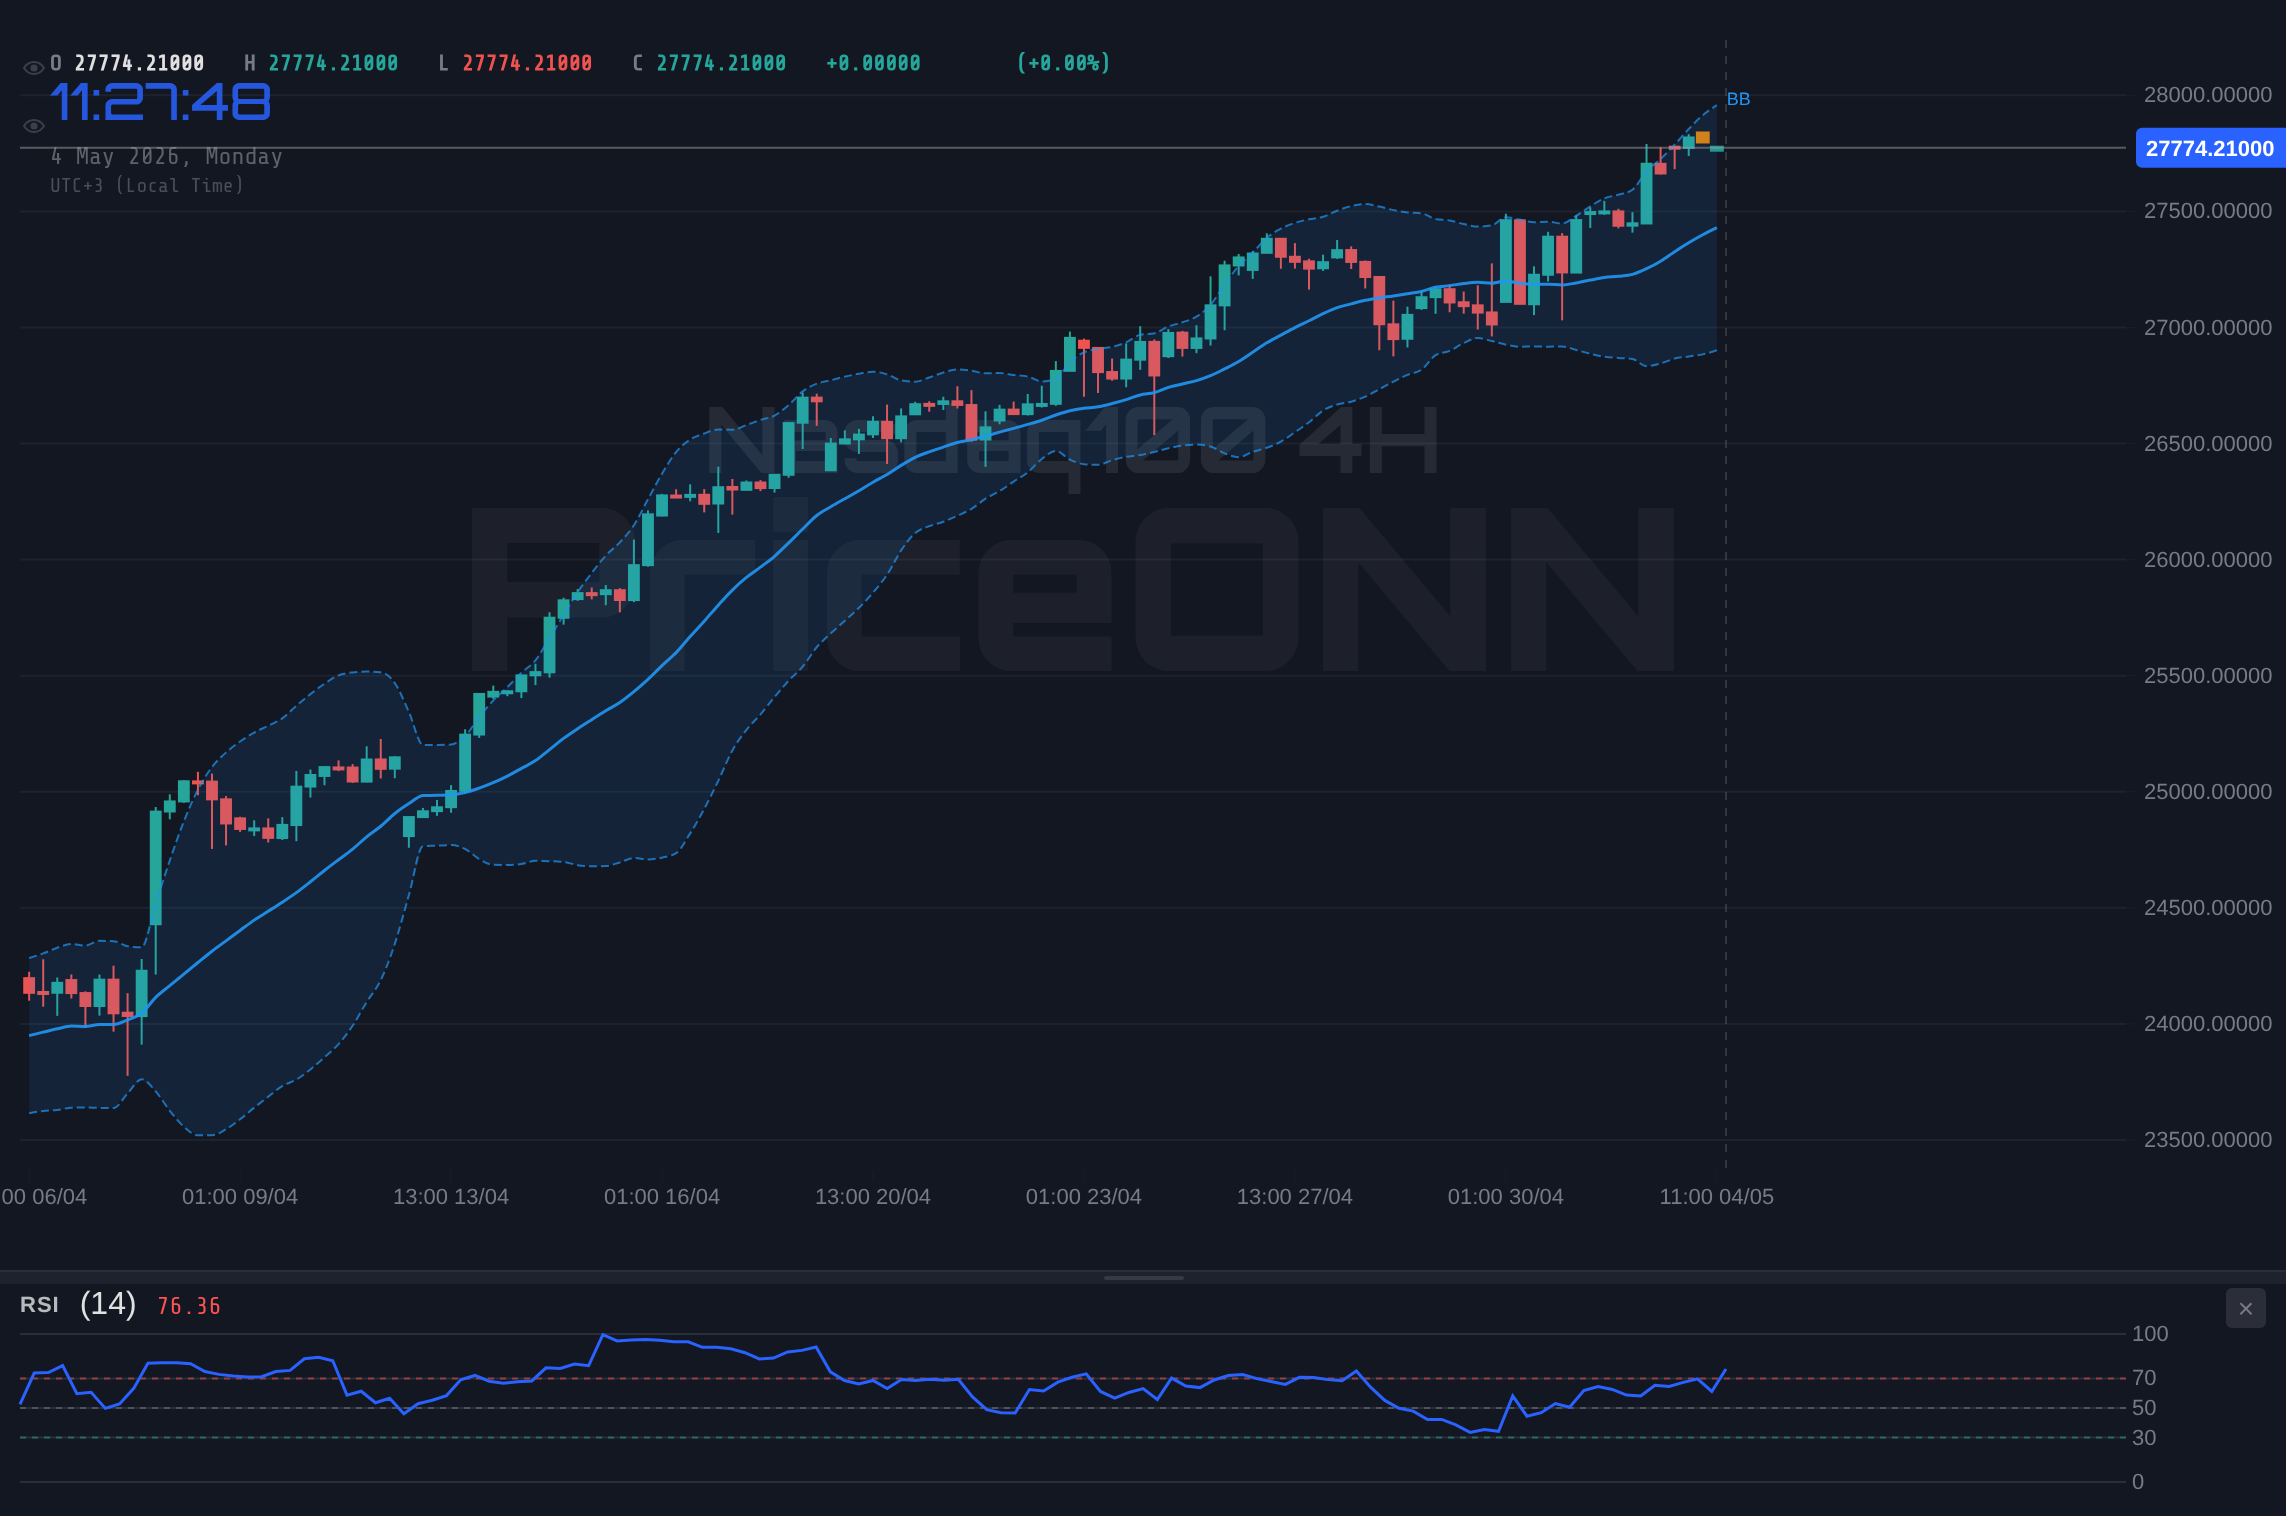
To gain a clearer perspective, a multi-timeframe analysis is essential. On the 1-hour chart, the trend is neutral, with support at $24,725.45 and resistance at $24,842.14. The 4-hour chart also shows a downtrend, with support at $24,479.91 and resistance at $24,839.44. The daily chart paints a more mixed picture, with the index currently trading below its 50-day moving average but above its 200-day moving average. This multi-timeframe analysis underscores the current indecision in the market and highlights the need for patience. The key is to identify a confluence of signals across multiple timeframes before committing to a trade.
Next Week's Expectations: Trade Data in the Spotlight
Looking ahead to next week, the focus will be on upcoming trade data releases. These releases are expected to provide crucial insights into the health of the global economy and could significantly impact the Nasdaq100. Any positive surprises in trade data could fuel a rally in the index, while negative surprises could trigger a sell-off. Remember, the market hates uncertainty, and these data releases will help to reduce that uncertainty and provide a clearer directional bias.
Specifically, keep an eye on the JPY data on Monday, March 9th, and the USD data on Tuesday, March 10th. These releases could impact the DXY and, in turn, influence the Nasdaq100. According to Reuters, Fed officials are closely monitoring these data releases to gauge the strength of the economic recovery and to determine the appropriate course for monetary policy. The market is currently pricing in a high probability of continued rate hikes, but any signs of economic weakness could force the Fed to reconsider its stance.
The recent oil crisis, triggered by Middle East tensions as reported by Forex News outlets, is also a factor to consider. A surge in oil prices could lead to higher inflation, which could, in turn, put pressure on the Fed to raise interest rates more aggressively. This could negatively impact the Nasdaq100, as higher interest rates tend to weigh on growth stocks.
AI Technical Analysis and Chart Pattern Recognition
AI technical analysis tools are increasingly being used to identify potential trading opportunities in the Nasdaq100. These tools can analyze vast amounts of data and identify chart patterns that humans may miss. For example, AI algorithms can scan for potential breakout patterns, identify key support and resistance levels, and generate trading signals based on a variety of technical indicators. These AI tools offer a supplementary perspective, but the human element of experience and intuition cannot be discounted.
One chart pattern that is currently being flagged by AI algorithms is a potential descending triangle forming on the 4-hour chart. This is generally considered a bearish pattern, suggesting that the index could be poised for a further decline. However, the pattern is not yet confirmed, and traders should wait for a clear break below the lower trendline before taking a short position. A daily close above $25,201.77 would negate this bearish setup and open the door for a test of higher resistance levels.
Trade Recommendation: Watching for the Breakout
Given the current market conditions and the conflicting technical signals, the trade recommendation for the Nasdaq100 is to remain in a WATCH_ZONE. The ADX at 15.18 confirms that the market is choppy and ranging, making any trade plan risky. While the RSI and MACD histogram are aligned, providing a directional signal, the Stochastic indicator is in a tradeable zone, but not at an extreme level. A daily close above $25,201.77 would open the door for a test of the $25,435.38 resistance, while a break below $24,734.19 could lead to a test of $24,500.22. Patience will likely be rewarded here. Manage your risk and wait for your setup - the market always gives a second chance.
Frequently Asked Questions: Nasdaq100 Analysis
Is Nasdaq100 a good buy right now?
With the Nasdaq100 trading near $24,657.05, it's too early to say definitively. The index is in a consolidation phase, and a clearer signal is needed. A break above the $25,201.77 resistance would suggest a bullish opportunity.
What is the Nasdaq100 price forecast for this week?
The Nasdaq100 price forecast for this week hinges on upcoming trade data. A positive surprise could push the index towards $25,435.38, while a negative surprise could trigger a decline towards $24,500.22. The probability of a significant move in either direction is high.
What are the key support and resistance levels for Nasdaq100?
Key support levels for the Nasdaq100 are $24,734.19, $24,500.22, and $24,266.61. Key resistance levels are $25,201.77, $25,435.38, and $25,669.35. Watch these levels closely for potential trading opportunities.
Why is Nasdaq100 falling today?
Nasdaq100 is falling today due to a combination of factors, including profit-taking after a recent rally, concerns about rising interest rates, and geopolitical uncertainties. The slip in nonfarm payrolls may have also contributed to the decline.
Patient investors always find opportunities-the key is waiting for the right moment. The market is cyclical; every downturn plants seeds for the next rally. With disciplined risk management, these choppy waters can be navigated safely.
Track markets in real-time
AI-powered analysis, technical indicators and real-time price data.
Join Our Telegram Channel
Breaking market news, AI analysis and trading signals instantly.
Join Channel