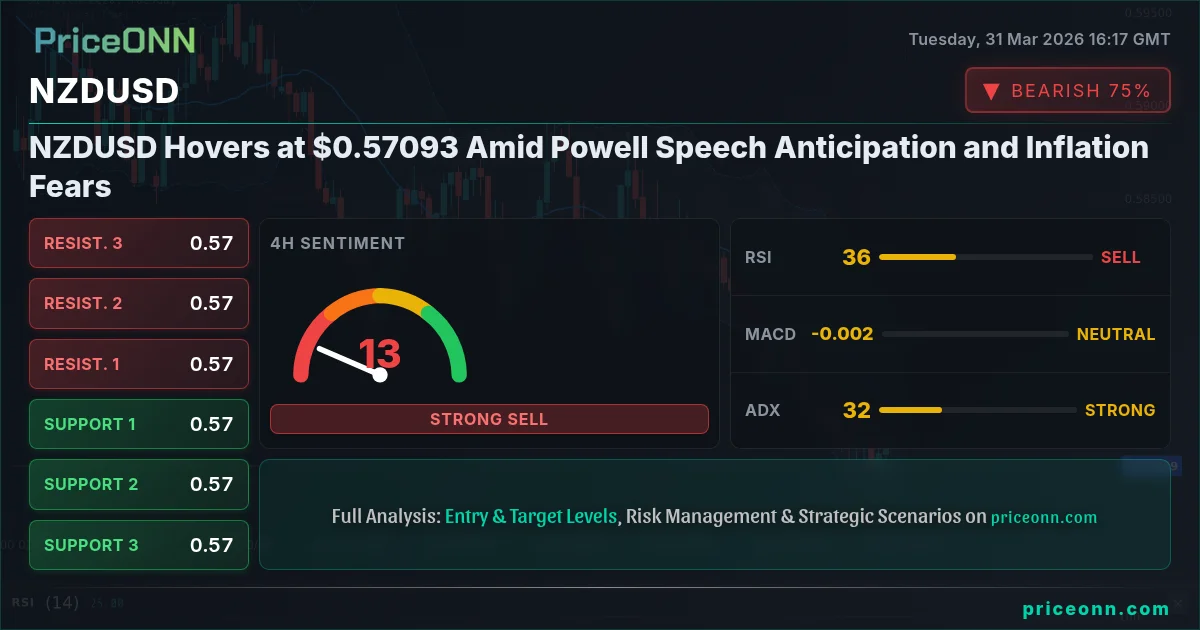
The currency pair NZDUSD is currently navigating a critical juncture, trading at $0.57093, as market participants brace for upcoming commentary from Federal Reserve Chair Jerome Powell and digest resurfacing inflation concerns. This delicate balance between potential policy shifts and persistent price pressures creates a complex landscape for traders seeking clarity. The ongoing tug-of-war between bullish and bearish forces, evident in the mixed signals from technical indicators and the fluctuating correlation with the US Dollar Index (DXY), demands a deep dive into the underlying drivers shaping NZDUSD's immediate future. Understanding the interplay of macroeconomic factors, central bank rhetoric, and technical price action is paramount for any trader looking to navigate this volatile environment effectively. This analysis aims to dissect the current market sentiment, explore the potential scenarios, and provide a data-driven perspective on where NZDUSD might be headed.
- NZDUSD is currently trading at $0.57093, with intraday support identified at $0.56959 and resistance at $0.57265.
- The 1-hour RSI stands at 44.48, indicating a bearish leaning, while the 4-hour RSI at 43.72 suggests a similar trend.
- The DXY (Dollar Index) shows a mixed picture, with a strong 1-day trend (60.79 RSI) but a weaker 1-hour trend (47.75 RSI), impacting USD correlation.
- Anticipation of Fed Chair Powell's speech and lingering inflation fears are key fundamental drivers influencing the pair's direction.
The Bull Case: A Potential Rebound Fueled by Risk Appetite and USD Weakness
On the bullish side, proponents of a NZDUSD recovery point to several factors. Firstly, the recent surge in crude oil prices, with Brent Crude trading at $110.67 and WTI at $104.87, signals underlying inflationary pressures and potential economic resilience, which could indirectly support commodity-linked currencies like the NZD. While higher oil prices typically correlate with inflation, potentially leading to tighter monetary policy and a stronger USD, the current market narrative is complex. If global risk appetite improves, driven by a perceived stabilization of geopolitical tensions or a dovish surprise from Powell, riskier assets could benefit. The 1-hour chart for NZDUSD shows a relatively strong bullish signal (8 A.L, 0 S.A.T), with RSI at 44.48 and Stochastic showing a crossover. Furthermore, the ADX at 22.9 on the 4-hour chart, while indicating a downtrend, is not excessively high, suggesting that the current bearish momentum might not be insurmountable. A key catalyst for a bullish reversal would be a softening tone from Jerome Powell, suggesting a less aggressive path for interest rate hikes or even a pause, which could weaken the US Dollar across the board. Historically, periods of USD weakness often coincide with rallies in currency pairs like NZDUSD, especially if New Zealand's own economic outlook shows signs of improvement or if global sentiment shifts towards risk-on.
The correlation analysis also offers a glimmer of hope for the bulls. While the 1-day DXY trend is strong, the 1-hour and 4-hour charts show weaker momentum or even a bearish leaning. If the DXY falters, particularly if Powell's speech is interpreted as less hawkish than anticipated, it could create an opening for NZDUSD to reclaim higher ground. The current price of $0.57093 is hovering near critical support levels on the 1-hour chart, such as $0.56877. A successful defense of these levels, coupled with positive news flow or a shift in global risk sentiment, could initiate a bounce. For swing traders, watching for a clear break above the immediate 1-hour resistance at $0.57265, supported by increasing volume and improving technical indicators, would be a key signal. Long-term investors might look for a more sustained trend reversal, potentially signaled by a daily close above the 4-hour middle Bollinger Band and a sustained upward move in the daily RSI from its current low of 33.82. The fact that the 4-hour Stochastic is showing a bullish crossover ($K=31.73, D=24.64$) also adds to the potential for a short-term upward move, even within a broader bearish trend. This scenario hinges on external factors and a shift in market psychology, rather than purely domestic New Zealand strength.
The Bear Case: Inflationary Headwinds and USD Strength Loom Large
Conversely, the bearish argument for NZDUSD appears robust, primarily anchored by persistent inflation fears and the potential for a stronger US Dollar. The resurgence of oil prices past $100 per barrel is a significant inflationary driver, not just for the US but globally. This could force central banks, including the Federal Reserve, to maintain a hawkish stance or even tighten policy further, which typically benefits the USD. The 1-day technical picture for NZDUSD is decidedly bearish, with the RSI at 33.82 (a level often associated with oversold conditions but also indicative of strong downward momentum) and the MACD showing negative momentum. The ADX on the daily chart is a formidable 38.95, confirming a strong downtrend. For scalpers and short-term traders, the immediate bearish signals on the 1-hour and 4-hour charts (overall signals lean towards SAT) suggest opportunities to the downside. The 1-hour chart shows RSI at 44.48 and Stochastic indicating a potential dip, while the 4-hour chart presents a similar bearish leaning with RSI at 43.72. The key support level to watch on the 1-hour chart is $0.56877, followed by $0.56729. A break below these levels could trigger further selling pressure, targeting the next significant support on the daily chart at $0.56460.
The correlation with the DXY is also a crucial factor here. The DXY's daily chart exhibits a strong bullish trend (RSI 60.79, ADX 32.94, strong buy signal), suggesting that dollar strength could continue to weigh on NZDUSD. Even if Powell strikes a slightly less hawkish tone, the market might interpret it as a temporary pause rather than a pivot, especially if inflation remains sticky. The recent news regarding the RBA signaling further tightening while New Zealand confidence plunges, as mentioned in the market context, directly impacts the AUD/USD pair and has ripple effects on other commodity currencies. This suggests that the New Zealand economy itself might be facing headwinds, further supporting a bearish outlook for NZDUSD. For longer-term investors, the daily chart's downward trend, coupled with the Stochastic indicator in the oversold zone ($K=6.25, D=23.81$), indicates that while a short-term bounce is possible, the overall trend remains bearish. The ADX reading of 38.95 on the daily chart is particularly concerning, signaling a strong, established downtrend that is unlikely to reverse without significant fundamental shifts or a clear break of major technical resistance levels, such as the 4-hour resistance at $0.57339 or the daily resistance at $0.57458. The prevalence of 'SAT' signals across multiple timeframes reinforces the bearish bias.
The Technical Battleground: Indicators in Conflict
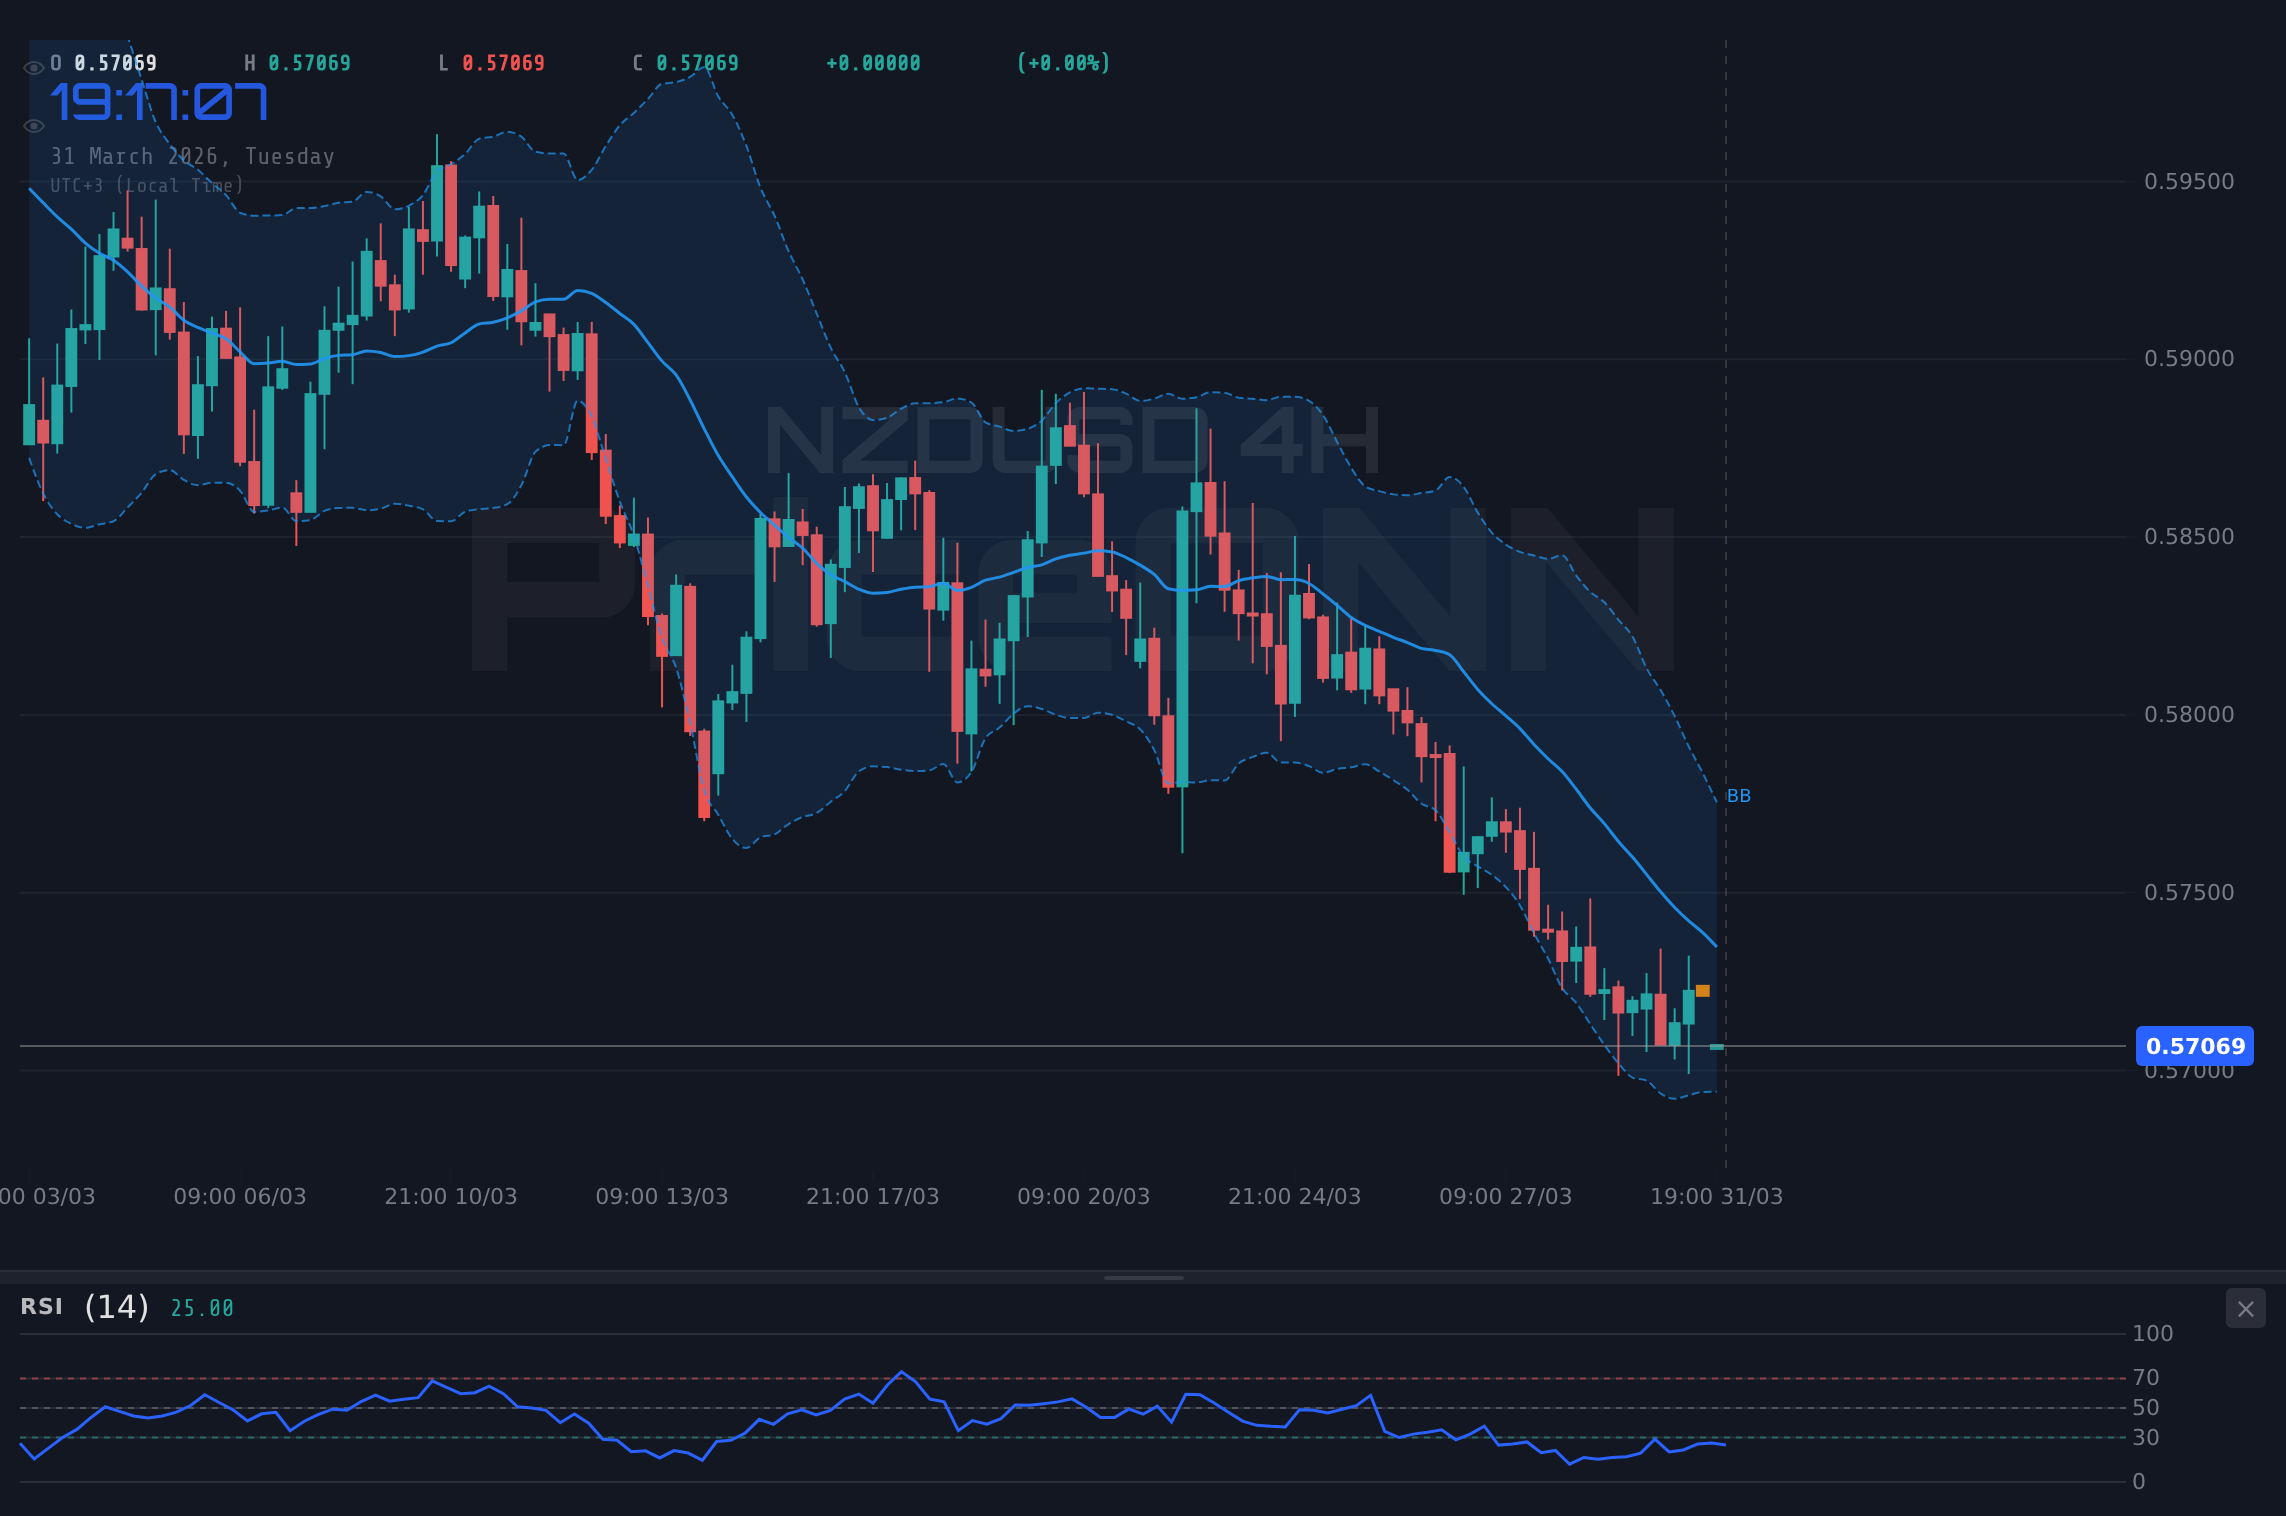
The technical indicators present a conflicting picture, highlighting the current market indecision and the importance of price action around key levels. On the shorter timeframes (1-hour), there are some signs of potential bullish momentum, with the RSI hovering around 44.48 and the Stochastic showing a bullish crossover ($K=46.8, D=51.78$ in 1H AUDUSD, but for NZDUSD 1H it is $K=46.8, D=51.78$ which is bearish). However, this is tempered by the MACD showing negative momentum. The ADX at 22.9 on the 4-hour chart suggests a moderate downtrend, but its lower value compared to the daily ADX (38.95) indicates that the immediate trend strength might be waning, or that the market is consolidating before the next significant move. The Bollinger Bands on the 1-hour and 4-hour charts are above the middle band, indicating upward pressure in the short term, but on the daily chart, they are below the middle band, reinforcing the bearish trend. This divergence between short-term signals and the longer-term daily trend is typical of consolidation periods or the calm before a storm.
The daily chart for NZDUSD paints a clearer bearish picture. An RSI of 33.82 suggests oversold conditions, but in strong downtrends, RSI can remain in oversold territory for extended periods, acting as a momentum indicator rather than a reversal signal. The MACD is firmly in negative territory, and the Stochastic is showing a bearish signal ($K=6.25, D=23.81$). The daily ADX at 38.95 is a strong signal of a well-established downtrend. This implies that any short-term rallies are likely to be met with selling pressure, especially as the price approaches resistance levels like $0.57265 (1H) or $0.57458 (1D). For scalpers, looking for short opportunities on pullbacks towards the 1-hour middle Bollinger Band or on breaks of intraday support could be viable. Swing traders, however, would likely wait for a confirmed break of the daily trend, perhaps signaled by a daily close above the 4-hour resistance at $0.57339 and a subsequent confirmation from other indicators. The conflicting signals across different timeframes underscore the need for traders to define their strategy based on their risk tolerance and time horizon. For instance, a scalper might capitalize on intraday volatility, while a long-term investor would prioritize the daily trend confirmation.
Correlation Analysis: The Dollar, Equities, and Oil's Influence
The movement of NZDUSD is intrinsically linked to broader market dynamics, particularly the US Dollar Index (DXY), equity markets (S&P 500 and Nasdaq 100), and oil prices. The DXY's current state presents a mixed bag: a strong daily uptrend (RSI 60.79) suggests underlying dollar strength, which typically exerts downward pressure on pairs like NZDUSD. However, the 1-hour DXY shows a bearish lean (RSI 47.75, ADX 34.89), indicating potential short-term dollar weakness. This conflicting picture means that the DXY's influence on NZDUSD might be less straightforward in the immediate term. If Powell's speech leans hawkish, it could reinforce the daily DXY trend, pushing NZDUSD lower. Conversely, a dovish surprise could trigger a DXY pullback, offering relief to NZDUSD.
Equity markets, represented by the S&P 500 and Nasdaq 100, are also crucial. Both indices show strong daily downtrends (S&P 500 RSI 35.45, Nasdaq 100 RSI 35.6), suggesting a 'risk-off' sentiment prevails in the broader market. Historically, NZDUSD tends to perform poorly in such environments as investors flock to perceived safe-haven assets. The recent surge in oil prices, with Brent at $110.67 and WTI at $104.87, adds another layer of complexity. While higher oil prices can fuel inflation fears and support a stronger USD (negative for NZDUSD), they can also signal robust global demand or geopolitical supply disruptions, which might indirectly support commodity currencies if risk appetite improves. However, given the current 'risk-off' sentiment in equities, the inflationary aspect of rising oil prices is likely to dominate, potentially leading to continued pressure on riskier assets and currencies like the NZD. The interplay between these correlated assets - a strong daily DXY trend, weak equities, and rising oil - collectively points towards a challenging environment for NZDUSD, reinforcing the bearish outlook from a macro perspective.
Historical Context: Past Performance and Emerging Patterns
Examining historical price action for NZDUSD, especially during periods of Fed policy uncertainty and rising inflation, can offer valuable insights. In previous cycles where inflation surged and the Fed signaled tighter policy, the US Dollar generally strengthened, leading to significant declines in pairs like NZDUSD. For instance, during periods of rising oil prices and geopolitical uncertainty in the past, NZDUSD has often experienced sharp sell-offs as global investors de-risk. The current ADX readings, particularly the strong 38.95 on the daily chart, echo similar strong trend conditions seen in past significant downward moves. When NZDUSD has previously found itself in such a strong downtrend, rallies have often been shallow and short-lived, primarily serving as opportunities for further selling before the main trend reasserts itself. The current RSI level of 33.82 on the daily chart, while technically oversold, has historically persisted in downtrends for weeks, not days. This suggests that even if a short-term bounce occurs, the path of least resistance remains to the downside until fundamental drivers shift significantly or major technical levels are decisively reclaimed.
Furthermore, the correlation with AUD/USD, which is currently facing downward pressure due to RBA hawkishness and NZ confidence plunges, cannot be ignored. NZDUSD often moves in tandem with AUD/USD. If the latter continues to weaken, it increases the probability of NZDUSD following suit. The fact that the New Zealand dollar is sensitive to global commodity prices and investor risk appetite means that sustained 'risk-off' sentiment, as indicated by the weak performance of S&P 500 and Nasdaq 100, is a significant headwind. The current price of $0.57093 is a key psychological level, and a decisive break below it could trigger algorithmic selling and a cascade of stop-loss orders, mirroring past instances where such breaks led to accelerated price declines. Traders should look at how similar setups unfolded in prior years; often, a strong daily ADX coupled with oversold RSI requires a substantial catalyst - like a clear Fed pivot or a significant de-escalation of geopolitical tensions - to reverse the trend. Without such catalysts, historical precedent suggests caution and a bias towards the prevailing trend.
What Different Trader Types Should Watch
For scalpers, the immediate focus is on the 1-hour chart and intraday volatility. They will be closely monitoring price action around the $0.56877 support and $0.57265 resistance. A quick break below $0.56877 could offer a shorting opportunity targeting $0.56729, with a tight stop-loss just above the broken support. Conversely, a strong move above $0.57265, backed by rising volume, might present a quick long scalp targeting $0.57505. The key is rapid execution and tight risk management, as the longer-term trend remains uncertain. They must be wary of 'stop hunts' or liquidity grabs, which are common in choppy markets.
Swing traders will be looking at the 4-hour and daily charts for clearer signals. The current bearish bias on the daily chart (RSI 33.82, ADX 38.95) suggests they should lean towards short positions. They would likely wait for a confirmed break below the 4-hour support at $0.57051, or a failed rally attempt near the 1-hour resistance at $0.57265. A target for a bearish swing trade could be the daily support level at $0.56460. The invalidation point for such a trade would be a decisive close above the daily resistance at $0.57458, which would signal a potential trend change. They need to balance the risk of trading against the prevailing daily trend with the potential for short-term counter-trend moves.
Long-term investors, however, will prioritize the daily trend and fundamental drivers. They are less concerned with intraday fluctuations and more focused on the broader macroeconomic picture. For them, the key is whether the current downtrend is sustainable. They would look for confirmation of a trend reversal, such as a sustained break above the daily resistance at $0.57458, coupled with a shift in Fed policy expectations (e.g., clear signals of rate cuts) and an improvement in global risk sentiment. Until then, they might remain on the sidelines or consider accumulating positions only if the price reaches significantly lower levels, perhaps near the $0.56 level, which could represent a more attractive long-term entry point based on historical support zones. They must also consider the yield differentials between the US and New Zealand, and how central bank divergence could play out over months rather than days.
Navigating the Uncertainty: Powell's Speech and Economic Data
The upcoming speech by Federal Reserve Chair Jerome Powell is the most significant event risk in the near term. Market participants will be dissecting every word for clues about the Fed's stance on inflation and future monetary policy. A hawkish tone, emphasizing the need to combat persistent inflation, could strengthen the US Dollar and push NZDUSD lower, potentially towards the $0.56460 support level. Conversely, any hint of a pivot or a less aggressive approach to rate hikes could weaken the dollar, offering a reprieve for NZDUSD and potentially initiating a short-covering rally towards $0.57458 resistance. The reaction will likely depend on how Powell's comments align with or deviate from current market expectations, which are already pricing in a certain degree of hawkishness due to the oil price surge.
Beyond Powell's speech, upcoming economic data releases will play a crucial role. For New Zealand, any domestic data indicating economic weakness, such as disappointing confidence surveys or inflation figures, would add further pressure on the NZD. Conversely, surprisingly strong employment or GDP numbers could provide some support. On the US side, key inflation indicators (like CPI or PCE) and employment data (NFP) will be closely watched. Higher-than-expected inflation or a robust labor market could reinforce the Fed's hawkish stance, while softer data might lead to a reassessment of rate hike expectations, potentially weakening the USD. The interplay between these domestic and international economic factors, combined with geopolitical developments, will ultimately determine whether NZDUSD breaks its current bearish trend or continues its descent. The market is sensitive to any data that deviates from expectations, so even minor surprises could trigger significant price movements.
Key Scenarios for NZDUSD
Bearish Scenario: Trend Continuation
65% ProbabilityNeutral Scenario: Consolidation and Range Play
25% ProbabilityBullish Scenario: Short-Term Rebound
10% ProbabilityFrequently Asked Questions: NZDUSD Analysis
What happens if NZDUSD breaks below the $0.56877 support level?
A break below $0.56877 on the 1-hour chart would invalidate short-term bullish hopes and likely trigger further selling pressure. This could lead to NZDUSD testing the next daily support at $0.56460, especially if accompanied by hawkish commentary from Fed Chair Powell.
Should I consider buying NZDUSD at current levels of $0.57093 given the daily RSI is 33.82?
Buying solely based on the daily RSI being at 33.82 is risky, as strong downtrends can keep RSI in oversold territory for extended periods. While it signals potential for a short-term bounce, the prevailing daily trend and other indicators suggest caution. A confirmed break of resistance or a shift in Fed policy would be needed for a more reliable long entry.
Is the Stochastic crossover ($K=31.73, D=24.64$ on 4H) a reliable buy signal for NZDUSD?
The Stochastic crossover on the 4-hour chart from $K=31.73, D=24.64$ suggests a potential upward move, but it occurs within a broader daily downtrend (ADX 38.95). This signal is more indicative of a possible short-term bounce or consolidation rather than a confirmed trend reversal. Confirmation from price action and other indicators is crucial.
How might Fed Chair Powell's upcoming speech affect NZDUSD this week, given current inflation fears?
If Powell adopts a hawkish tone, emphasizing the need to combat inflation exacerbated by oil prices, the US Dollar could strengthen, pushing NZDUSD below $0.57093 towards $0.56460. A more dovish stance, however, might weaken the USD and allow NZDUSD to rally towards the $0.57458 resistance level.
The NZDUSD is currently caught in a technical and fundamental crossfire. The strong daily downtrend, coupled with persistent inflation fears and the potential for dollar strength, favors a bearish outlook. However, short-term indicators and the anticipation of Fed Chair Powell's speech introduce an element of uncertainty and the possibility of a temporary rebound. Traders must remain vigilant, adhere to their risk management strategies, and wait for clearer signals before committing significant capital. The market often presents second chances, and patience will be key in navigating these choppy waters.
Track markets in real-time
AI-powered analysis, technical indicators and real-time price data.
Join Our Telegram Channel
Breaking market news, AI analysis and trading signals instantly.
Join Channel