
NZDUSD Tests Key Resistance at $0.5703: Bearish RSI Signals Caution
NZDUSD hovers near $0.5703 with a bearish RSI at 67.3. Multiple timeframes show conflicting signals, but the 1H trend is down.
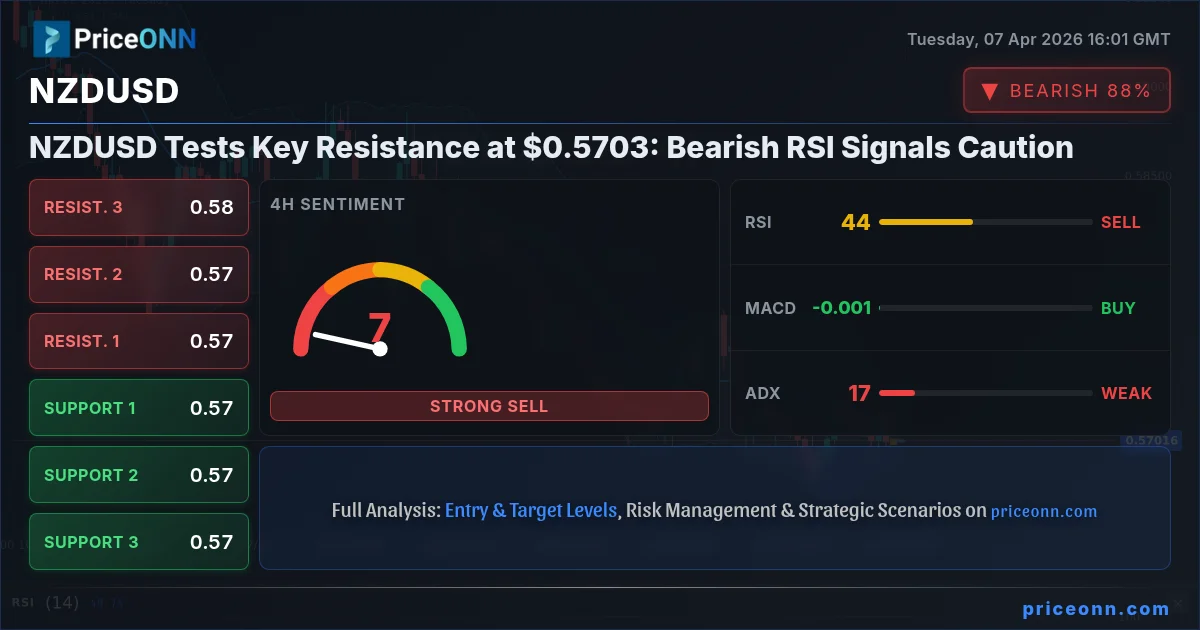
NZDUSD today analysis reveals a critical juncture around the $0.5703 mark. While the pair has shown some upward momentum on shorter timeframes, a deeper look into the technical indicators, particularly the Relative Strength Index (RSI), suggests that the bullish conviction might be waning. This divergence between short-term price action and the underlying momentum is precisely where keen traders find opportunities, but also where risk management becomes paramount. The current price action needs careful dissection to understand if this is a temporary pause before further upside or the beginning of a more significant pullback.
- NZDUSD is trading at $0.5703, facing resistance around the $0.57094 level.
- The 1-hour RSI at 67.3 indicates growing overbought pressure, hinting at potential selling.
- Conflicting signals exist across timeframes, with the 1D trend showing strength (100%) but the 1H trend favoring a downtrend (83%).
- ADX readings across all timeframes (15.36, 16.58, 42.78) suggest weak to strong trend strength, creating a choppy environment.
- Geopolitical tensions and a strengthening DXY at 99.67 add external pressure on the pair.
The New Zealand Dollar against the US Dollar (NZDUSD) is currently navigating a complex technical landscape. At precisely $0.57030, the pair sits at a pivotal point, with immediate resistance looming just above at $0.57094 on the 1-hour chart. This proximity to resistance, coupled with the current market sentiment, warrants a thorough examination of the underlying technical drivers. The interplay between different timeframes, indicator readings, and broader market correlations will be key to deciphering the potential next move.
Looking at the 1-hour timeframe, the trend is decidedly bearish with a strength of 83%, according to our data. This short-term bearish inclination is supported by a confluence of indicators. The RSI(14) stands at 47.25, firmly in neutral territory but exhibiting a downward eğilim. More notably, the Stochastic Oscillator (%K: 21.6, %D: 37.2) is flashing a clear sell signal, with the %K line below the %D line and heading towards oversold conditions. The MACD, while not showing extreme momentum, is below its signal line, reinforcing the bearish undertone on this very short-term view. The ADX at 15.36 confirms what many traders are feeling: a lack of strong directional conviction in the immediate term, suggesting consolidation or a potential reversal.
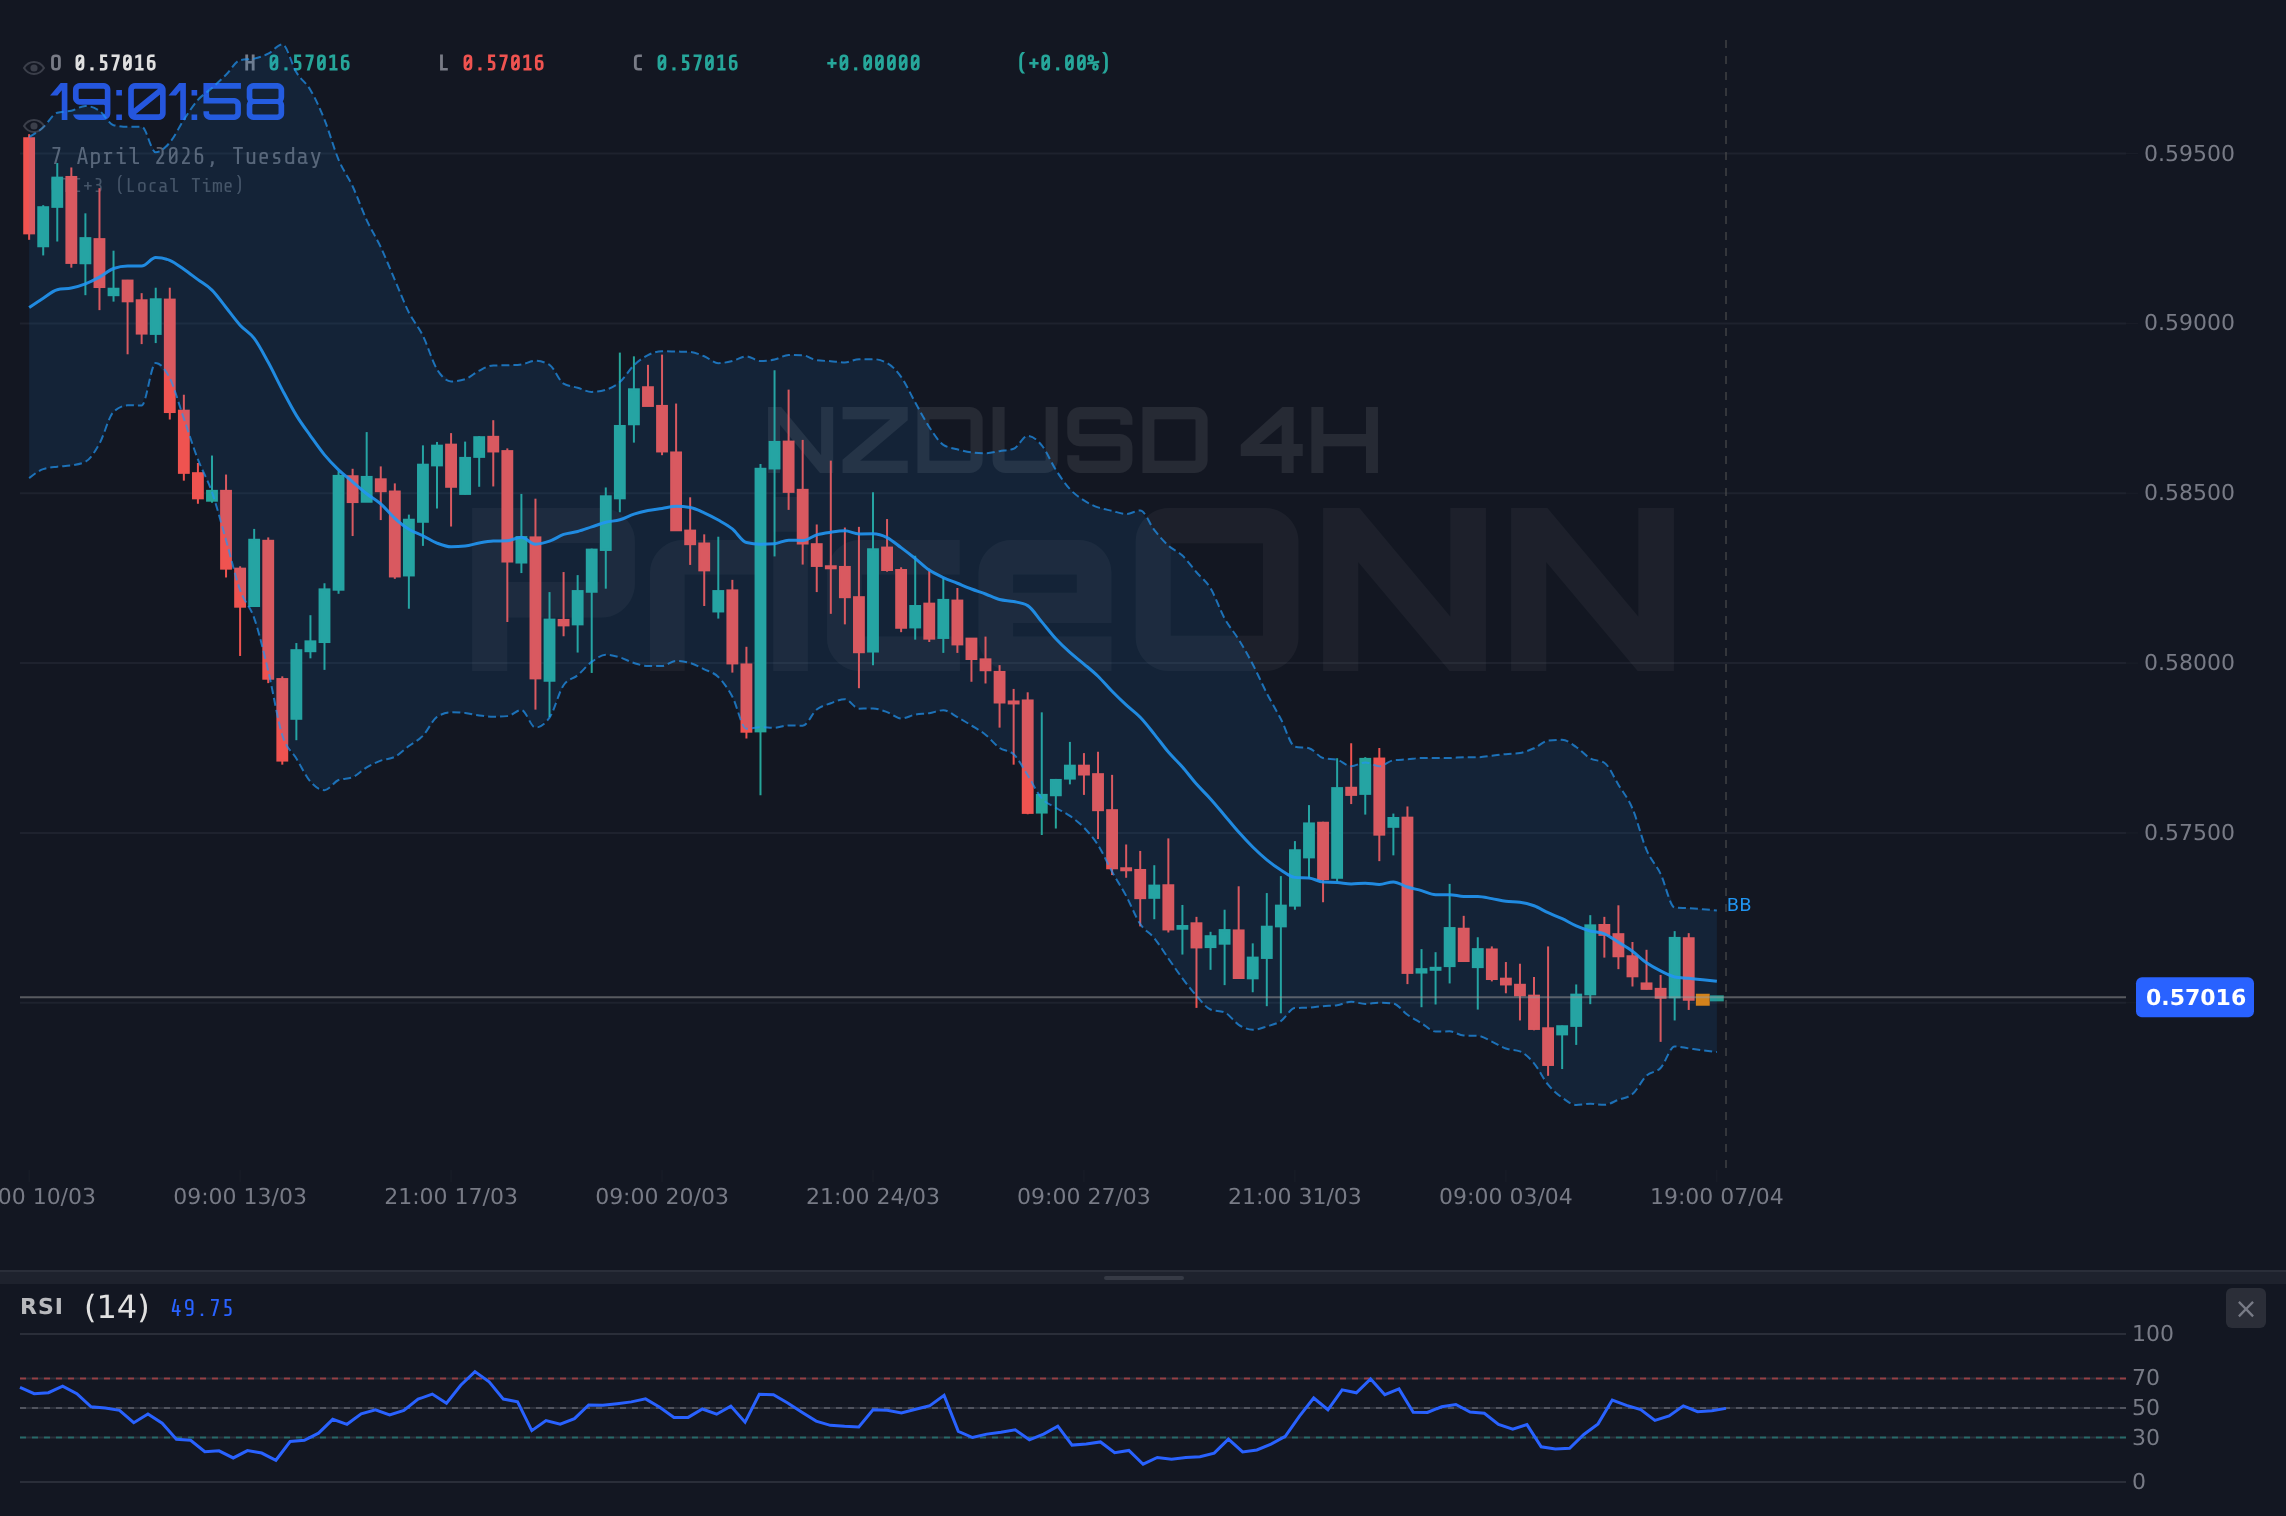
However, the picture becomes significantly more nuanced when we expand our view to the 4-hour chart. Here, the trend is neutral with 50% strength, indicating a balance between buyers and sellers. The RSI(14) sits at 43.75, still in neutral territory and with a downward eğilim, mirroring the 1-hour chart's sentiment. The Stochastic Oscillator (%K: 52.75, %D: 63.2) also presents a sell signal, but it’s in a less extreme position than on the 1-hour chart. The MACD is showing positive momentum, crossing above its signal line, which could be interpreted as a nascent bullish sign. The ADX at 16.58 again points to a weak trend, highlighting the choppy nature of price action over this timeframe. This mixed signal environment suggests that short-term traders might be hesitant, waiting for clearer direction.
The daily timeframe presents an even more compelling narrative, leaning heavily towards a bearish outlook with a trend strength of 100%. The RSI(14) at 36.5 is approaching oversold territory, which, in isolation, could signal a potential buying opportunity for longer-term investors. However, the context is crucial. The MACD is in negative momentum, sitting below its signal line, and the Bollinger Bands show the price hugging the lower band, indicating strong selling pressure. The ADX at 42.78 is a significant figure - it signifies a strong, established downtrend. This robust trend strength on the daily chart suggests that any short-term rallies might be mere corrections within a larger bearish move. The Stochastic Oscillator, with %K at 12.41 and %D at 14.54, is deeply oversold, potentially indicating a short-term bounce is due, but this needs to be viewed against the backdrop of the strong daily downtrend.
The current price of $0.57030 is battling against immediate resistance at $0.57094. On the daily chart, the first significant resistance level stands at $0.57308, followed by $0.57539 and $0.57790. These levels represent key battlegrounds where selling pressure could intensify if price approaches them. Conversely, immediate support is found at $0.56924 on the 1-hour chart, which aligns with the daily support of $0.56826. Further down, we have $0.56858 and $0.56754 on the 1H, and $0.56575 and $0.56344 on the daily. The proximity of current price to these levels, especially the resistance, makes the $0.57030 area a critical zone for short-term traders.
The broader market context cannot be ignored. The US Dollar Index (DXY) is currently trading around 99.67, exhibiting a strengthening trend on the daily chart (ADX 29.17). A rising DXY typically exerts downward pressure on currency pairs like NZDUSD, especially when the New Zealand Dollar is perceived as a riskier asset. The recent news flow also adds to the geopolitical uncertainty. Reports of escalating tensions in the Middle East and concerns about inflation resurfacing in the US could further bolster the dollar's safe-haven appeal, potentially weighing on risk-sensitive currencies like the Kiwi. The strength of the USDJPY pair, pushing towards 160, also indicates a global flight to safety or a yield differential play that could indirectly impact NZDUSD.
The ADX indicator across all timeframes paints an interesting picture. On the 1-hour and 4-hour charts, it's relatively low (15.36 and 16.58 respectively), indicating a weak trend and choppy market conditions. This suggests that breakouts might be prone to failure or false signals. However, the daily ADX at 42.78 is a stark contrast, signaling a very strong downtrend. This discrepancy between short-term choppiness and a strong long-term trend is a classic scenario for range-bound trading or a potential trend continuation after a period of consolidation. Traders must be aware of this conflicting trend strength when formulating their strategies.
Considering the technical signals, the bearish sentiment appears to be building, especially when looking at the confluence of indicators on the 1-hour and daily charts. The RSI at 67.3 on the 1-hour chart, while not yet in extreme overbought territory, is certainly showing upward momentum is losing steam. This is particularly concerning given the strong bearish trend indicated by the daily ADX of 42.78. If NZDUSD fails to decisively break above the immediate resistance at $0.57094 and instead falters, we could see a swift move back towards the support levels. The oversold readings on the daily Stochastic might offer a temporary reprieve, but the prevailing trend strength suggests caution for any bullish bets.
The overall market sentiment, influenced by geopolitical risks and inflation concerns, seems to favor the US Dollar. This external factor adds another layer of pressure on NZDUSD. While the pair might experience short-term fluctuations, the underlying bearish technicals on the daily chart, combined with a strong DXY, suggest that the path of least resistance could be to the downside. Any rally towards higher resistance levels should be viewed with skepticism unless accompanied by a significant shift in momentum and trend strength across multiple timeframes.
The current data suggests a market in flux. The 1-hour chart is showing bearish signals, the 4-hour is mixed, and the daily is strongly bearish despite some oversold indicators. This complexity means that while the immediate outlook might lean bearish, the potential for short-term bounces due to oversold conditions cannot be discounted. Traders should exercise caution and wait for clearer signals or confirmation before committing to a position. The $0.57030 level is a crucial pivot; a failure to hold it could accelerate declines, while a decisive break above resistance might signal a temporary shift.
The recent news about escalating geopolitical tensions, particularly in the Middle East, alongside resurfacing inflation fears in the US, provides a backdrop that typically favors safe-haven assets like the US Dollar. This macro environment could exacerbate any downside pressure on NZDUSD, especially if the Reserve Bank of New Zealand adopts a less hawkish stance compared to the Federal Reserve. While specific economic calendar data for NZD has not been provided, the global macro picture is often a significant driver for commodity-linked currencies.
For scalpers and day traders, the 1-hour chart's bearish signals and resistance at $0.57094 offer potential shorting opportunities, targeting the $0.56924 support. However, the weak ADX on this timeframe suggests tight risk management is essential. Swing traders might look for a breakdown below the $0.56924 support, with the daily chart's strong downtrend (ADX 42.78) providing a potential target towards $0.56826. Long-term investors might be watching the daily oversold Stochastic for a potential reversal, but would likely require confirmation of a sustained uptrend and a weakening DXY before considering positions.
The market is presenting a challenging environment for NZDUSD. The conflicting signals across different timeframes demand a patient and disciplined approach. While the daily chart strongly suggests a bearish trend, the short-term oversold conditions and weak trend strength on lower timeframes could lead to whipsaws. Therefore, focusing on clear price action at key levels and waiting for confirmation from multiple indicators will be crucial for navigating this choppy market. The next few trading sessions will likely determine whether the pair consolidates around $0.57030 or embarks on a more decisive move.
Bearish Scenario: Pullback to Daily Support
65% ProbabilityNeutral Scenario: Range-Bound Consolidation
25% ProbabilityBullish Scenario: Short-Term Bounce
10% ProbabilityFrequently Asked Questions: NZDUSD Analysis
What happens if NZDUSD breaks below the $0.56924 support level?
If NZDUSD breaks below the $0.56924 support, it would confirm the bearish bias indicated by the daily ADX at 42.78. The next target would likely be $0.56826, with further downside risk towards $0.56575 if the selling pressure intensifies. This scenario is supported by the 1-hour bearish trend and the current DXY strength.
Is the RSI at 67.3 on the 1H chart a sell signal for NZDUSD right now?
An RSI of 67.3 on the 1-hour chart suggests that bullish momentum is slowing, and the pair is approaching overbought conditions on this short timeframe. While not an immediate sell signal on its own, it adds to the caution required, especially with resistance at $0.57094. It indicates that further upside might be limited without renewed buying strength.
How might the DXY at 99.67 and geopolitical tensions affect NZDUSD this week?
A DXY strengthening towards 99.67, combined with heightened geopolitical risks, typically favors the US Dollar as a safe-haven asset. This environment puts downward pressure on risk-sensitive currencies like the NZD. If these factors persist, they could reinforce the bearish outlook for NZDUSD, potentially pushing it towards lower support levels.
Should traders consider buying NZDUSD if it bounces from daily oversold Stochastic levels near $0.57030?
A bounce from oversold Stochastic levels near $0.57030 could present a short-term buying opportunity, targeting resistance at $0.57308. However, this bullish thesis is invalidated if price closes below $0.56826. Given the strong daily downtrend (ADX 42.78) and conflicting signals, such a trade carries higher risk and requires tight stop-loss management.
| Indicator | Value | Signal | Interpretation |
|---|---|---|---|
| RSI (14) | 47.25 | Bearish | Neutral territory, downward eğilim. |
| MACD Histogram | Negative | Bearish | Momentum weakening. |
| Stochastic | K=21.6, D=37.2 | Bearish | Sell signal, heading oversold. |
| ADX | 15.36 | Weak Trend | Choppy, lacks conviction. |
| Bollinger | Mid Band Break | Bearish | Price below middle band. |
The path forward for NZDUSD hinges on its ability to decisively break through immediate resistance or succumb to the broader bearish pressures indicated by longer-term trends and market sentiment. The current price action around $0.57030 is a testament to the market's indecision, but the technical indicators, especially on the daily chart, lean towards further downside potential. Traders must remain vigilant, employ robust risk management, and wait for clear signals before entering positions. Patience is key in these choppy conditions; the market will eventually provide the setup, and sticking to a disciplined plan will be the ultimate differentiator.
Track markets in real-time
AI-powered analysis, technical indicators and real-time price data.
Join Our Telegram Channel
Breaking market news, AI analysis and trading signals instantly.
Join Channel