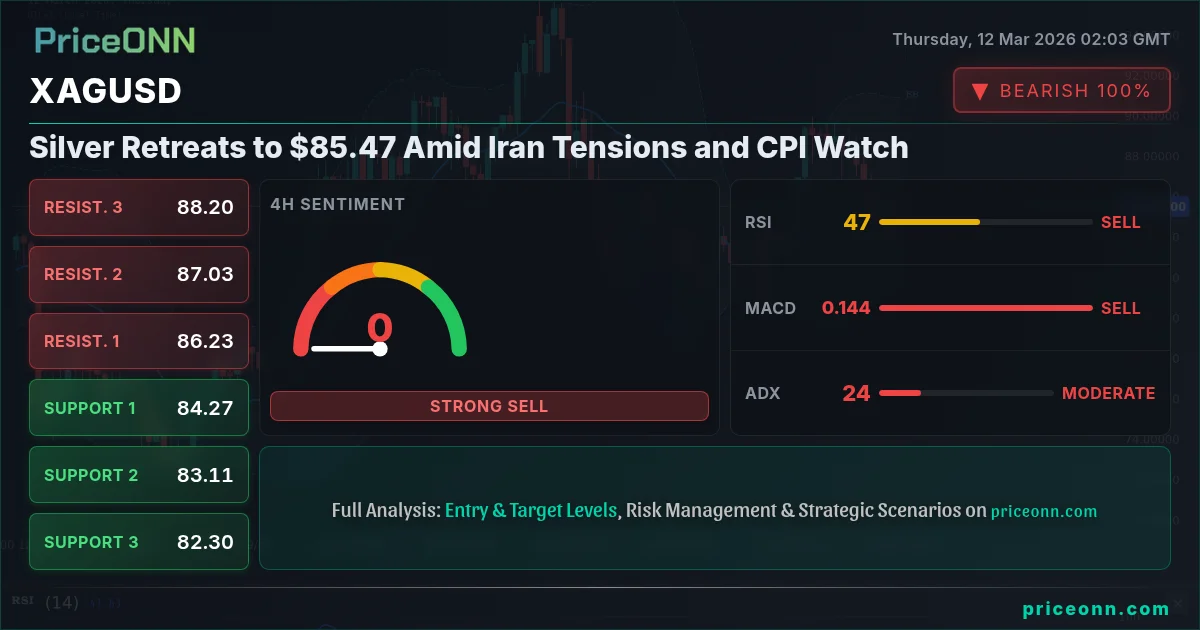
Silver is currently trading around $85.47, facing downward pressure as geopolitical tensions in the Middle East drive oil prices higher, strengthening the dollar. This comes ahead of crucial US CPI data, which could significantly influence the Federal Reserve's monetary policy decisions. The combination of these factors creates a complex landscape for silver traders, demanding careful analysis of both technical and fundamental indicators.
The surge in oil prices, with Brent crude reaching $98.45, is largely attributed to escalating tensions involving Iran, stoking inflation fears and subsequently bolstering the dollar's appeal as a safe-haven asset. As Reuters reports, market participants are closely monitoring developments in the Gulf, anticipating potential supply disruptions that could further exacerbate inflationary pressures. A stronger dollar, as indicated by the DXY currently at 99.13, typically exerts downward pressure on precious metals like silver, making them more expensive for international buyers.
From a technical perspective, the 1-hour timeframe reveals a neutral trend for XAGUSD, with the price hovering around the middle band of the Bollinger indicator. However, the Stochastic oscillator, with K=53.78 and D=44.3, suggests a potential bullish reversal, indicating that the recent sell-off may be losing momentum. The ADX, at 37.83, signals a strong downtrend, so any bullish signals should be viewed with caution. The immediate resistance level to watch is $86.18, while support lies at $84.45. A break above resistance could pave the way for a retest of $86.78, while a breakdown below support could lead to further declines towards $83.31.
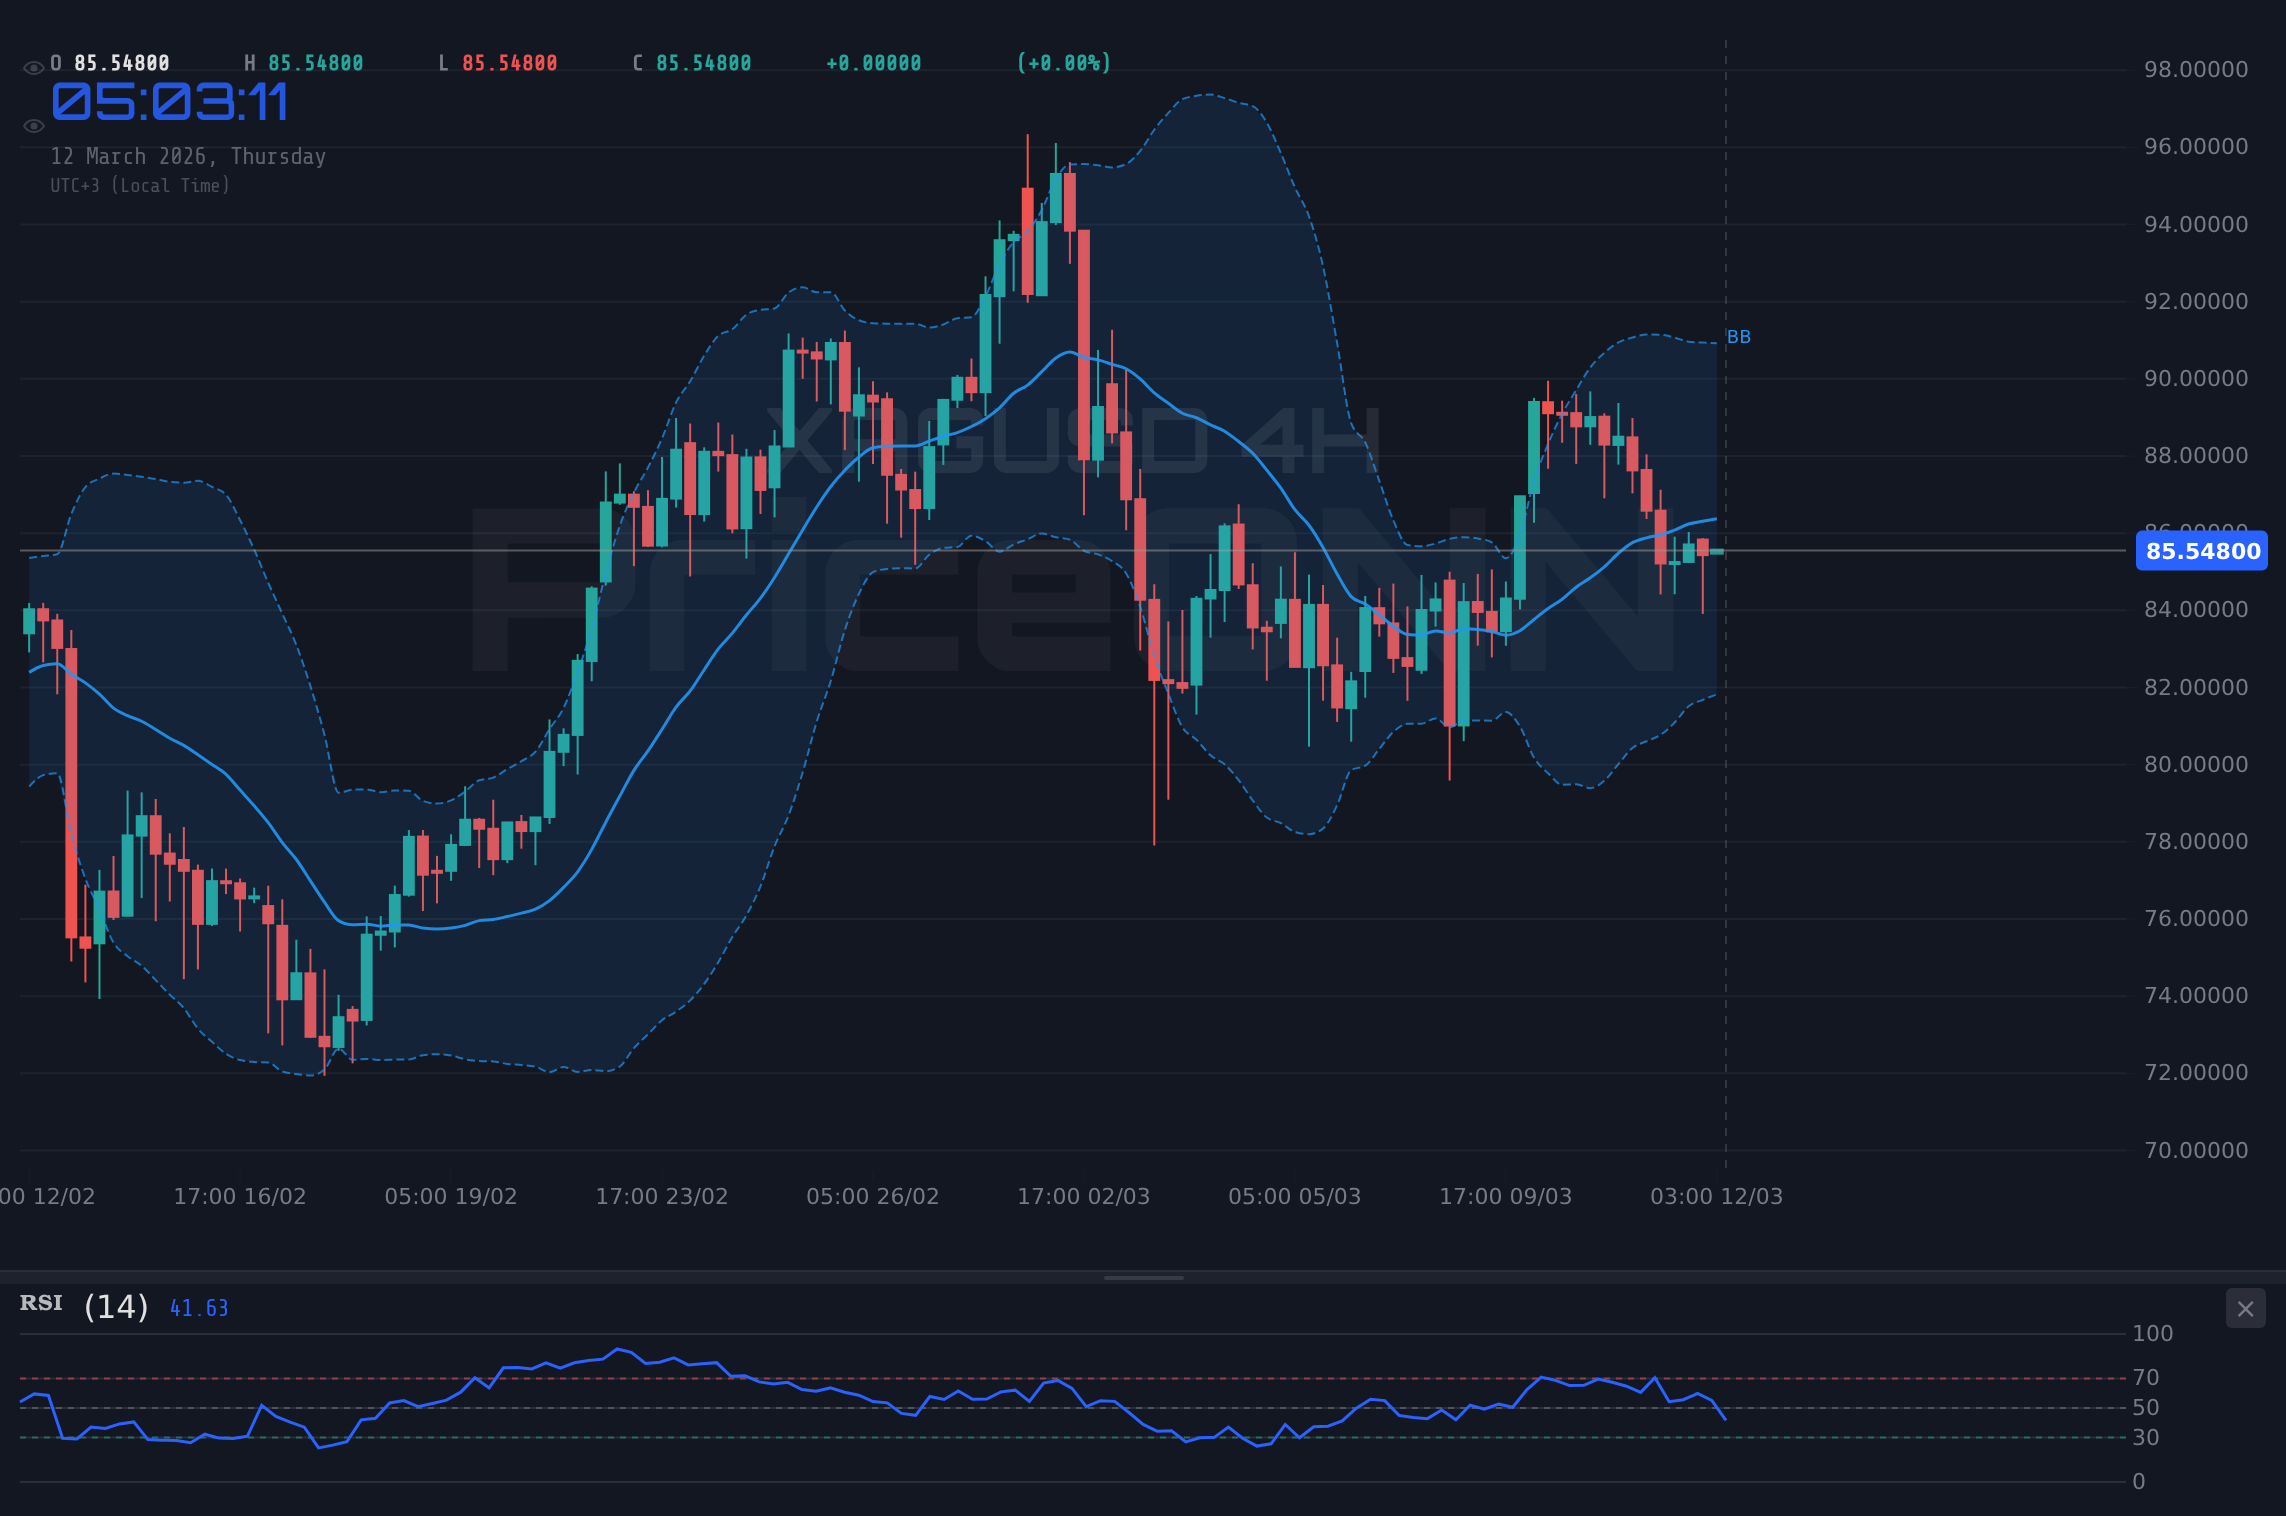
Looking at the 4-hour timeframe, the trend remains neutral, reflecting the tug-of-war between bullish and bearish forces. The RSI at 47.2 indicates neutral momentum, neither overbought nor oversold. The MACD histogram is negative, suggesting that selling pressure still persists. The Stochastic oscillator, with K=22.53 and D=33.9, is signaling a bearish continuation. Key support levels on this timeframe are $85.28, $84.85, and $84.48, while resistance is found at $86.08, $86.46, and $86.89. The ADX reading of 23.22 indicates a moderate downtrend, reinforcing the bearish bias on this timeframe.
On the daily chart, XAGUSD exhibits a downtrend, with the ADX at 15.46 indicating a weak trend. The RSI is at 50.51, suggesting neutral momentum. The Stochastic oscillator, with K=48.82 and D=38.7, is signaling a bullish crossover, which could provide some near-term support for the price. However, overall, the technical picture remains bearish, with key resistance at $90.08 and support at $86.39. A break below $86.39 could trigger a deeper correction towards $84.49 and $82.71.
The upcoming US CPI data, scheduled for release on Friday, is expected to be a major catalyst for XAGUSD. According to market forecasts, the CPI is expected to hold steady at 2.4%, which could put pressure on the Fed to maintain its hawkish stance. A higher-than-expected CPI reading could trigger a sharp rally in the dollar, further weighing on silver prices. Conversely, a weaker-than-expected CPI could lead to a dollar sell-off, providing some relief for silver.
For scalpers, the immediate focus should be on the $86.18 resistance level on the 1-hour chart. A decisive break above this level could present a short-term buying opportunity, targeting $86.78. Conversely, a rejection at $86.18 could offer a selling opportunity, targeting $84.45. Swing traders should monitor the 4-hour timeframe for potential breakout opportunities. A break above $86.08 could signal a bullish reversal, targeting $86.46 and $86.89. However, a breakdown below $85.28 could trigger a bearish continuation, targeting $84.85 and $84.48.
Long-term investors should focus on the daily chart and be patient. The overall trend remains bearish, but the Stochastic oscillator is signaling a potential bullish reversal. A sustained break above $90.08 would be needed to confirm a bullish trend reversal. Until then, caution is warranted. Furthermore, it is important to consider the industrial demand for silver, which is a significant factor in its long-term price performance. Silver is used in a wide range of industrial applications, including electronics, solar panels, and medical devices. As the global economy continues to grow, demand for silver is expected to increase, which could provide support for its price.
The DXY is currently at 99.13, reflecting a strong dollar. This puts downward pressure on silver, as a stronger dollar makes silver more expensive for international buyers. The SP500 is currently at 6721.5, down 1.02% for the day. This risk-off sentiment could provide some support for silver as a safe-haven asset. WTI crude oil is currently at $93.37, up 8.19% for the day. This rise in oil prices is largely attributed to geopolitical tensions in the Middle East, stoking inflation fears and further bolstering the dollar's appeal as a safe-haven asset.
Historically, silver has often exhibited a volatile run, as keyword intelligence highlights. The interplay between its industrial demand, its role as a precious metal, and its sensitivity to macroeconomic factors makes it a challenging asset to trade. Chart pattern recognition and multi-timeframe analysis are crucial tools for navigating these complexities. Price action analysis, combined with an understanding of market sentiment, can provide valuable insights into potential trading opportunities. Key level alerts, based on support and resistance levels, can help traders identify entry and exit points.
The macroeconomic landscape is further complicated by the upcoming economic data releases. According to the economic calendar, the UK GDP is scheduled for release on Friday. A better-than-expected GDP reading could provide some support for the pound, potentially weighing on the dollar and providing some relief for silver. However, the primary focus remains on the US CPI data, which is expected to be a key driver of market sentiment in the coming days.
If XAGUSD breaks below the support level of $84.45, it could trigger a further decline towards $83.31 and $82.71. This scenario is highly probable (60%) if the US CPI data comes in higher than expected, bolstering the dollar and weighing on precious metals.
If XAGUSD breaks above the resistance level of $86.18, it could signal a potential bullish reversal, targeting $86.78 and $87.92. This scenario is moderately probable (40%) if the US CPI data comes in weaker than expected, weakening the dollar and providing support for silver.
Key Levels
Support Levels
Resistance Levels
Trade Plan: XAGUSD
Time Horizon: This analysis is for swing traders looking for opportunities over the next 1-2 weeks.
- Entry Trigger: Break and close above $86.18
- Target 1: $86.78
- Target 2: $87.92
- Stop/Invalidation: Close below $84.45
Frequently Asked Questions: XAGUSD Analysis
What happens if XAGUSD breaks above $86.18 resistance?
A break above the $86.18 resistance level could signal a bullish reversal, potentially leading to a rally towards $86.78 and $87.92. However, traders should exercise caution and wait for confirmation before entering long positions, as the overall trend remains bearish.
Should I sell XAGUSD at current levels of $85.47 given the strong downtrend?
While the overall trend is bearish, the Stochastic oscillator is signaling a potential bullish reversal on the 1-hour chart. Therefore, selling at current levels may be risky. Traders should wait for a clearer signal before entering short positions, such as a break below $84.45.
Is an RSI of 47.2 on the 4-hour chart a buy signal for XAGUSD?
An RSI of 47.2 on the 4-hour chart indicates neutral momentum, neither overbought nor oversold. Therefore, it is not a clear buy signal. Traders should consider other indicators and factors before making a trading decision.
How will the upcoming US CPI data affect XAGUSD this week?
The upcoming US CPI data is expected to be a major driver of XAGUSD. A higher-than-expected CPI reading could strengthen the dollar and weigh on silver, while a weaker-than-expected CPI could weaken the dollar and provide support for silver.
Track markets in real-time
AI-powered analysis, technical indicators and real-time price data.
Join Our Telegram Channel
Breaking market news, AI analysis and trading signals instantly.
Join Channel