The S&P 500 is currently navigating a critical juncture, trading at $6,335.85, as a confluence of macroeconomic headwinds and geopolitical anxieties casts a shadow over market sentiment. The index, which has seen a notable retreat from its recent highs, is now testing crucial support levels. This price action demands close attention from traders and investors alike, as the underlying technical indicators present a complex picture, with conflicting signals across different timeframes. The current environment, marked by a resurgent US Dollar Index (DXY) and elevated oil prices, adds another layer of pressure, suggesting that the path forward for the broader equity market is far from clear. Understanding the interplay between these factors is paramount for formulating any trading strategy in the current volatile landscape.
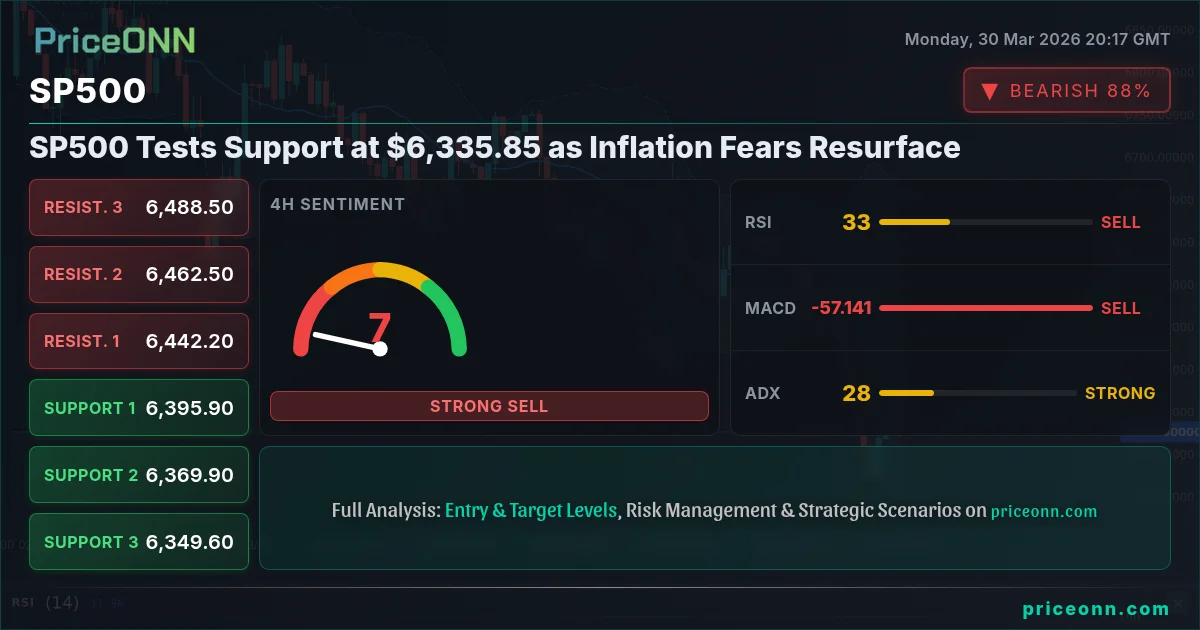
- The S&P 500 is currently trading at $6,335.85, testing significant support.
- RSI at 34.48 on the 1H chart signals bearish momentum, while the 4H RSI at 33.24 suggests oversold conditions.
- Key support is holding at $6,332.87 on the 1H chart, with further levels at $6,324.33 and $6,310.27.
- The DXY is strong at 100.34, correlating with downward pressure on equities as risk appetite wanes.
The market's reaction to recent geopolitical developments, particularly concerning the Middle East and its impact on energy prices, has been swift and significant. Brent crude has surged past $112.44 and WTI crude is trading above $105.26, directly fueling inflation expectations. This surge in energy costs, coupled with persistent supply chain issues, creates a challenging environment for central banks, particularly the Federal Reserve. The specter of sticky inflation returning to the forefront is a primary concern, potentially forcing a more hawkish stance than markets have recently anticipated. This has led to a strengthening of the US Dollar Index (DXY) to 100.34, which typically exerts downward pressure on risk assets like the S&P 500, as seen in its current trading range.
Navigating the Crosscurrents: SP500's Technical Battleground
From a technical standpoint, the S&P 500 presents a mixed bag across different timeframes, highlighting the current market indecision. On the 1-hour chart, the trend is clearly bearish with a strength of 86%, supported by a bearish signal from the ADX at 21.42. The RSI(14) is hovering at 34.48, indicating bearish momentum, while the MACD remains below its signal line, reinforcing the negative sentiment. Stochastic Oscillator readings also point downwards, with %K at 9.82 and %D at 23.77. This short-term picture suggests that further downside is possible, with immediate support levels at $6,332.87, $6,324.33, and $6,310.27. However, the Bollinger Bands on this timeframe are hugging the middle band, hinting at a potential pause before the next significant move.
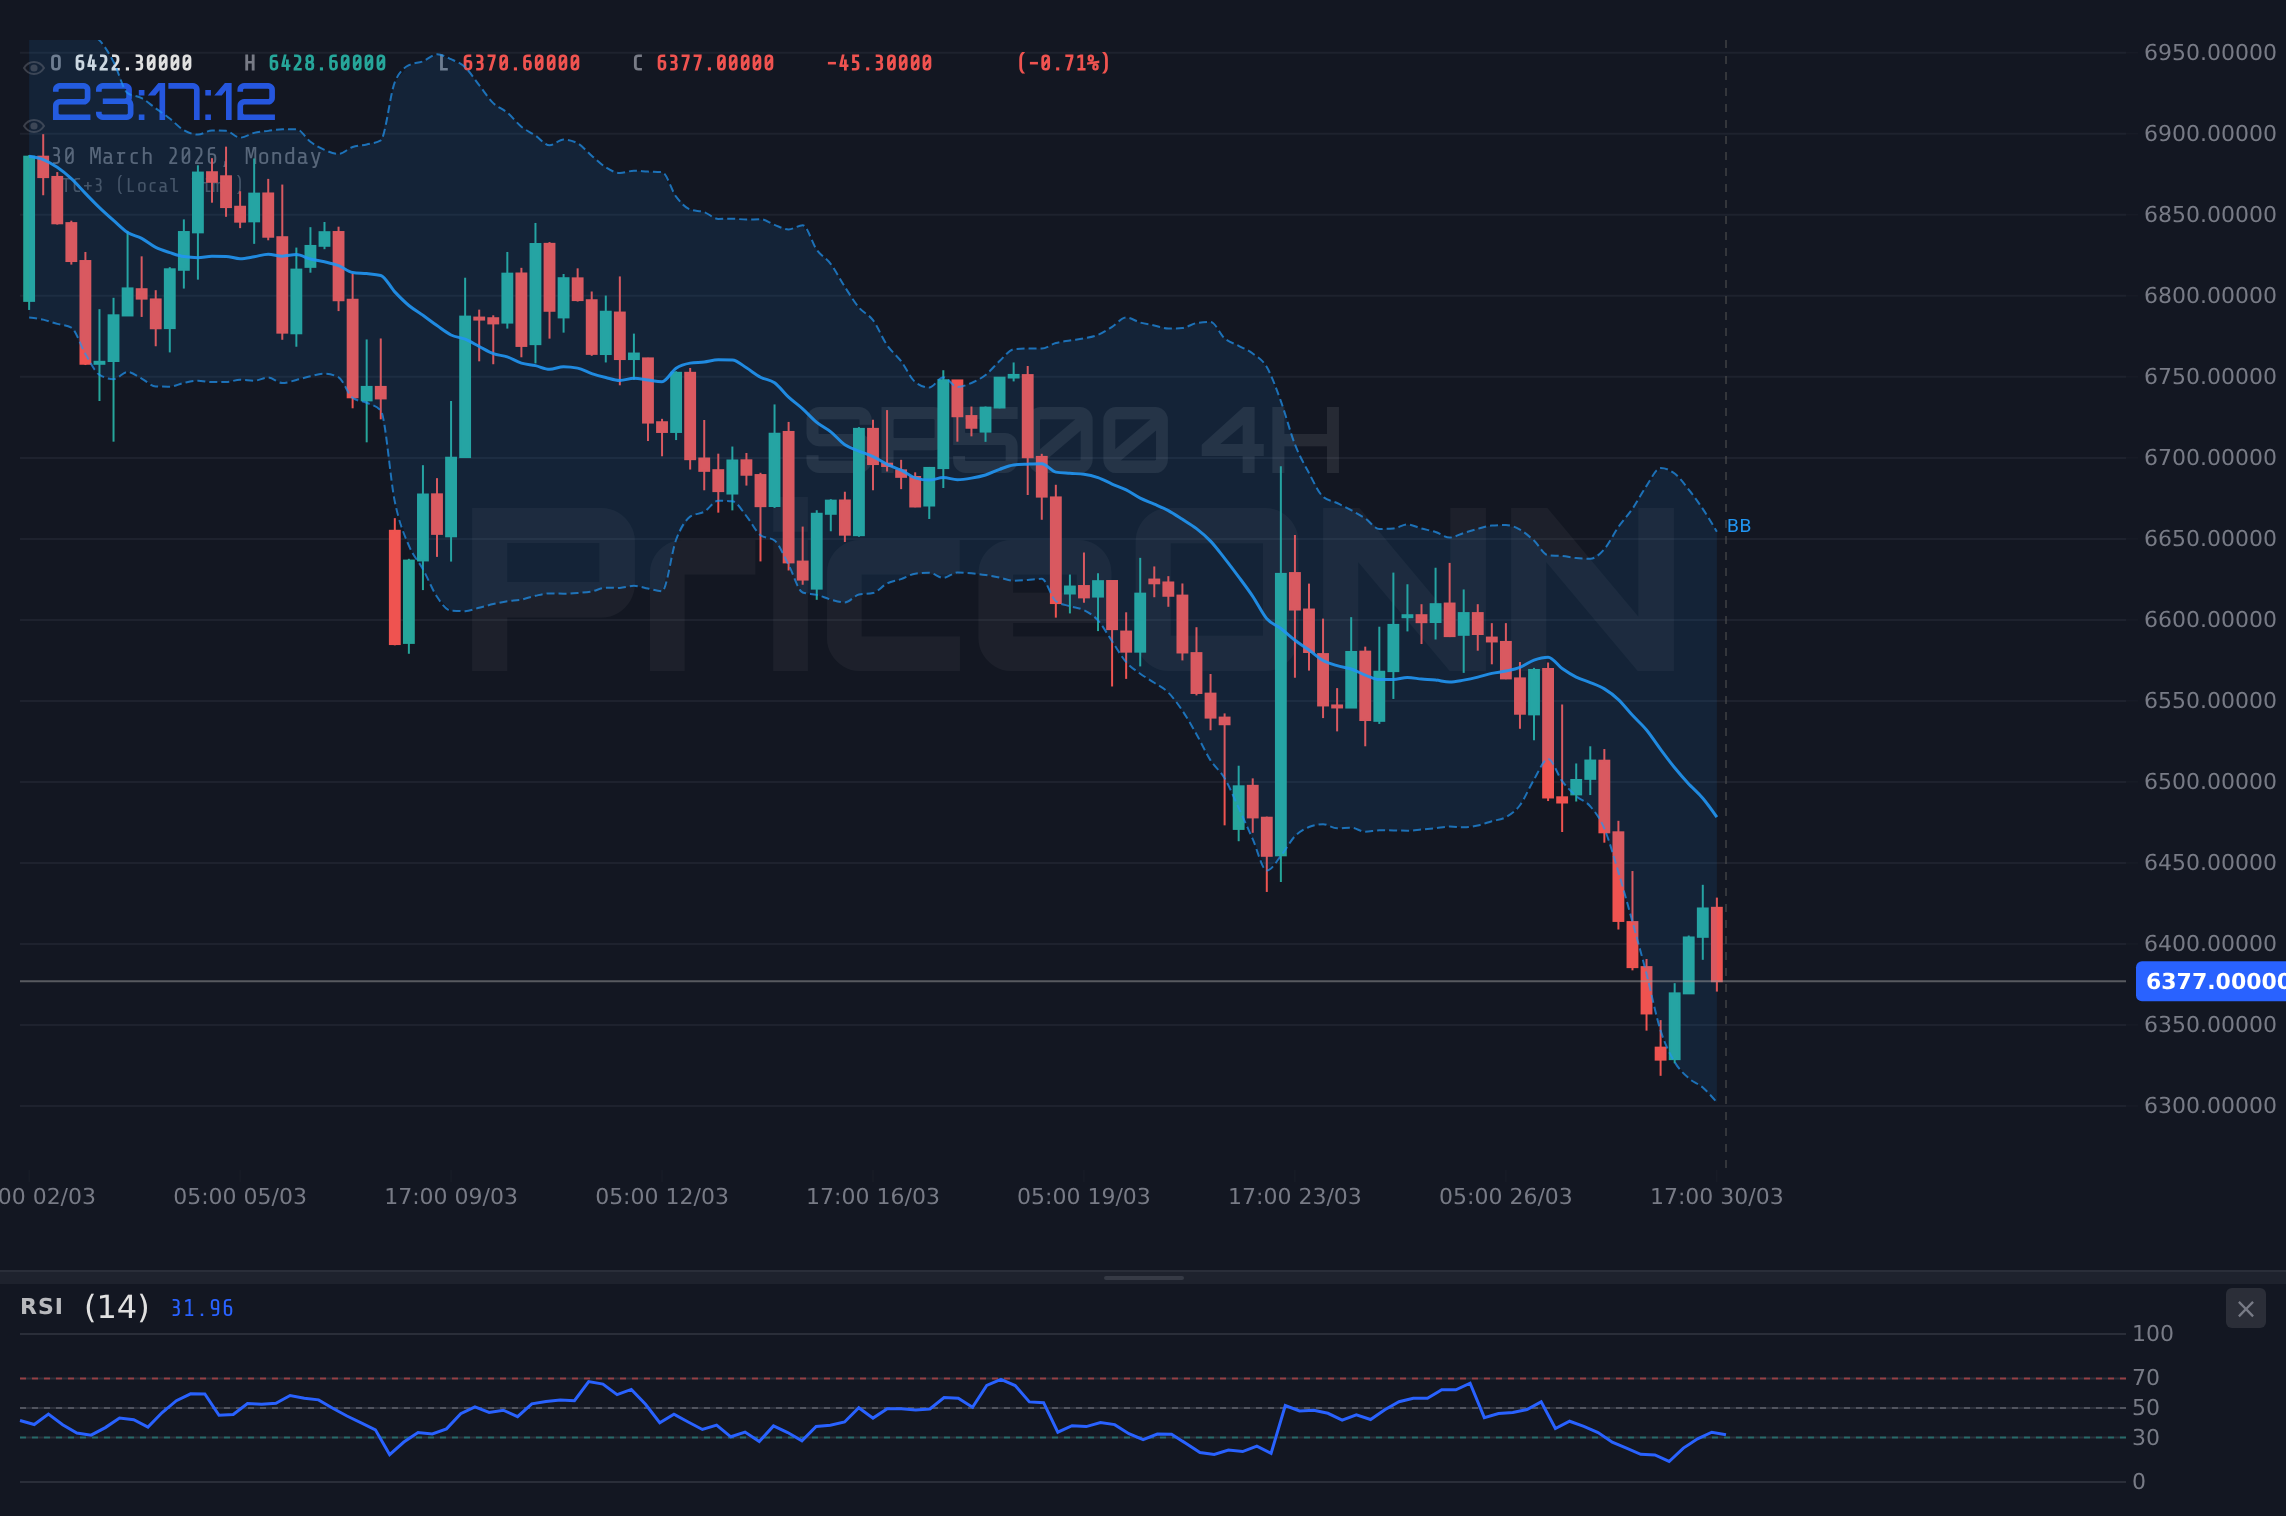
The 4-hour chart, however, introduces a degree of ambiguity. While the trend is still predominantly bearish with 94% strength, the ADX has softened slightly to 28.13, suggesting a strong but potentially decelerating trend. The RSI(14) here sits at 33.24, indicating oversold conditions, which could signal a short-term bounce. The MACD shows negative momentum, but the Stochastic Oscillator's %K at 33.78 and %D at 18.52 presents a bullish divergence, suggesting that the selling pressure might be exhausting. This conflicting signal between the RSI and Stochastic on the 4-hour timeframe warrants caution. Support levels on this chart are found at $6,395.90, $6,369.90, and $6,349.60, while resistance looms at $6,442.20, $6,462.50, and $6,488.50.
Zooming out to the daily timeframe, the picture darkens considerably. The S&P 500 is firmly entrenched in a downtrend with 100% trend strength. The ADX reading of 49 signifies a very strong downtrend, underscoring the bearish conviction. The RSI(14) is deep in oversold territory at 25.94, a level that has historically preceded significant bounces, but also signals extreme bearish sentiment. The MACD histogram continues to print negative values, below its signal line, reinforcing the downtrend. The Stochastic Oscillator is also pointing downwards with %K at 7.79 and %D at 29.16. The Bollinger Bands are positioned below the lower band, indicating extreme bearish pressure and a potential for a mean-reversion rally, though the strength of the trend suggests that such rallies might be short-lived. The key support levels on the daily chart are at $6,295.07, $6,233.03, and $6,119.57. Resistance is seen at $6,470.57, $6,584.03, and $6,646.07.
The Role of the Dollar and Oil in the SP500 Equation
The correlation between the S&P 500 and the US Dollar Index (DXY) is a critical factor to monitor. With the DXY currently trading at 100.34 and exhibiting a strong upward trend across all timeframes, it exerts significant pressure on US equities. A stronger dollar makes US exports more expensive and can signal capital flowing into perceived safe-haven assets, often at the expense of riskier investments like stocks. The 1-hour DXY shows RSI at 78.07, indicating overbought conditions, which might suggest a temporary pause or pullback in the dollar's ascent. However, the overall trend strength and MACD alignment on the daily chart point towards continued dollar strength in the medium term, posing a challenge for the S&P 500's recovery prospects. This dynamic highlights how global risk sentiment, often reflected in currency movements, directly impacts US market performance.
Simultaneously, the surge in oil prices, with Brent at $112.44 and WTI at $105.26, acts as a double-edged sword. On one hand, higher energy prices can boost the revenues of energy companies within the S&P 500, providing some sector-specific support. On the other hand, they significantly contribute to inflationary pressures. The German inflation data, reported at 2.7% in March, serves as a stark reminder of this risk. Persistent inflation could force the Federal Reserve to maintain a hawkish monetary policy, potentially higher for longer, which is generally detrimental to equity valuations. The market is keenly watching for any signs of inflation cooling or the Fed signaling a pivot, but currently, the data points towards a sustained inflationary environment that weighs on the broader market. This makes the upcoming economic calendar, particularly any US inflation or employment figures, highly significant.
Scenario Analysis: Mapping Potential SP500 Trajectories
Bearish Scenario: Downside Momentum Continues
65% ProbabilityNeutral Scenario: Consolidation Around Current Levels
25% ProbabilityBullish Scenario: Short-Term Bounce Potential
10% ProbabilityThe bearish scenario appears the most probable given the current technical alignment and macroeconomic backdrop. A break below the immediate 1-hour support at $6,332.87 could trigger a rapid move towards the next levels. This thesis remains valid as long as the index stays below the $6,378.07 resistance. Conversely, a neutral scenario hinges on the price consolidating within the current 1-hour range, which seems less likely given the strong downtrend signals on the daily chart. The bullish scenario, while offering a potential short-term bounce, appears to have the lowest probability, requiring a strong catalyst and a clear break of immediate resistance, coupled with positive divergence in key oscillators.
What the Indicators Are Saying: A Deeper Dive
Analyzing the indicators provides further nuance. The RSI on the 1-hour chart is at 34.48, indicating bearish momentum, while the 4-hour RSI at 33.24 suggests oversold conditions, creating a divergence. This conflict is typical in trending markets where oversold readings can persist. The MACD histogram remains negative on the 1-hour and 4-hour charts, reinforcing the bearish outlook, although the 4-hour MACD is showing signs of potentially crossing its signal line. Stochastic Oscillator readings are particularly telling: on the 1-hour, it's deeply oversold (K=9.82, D=23.77), suggesting a potential snap-back, but on the 4-hour, it shows a bullish crossover (K=33.78, D=18.52) despite overall bearish momentum. This divergence suggests that while the immediate pressure is downward, there might be underlying forces building for a potential short-term reversal, albeit with low probability.
The ADX indicator provides a clear picture of trend strength. On the 1-hour chart, ADX stands at 21.42, indicating a moderately strong downtrend. However, the 4-hour ADX at 28.13 and the daily ADX at 49 paint a picture of accelerating downside momentum. An ADX above 25 generally signifies a strong trend, and the daily reading of 49 suggests that the current bearish move has significant power behind it. This strong trend strength implies that counter-trend trades, like betting on a bounce from oversold RSI, carry higher risk. The market needs to show a clear break of established resistance levels or a significant shift in macro data to invalidate this strong bearish trend indicated by the ADX.
The Bollinger Bands offer another perspective. On the 1-hour and 4-hour charts, the price is trading below the middle band, indicating bearish pressure. On the daily chart, the price has breached the lower band, a sign of extreme bearishness that could precede a reversion to the mean. However, in strongly trending markets, prices can 'walk the band' for extended periods. Therefore, while the Bollinger Bands suggest oversold conditions on the daily chart, they do not, in isolation, signal an immediate buy. Confirmation from other indicators and price action breaking key resistance levels would be necessary to consider a bullish reversal. The current position below the bands suggests that the downside momentum is strong, but also that the market is stretched, making a short-term relief rally a possibility if key support levels manage to hold.
The Looming Inflation Data and Fed's Dilemma
The macroeconomic calendar is currently dominated by inflation concerns. With energy prices remaining elevated due to geopolitical tensions in the Middle East, the risk of inflation re-accelerating is significant. Recent German inflation figures hitting 2.7% serve as a cautionary tale. Investors are anxiously awaiting the upcoming US inflation data, as it will heavily influence the Federal Reserve's monetary policy decisions. If inflation comes in hotter than expected, it could force the Fed to reconsider its stance on interest rates, potentially delaying any anticipated rate cuts or even hinting at further tightening. This would likely strengthen the DXY further and put additional downward pressure on the S&P 500, pushing it towards the lower support levels identified on the daily chart.
The market's reaction to such data will be swift. A hotter-than-expected inflation print could trigger a sell-off across risk assets, a 'risk-off' move that would benefit safe-haven assets like gold and potentially the US dollar. Conversely, if inflation shows signs of cooling, it might provide a much-needed reprieve for the S&P 500, potentially fueling a short-covering rally. The current ADX reading of 49 on the daily chart suggests that any move triggered by this data could be sharp and sustained. Traders will be looking for confirmation of a trend change, likely requiring a decisive break above key resistance levels such as $6,470.57 on the daily chart, before committing to a bullish outlook. Until then, the prevailing sentiment is likely to remain cautious, with a bias towards downside risk.
The current market structure, characterized by strong downtrends on higher timeframes and conflicting signals on lower timeframes, demands a disciplined approach. The high probability bearish scenario, supported by the ADX at 49 and the RSI's position on the daily chart, suggests that traders should remain vigilant for further downside. However, the oversold conditions on the 4-hour chart and the potential for short-term divergences cannot be ignored. This creates a complex trading environment where risk management is paramount. Waiting for clear confirmation signals, such as a decisive break of support or resistance, or a significant shift in macroeconomic data, will be crucial for navigating these choppy waters effectively. The interplay between inflation data, Fed policy expectations, and geopolitical events will likely dictate the short-to-medium term direction for the S&P 500.
Upcoming US inflation and employment data releases pose a significant risk of increased volatility. Traders should exercise extreme caution and ensure appropriate risk management strategies are in place.
The strength of the downtrend, as indicated by the daily ADX at 49, suggests that any rallies might be met with selling pressure. The key will be to observe how price reacts to the immediate support at $6,332.87. A failure to hold this level could accelerate the move lower, targeting $6,324.33 and then $6,310.27. Conversely, if this level holds and we see a bounce, traders will watch for a test of the 1-hour resistance at $6,355.47. A break above this level, especially if accompanied by positive divergence on the Stochastic and a cooling DXY, could signal a temporary reprieve. However, given the overall bearish technical setup and macroeconomic concerns, such a bounce is expected to face stiff resistance higher up, especially around the $6,470.57 daily resistance level.
The Path Forward: Actionable Insights for Traders
For traders looking to navigate this complex market, patience and discipline are key. The current technical setup on the S&P 500, particularly the strong bearish trend indicated by the daily ADX, suggests that adopting a short-term bearish bias might be prudent. However, the oversold conditions on the 4-hour chart and the conflicting signals from oscillators necessitate waiting for clearer confirmation. The immediate trigger for a bearish move would be a break below the $6,332.87 support level. Conversely, a bullish outlook would require a decisive move above the $6,355.47 resistance, ideally followed by a break of the more significant daily resistance at $6,470.57.
Given the current market conditions, characterized by elevated inflation fears and geopolitical uncertainty, traders should focus on risk management. Implementing stop-losses tightly and avoiding overly leveraged positions is crucial. The probability of the bearish scenario playing out remains high, suggesting that short positions could be favored, but only on confirmation of a breakdown below key support. For those looking for potential long opportunities, waiting for a clear trend reversal signal, such as a sustained break above daily resistance levels and positive confirmation from multiple indicators, would be advisable. The market is currently presenting a challenging environment, and adherence to a well-defined trading plan is more important than ever.
Frequently Asked Questions: SP500 Analysis
What happens if the SP500 breaks below the $6,332.87 support level?
If the S&P 500 closes decisively below $6,332.87, it would likely trigger further selling pressure, targeting the next support levels at $6,324.33 and $6,310.27 on the 1-hour chart. This would confirm the bearish scenario with a higher probability.
Should I consider buying SP500 at current levels of $6,335.85 given the oversold RSI on the 4-hour chart?
While the 4-hour RSI at 33.24 suggests oversold conditions, the strong daily downtrend (ADX 49) and bearish signals on other indicators indicate caution. A buy at current levels is a high-risk trade; waiting for a confirmed break above $6,378.07 resistance or a clearer bullish divergence on multiple timeframes would be a safer approach.
Is the RSI at 34.48 on the 1-hour chart a sell signal for SP500 right now?
An RSI of 34.48 on the 1-hour chart indicates bearish momentum, aligning with the overall downtrend. While not a direct sell signal in isolation, it reinforces the bearish outlook. Confirmation would come from a break below key support levels and continued negative MACD momentum.
How will upcoming US inflation data affect SP500 this week given the current DXY strength?
Hotter-than-expected inflation data could strengthen the DXY further to 100.50 or higher, increasing pressure on the SP500 and potentially pushing it towards $6,295.07 support. Conversely, cooler data might ease pressure, allowing for a potential bounce towards $6,378.07 resistance.
Track markets in real-time
AI-powered analysis, technical indicators and real-time price data.
Join Our Telegram Channel
Breaking market news, AI analysis and trading signals instantly.
Join Channel