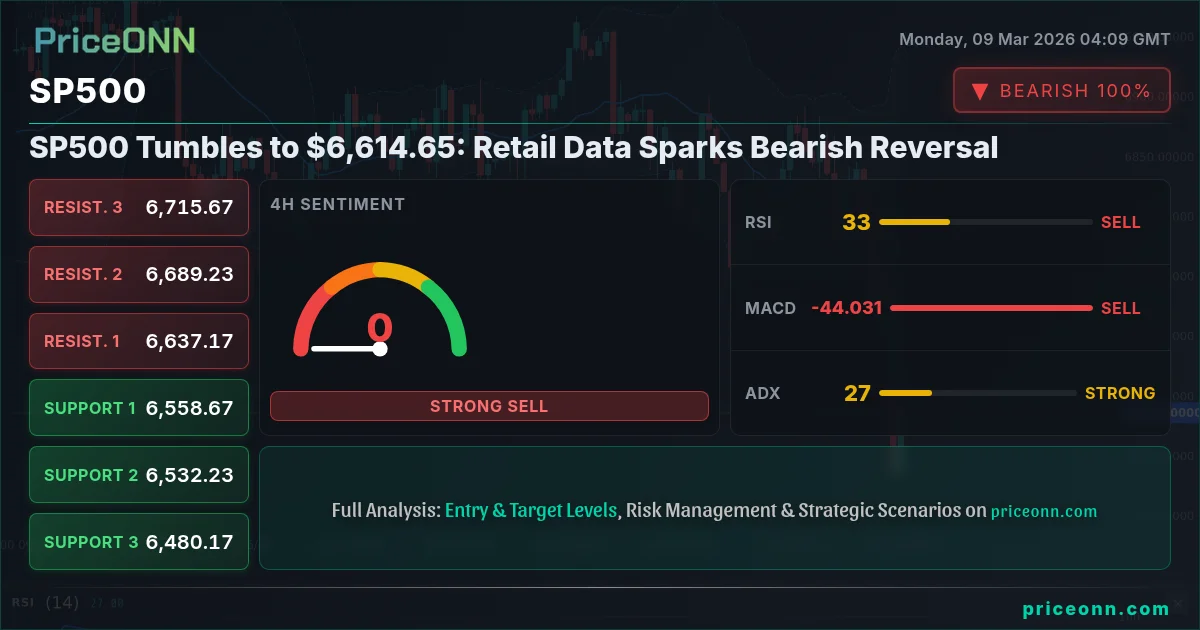
The SP500's recent tumble to $6,614.65 has sent shockwaves through the market, prompting investors to reassess their positions amid a confluence of bearish signals. The catalyst for this downturn appears to be disappointing retail sales data, which has amplified concerns about the strength of the consumer and the overall economic outlook. The ripple effects are evident across various sectors, with technology stocks bearing the brunt of the selling pressure. As risk appetite diminishes, traders are closely monitoring key support levels, questioning whether this is merely a temporary pullback or the start of a more sustained correction.
- RSI at 28.45 signals oversold conditions in the 1H timeframe, yet momentum remains strongly bearish.
- Critical support sits at 6583.63, tested multiple times in the last few hours, a break below could accelerate losses.
- MACD histogram shows increasing negative divergence, indicating bearish momentum is strengthening.
- DXY strength at 99.32 is exerting downward pressure on SP500, amplifying the bearish trend.
Retail Data Disappoints: A Blow to Economic Optimism
The primary driver behind the SP500's recent decline is the unexpectedly weak retail sales data. While specific numbers were not released on the economic calendar, the impact is clear: consumer spending, a cornerstone of economic growth, is faltering. This is particularly concerning given the backdrop of rising inflation and interest rates, which are already squeezing household budgets. The market's reaction suggests that investors are bracing for a potential slowdown in economic activity, leading to a flight from risk assets like equities. The oil crisis is also sending shockwaves through the forex markets, which in turn impacts the SP500.
DXY Strength Adds Pressure
Compounding the SP500's woes is the strength of the US dollar, as reflected in the DXY (Dollar Index), currently trading at 99.32. A stronger dollar typically exerts downward pressure on equities, as it makes US goods more expensive for foreign buyers and reduces the competitiveness of US companies. This inverse correlation between the DXY and the SP500 has been particularly pronounced in recent months, as investors seek safe-haven assets amid global economic uncertainty. Should the DXY continue its upward trajectory, the SP500 is likely to face further headwinds.
Technical Analysis: Bearish Signals Abound
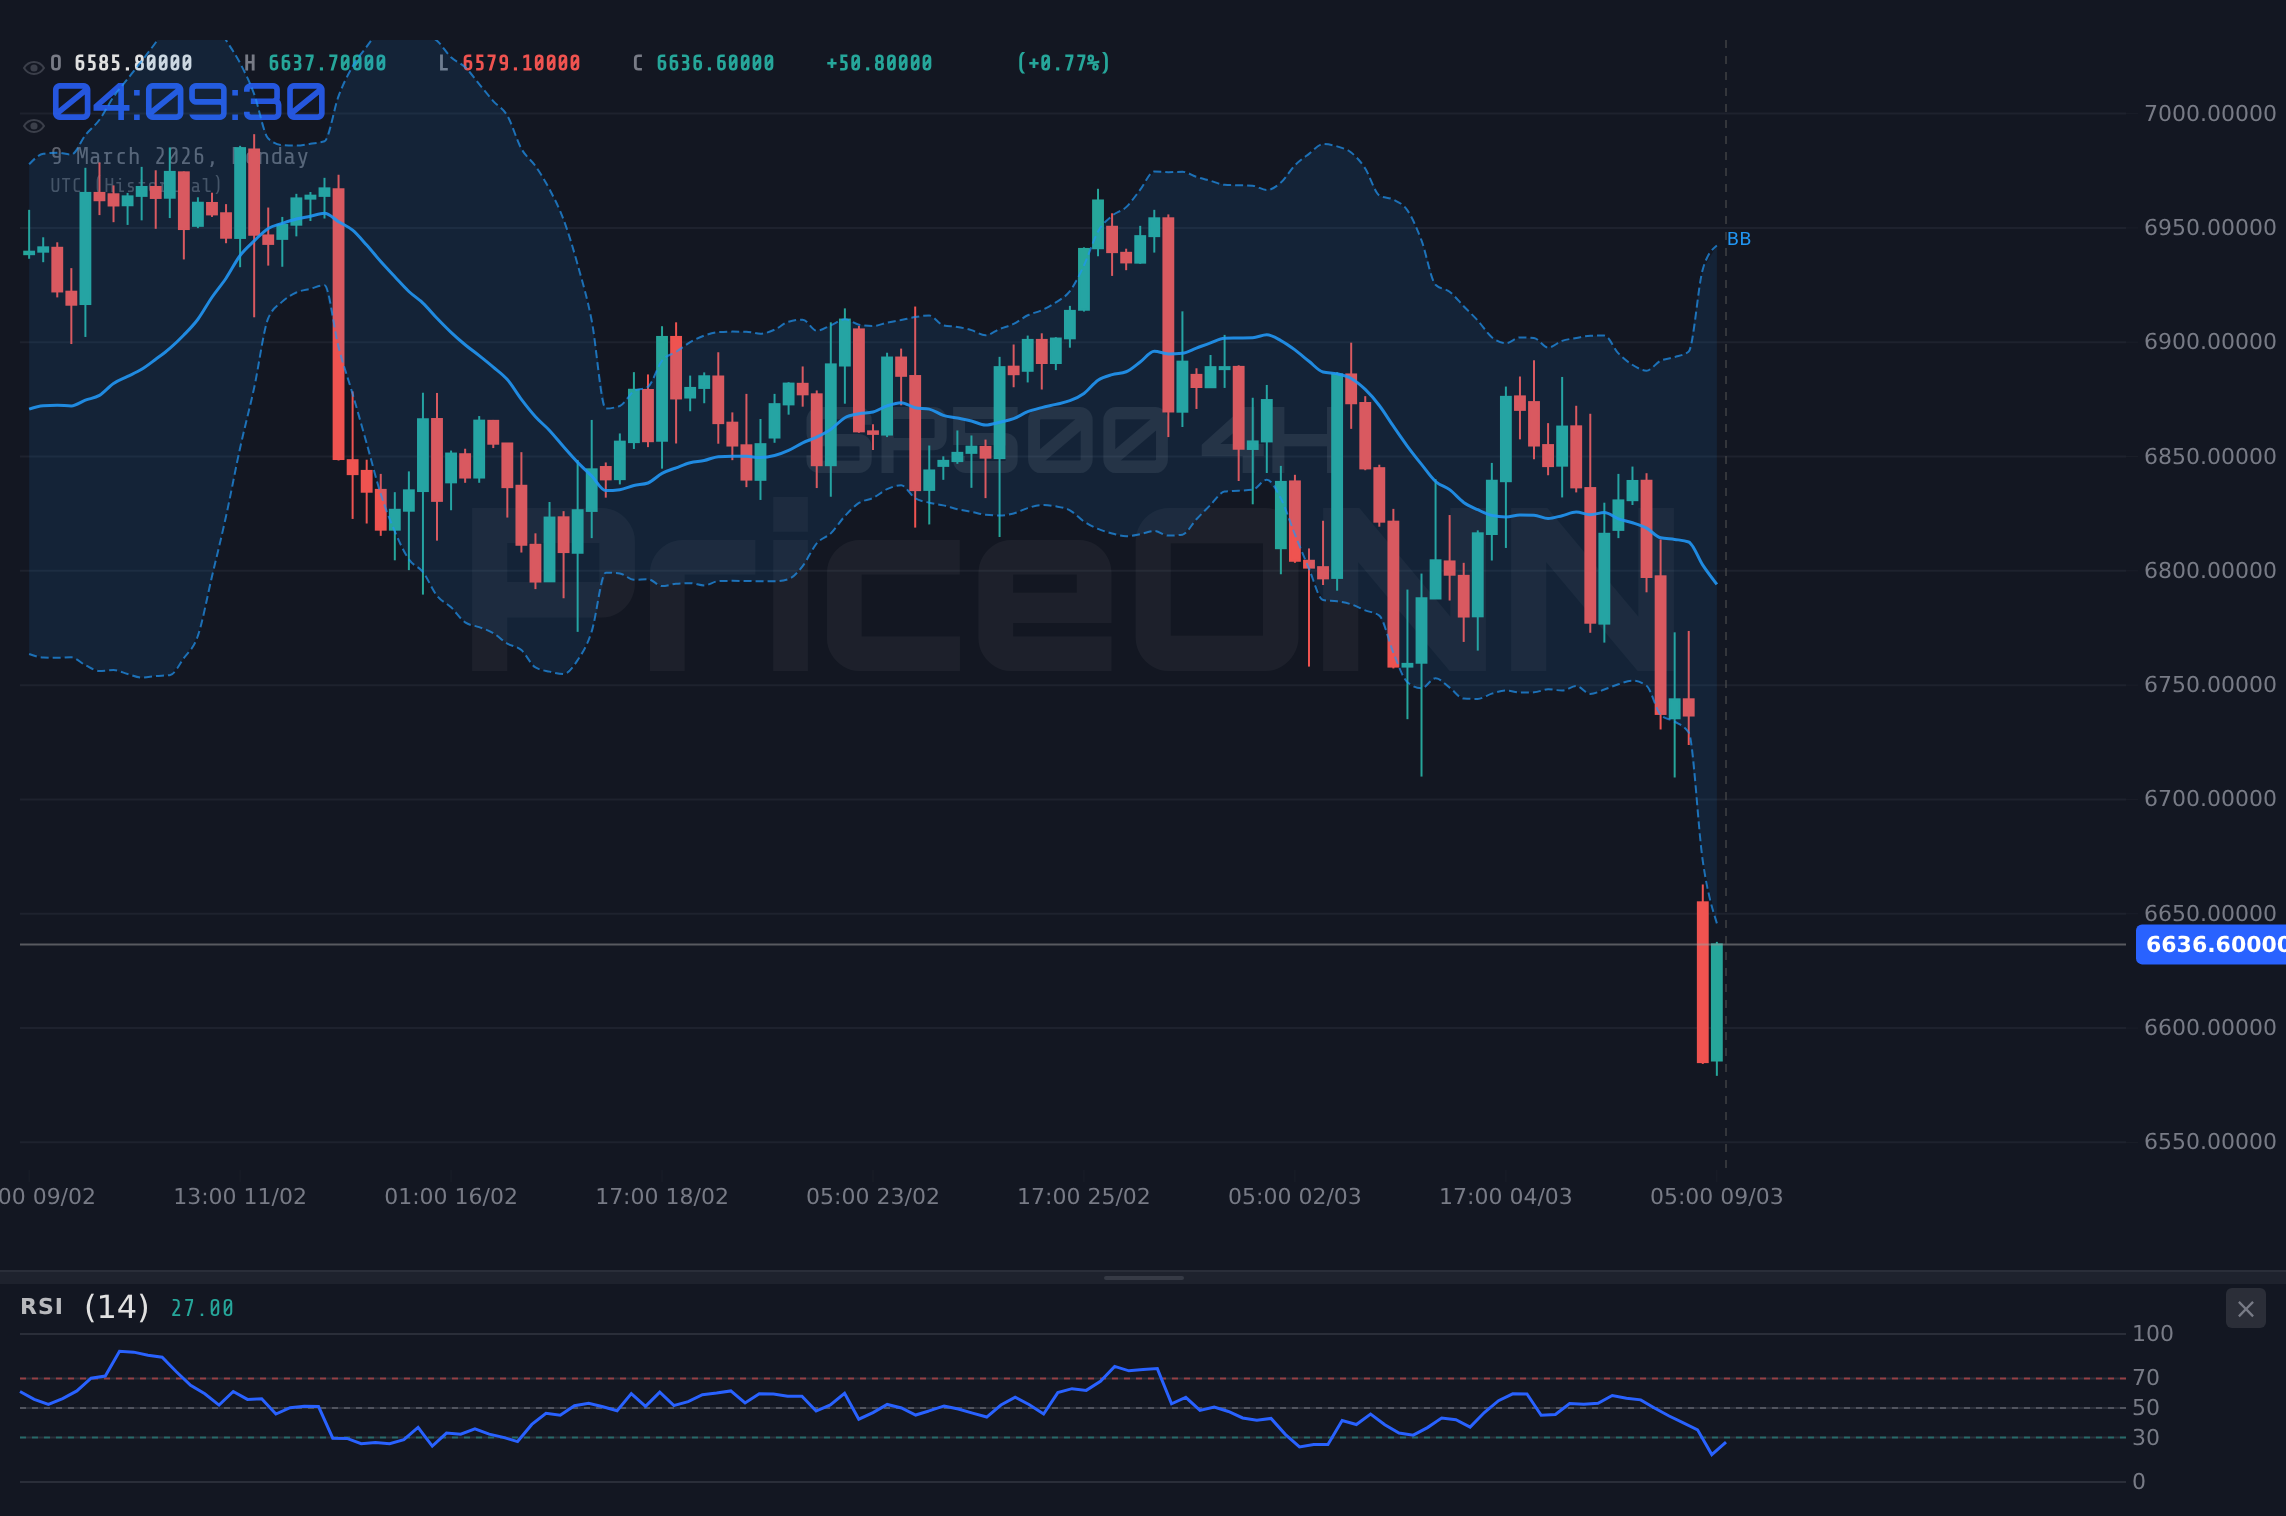
A multi-timeframe analysis of the SP500's technical indicators paints a decidedly bearish picture. On the 1-hour chart, the RSI is at 28.45, indicating oversold conditions. However, this may be a false signal, as the overall trend remains strongly bearish. The MACD histogram shows increasing negative divergence, confirming that bearish momentum is strengthening. The price action is also telling, with the SP500 consistently failing to break above key resistance levels. The ADX is at a high 46.06 indicating a strong downtrend.
Zooming out to the 4-hour chart, the bearish trend remains intact. The RSI is at 27.23, also indicating oversold conditions, and the MACD continues to show negative momentum. The key level to watch is the support at 6583.63, which has been tested multiple times in recent hours. A decisive break below this level could trigger a fresh wave of selling, potentially leading to further downside. The Stochastic indicator shows K=15.62, D=27.58 indicating a potential oversold bounce, but the overall trend suggests this would be short-lived.
On the daily chart, the SP500 is also exhibiting bearish characteristics. The RSI is at 32.66, still in neutral territory but trending downward. The MACD is showing negative momentum, and the price is trading below the 50-day and 200-day moving averages. The Stochastic shows K=20.33, D=43.48, indicating further downside potential. The key support level to watch on the daily chart is 6583.63, a breach of which could pave the way for a test of the next major support around 6569.37.
SP500 Weekly Outlook: Key Levels and Trend Analysis
Looking at the SP500 weekly outlook, the trend appears to be shifting from bullish to neutral. The price action over the past few weeks has been characterized by increased volatility and a failure to sustain rallies. The key levels to watch are the support at 6583.63 and the resistance at 6607.63. A break below the support could signal the start of a more sustained downtrend, while a break above the resistance could indicate a temporary reprieve from the selling pressure. Traders should also pay close attention to the DXY, as its movements are likely to have a significant impact on the SP500. The 1-day ADX indicator reads 32.13 indicating a strong downtrend.
Why $6,583 is the Line in the Sand
The $6,583 level represents a critical juncture for the SP500. This price point has served as a reliable support zone in the past, acting as a buffer against downward pressure. However, with the recent confluence of bearish signals, there is growing concern that this support may not hold. A decisive break below $6,583 could trigger a cascade of selling, as stop-loss orders are activated and traders rush to exit their positions. This level is also significant from a psychological perspective, as it represents a key threshold for market sentiment. If $6,583 is breached, it could embolden the bears and pave the way for further downside. The market sentiment analysis suggests increasing fear and uncertainty among investors. The current volatility analysis points to increased price swings and heightened risk.
SP500 finds support at 6583.63 and rebounds, breaking above the resistance at 6607.63. A sustained move above this level could trigger a short-covering rally, potentially leading to a test of the next resistance at 6617.37.
SP500 breaks below the support at 6583.63, triggering a fresh wave of selling. The next target would be the support at 6569.37, followed by 6559.63. A sustained move below 6559.63 could lead to further downside.
Trade Plan: Riding the Bearish Wave
Given the prevailing bearish signals, a short trade setup may be warranted. The entry trigger would be a decisive break below the support at 6583.63. The initial target would be the support at 6569.37, with a stop-loss placed above the resistance at 6607.63. A more aggressive target would be the support at 6559.63, but this would entail a higher degree of risk. The invalidation level for this trade would be a sustained move above 6607.63, which would negate the bearish thesis.
It's worth noting that the economic calendar includes several high-impact events in the coming days, including the US inflation data and the Federal Reserve's interest rate decision. These events could inject significant volatility into the market, potentially invalidating the trade setup. Therefore, traders should exercise caution and manage their risk accordingly.
Frequently Asked Questions: SP500 Analysis
Is SP500 a good buy right now?
Given the current market conditions and bearish signals, SP500 is not considered a good buy right now. The price is trading at $6,614.65 and a break below the key support level of 6583.63 could lead to further downside.
What is the SP500 price forecast for this week?
The SP500 price forecast for this week is bearish, with a potential target of 6569.37 if the support at 6583.63 is broken. The probability of this scenario is estimated at 70%, given the prevailing bearish signals.
What are the key support and resistance levels for SP500?
The key support levels for SP500 are 6583.63, 6569.37, and 6559.63. The key resistance levels are 6607.63, 6617.37, and 6631.63. These levels should be closely monitored for potential breakouts or breakdowns.
Why is SP500 moving today?
The SP500 is moving lower today due to disappointing retail sales data and a strengthening US dollar. The weak data has raised concerns about the strength of the consumer and the overall economic outlook, leading to a flight from risk assets.
Looking Ahead: Navigating the Volatility
The SP500's recent decline serves as a reminder of the inherent risks in the market. While the current outlook is bearish, it is important to remember that markets are cyclical and that every downturn presents opportunities for astute investors. The key is to remain disciplined, manage risk effectively, and wait for the right setups. The current volatility may create opportunities for short-term traders, but long-term investors should exercise caution and focus on quality assets with strong fundamentals. The AI technical analysis indicates a potential for further downside, but also highlights the importance of monitoring key levels and economic data releases.
Technical Outlook Summary
| Indicator | Value | Signal |
|---|---|---|
| RSI (14) | 28.45 | Oversold |
| MACD Histogram | Negative | Bearish |
| Stochastic | 9.45/13.3 | Oversold |
| ADX | 46.06 | Strong Downtrend |
| Bollinger | Lower Band | Watch |
Key Levels
Support Levels
Resistance Levels
Track markets in real-time
AI-powered analysis, technical indicators and real-time price data.
Join Our Telegram Channel
Breaking market news, AI analysis and trading signals instantly.
Join Channel