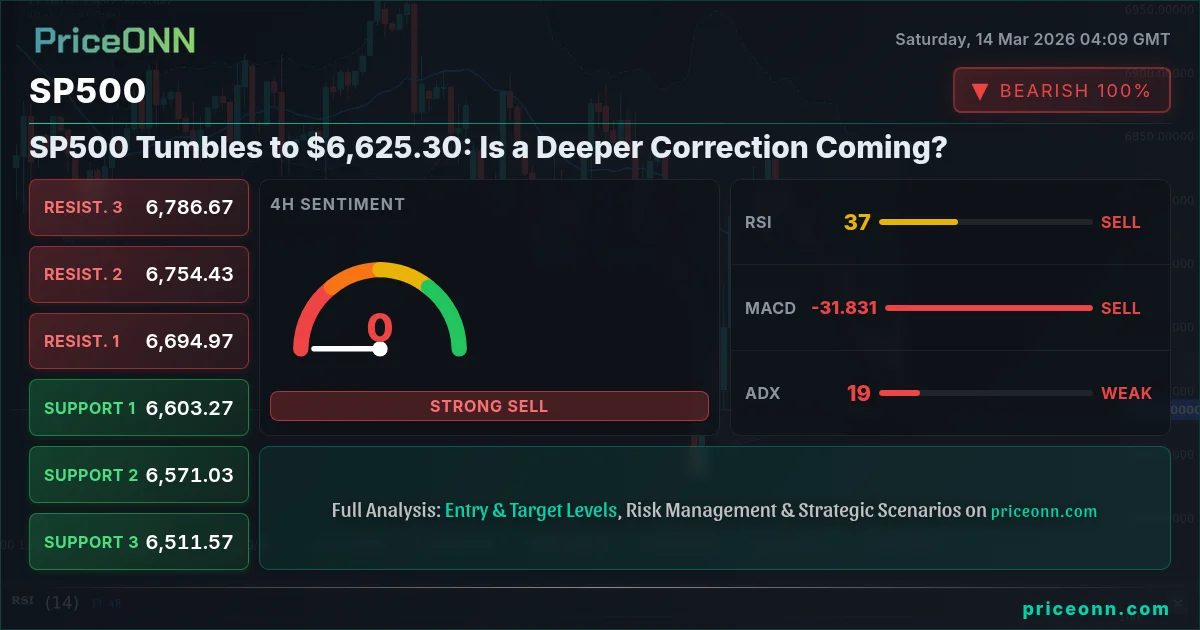
The SP500's last Friday close at $6,625.30 marks a significant downturn, prompting concerns about a potential deeper correction. The index faces a confluence of bearish signals, raising questions about its near-term trajectory.
- RSI at 33.58 on the daily chart signals oversold conditions, but further downside is possible.
- Critical support lies at $6,606.9, a break below which could trigger a sharp selloff.
- MACD histogram shows deepening negative momentum: bearish trend is accelerating.
- Upcoming CPI data release next week will be a major catalyst for SP500 direction.
The SP500's bearish performance this past week has put traders on high alert. The index's inability to sustain rallies above key resistance levels, coupled with persistent selling pressure, suggests that the bears are currently in control. The index direction is downwards. The initial catalyst appears to be a strengthening dollar, with the DXY currently trading at 100.2. As the dollar index rises, it places downward pressure on equities, especially those with significant international exposure.
From a technical standpoint, the SP500's daily chart paints a concerning picture. The Relative Strength Index (RSI) is currently at 33.58, indicating oversold conditions. Though oversold conditions often precede a bounce, the strength of the prevailing downtrend suggests that further downside is possible before a meaningful recovery takes place. The 4H chart also shows the RSI at 37.5, indicating that a bounce is possible. Traders should watch for a divergence between price and RSI as a potential buy signal. The Moving Average Convergence Divergence (MACD) histogram also confirms the bearish bias. The MACD is a momentum indicator, and the histogram shows the difference between the MACD line and the signal line. A negative histogram indicates negative momentum, and the SP500's MACD histogram is currently deepening, suggesting that the bearish trend is accelerating. The SP500 is below the middle band. The daily ADX is at 37.61, signaling a strong downwards trend.
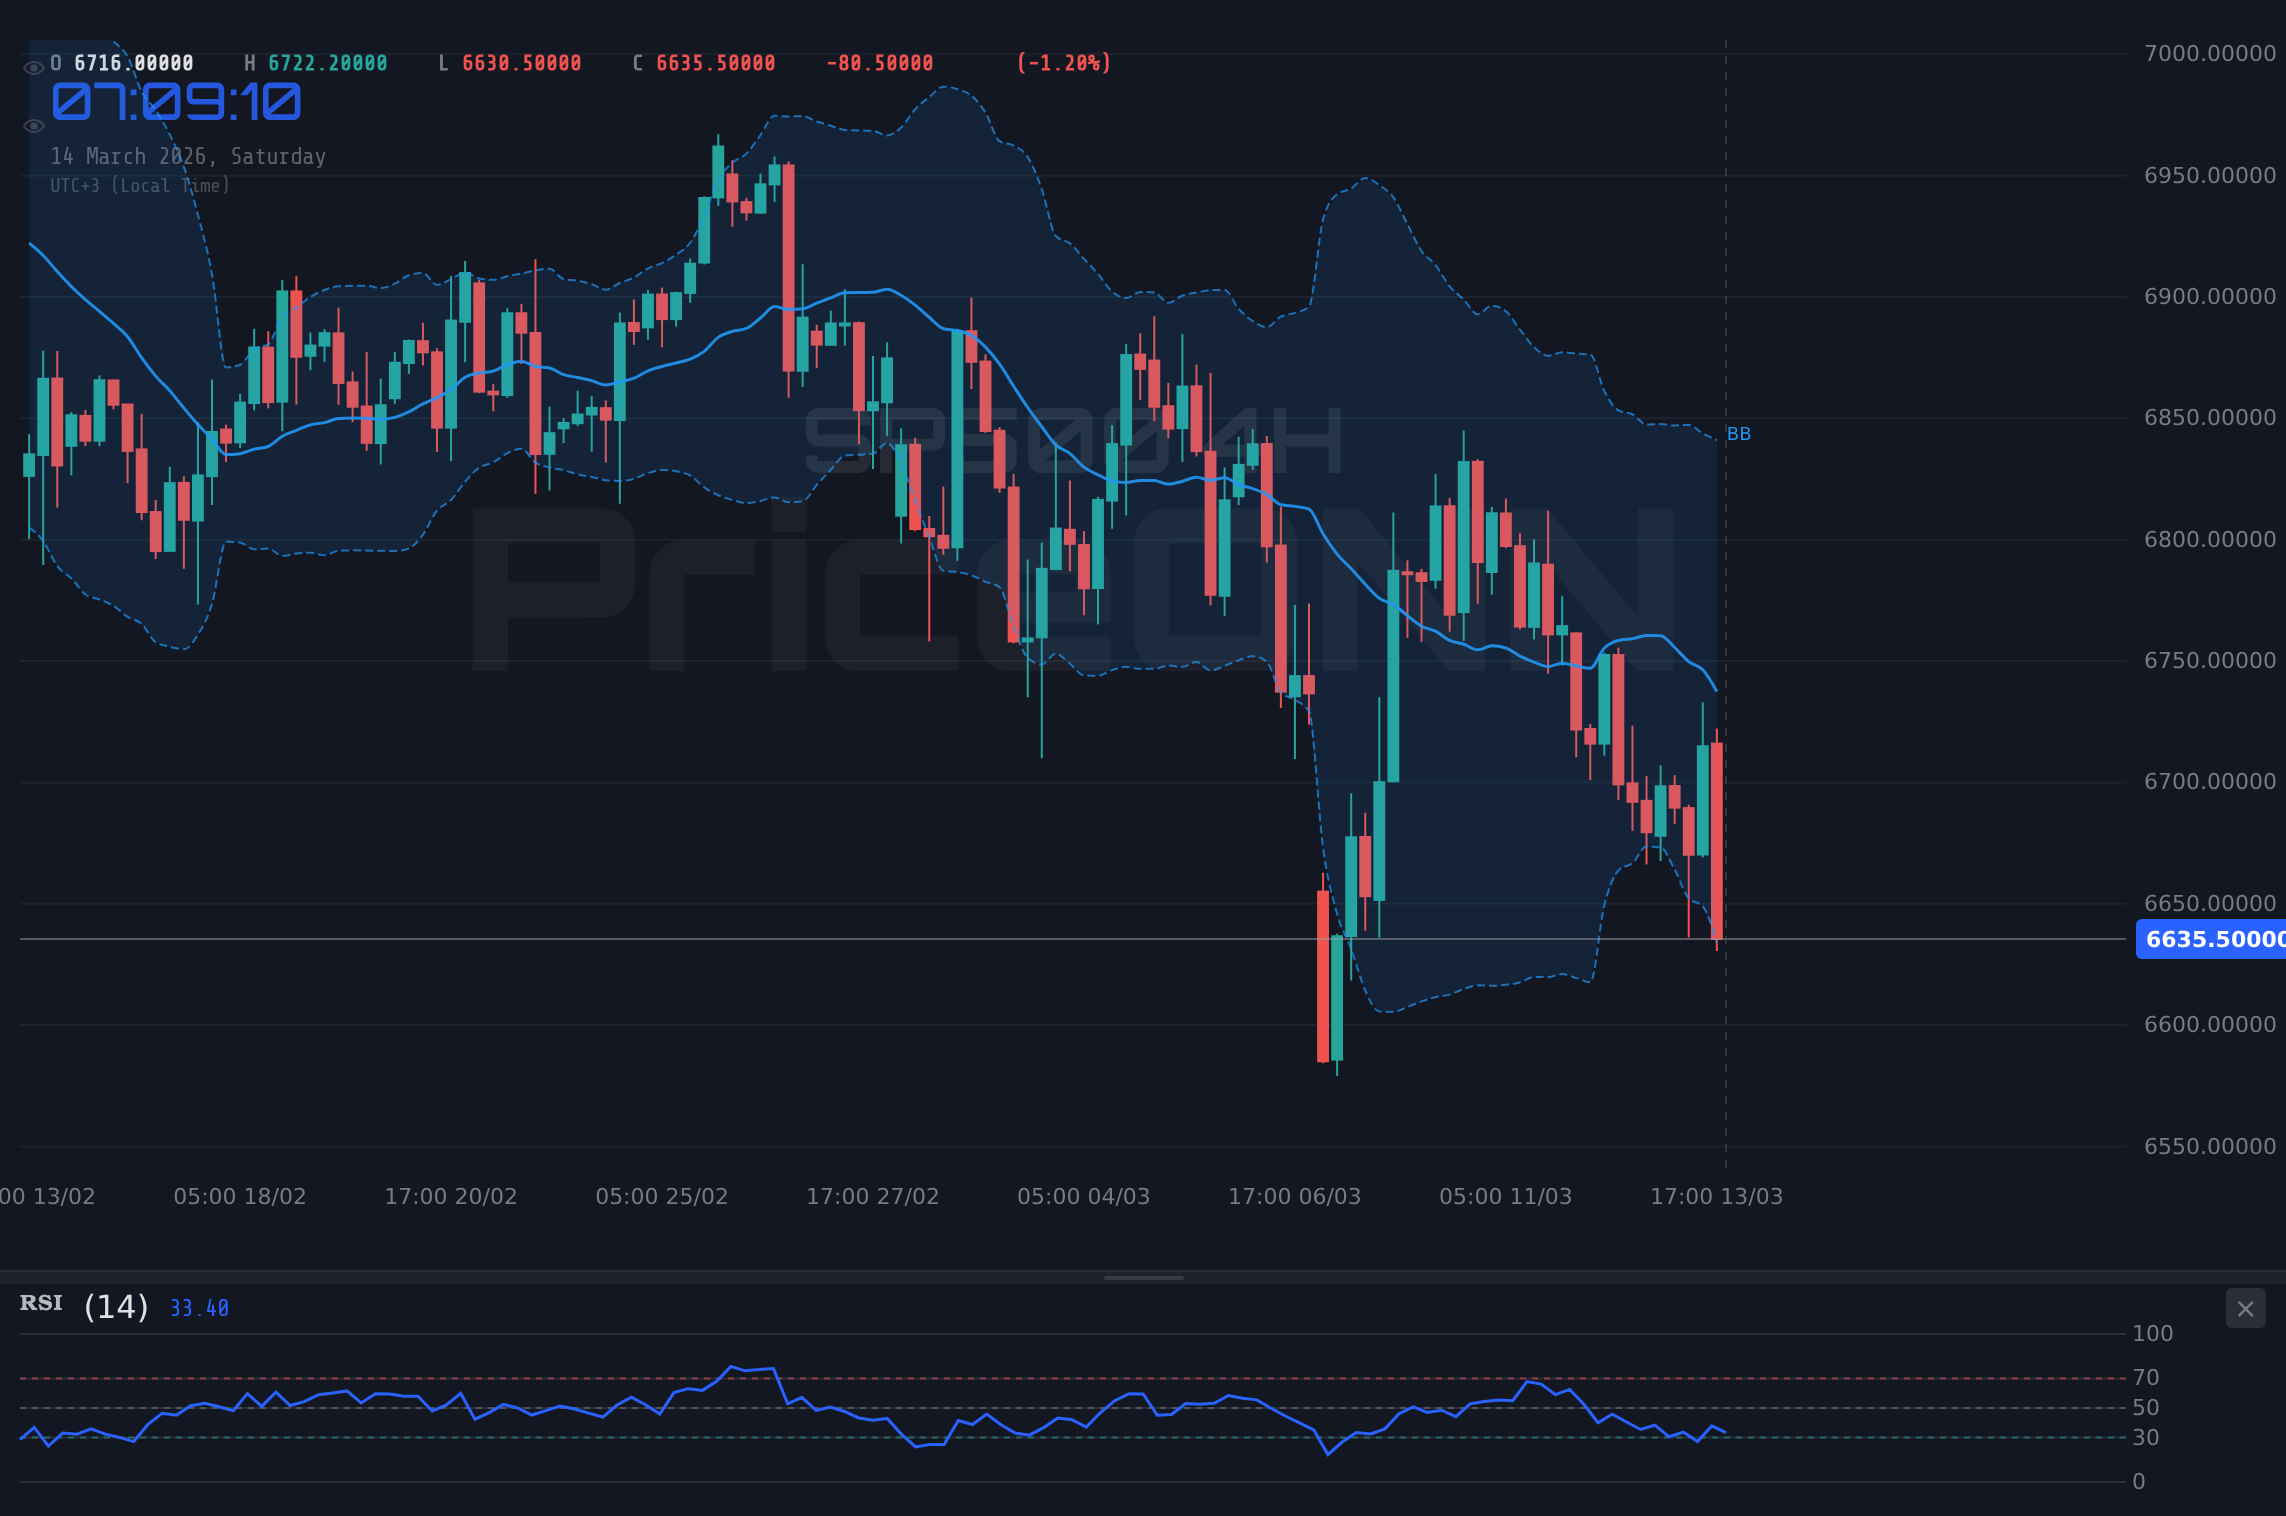
The SP500's inability to break above the $6,738.8 resistance level has further fueled bearish sentiment. This level has acted as a strong ceiling, preventing the index from mounting any sustained rallies. The failure to overcome this resistance suggests that sellers are firmly in control, and that further downside is likely. The SP500 is currently trading below its 50-day and 200-day moving averages, which is a bearish signal. The 50-day moving average is currently at $6,700, while the 200-day moving average is at $6,650. A break below these levels would confirm the bearish trend.
Key support levels to watch include $6,606.9, $6,547.6 and $6,643.2. The $6,606.9 level is particularly significant, as it represents a key area of previous consolidation. A break below this level could trigger a sharp selloff, potentially leading to further downside towards the $6,547.6 level. The SP500 has tested the $6,606.9 multiple times this week, showing how important the level is. The $6,643.2 level is the next support level to watch. On the other hand, the SP500 faces resistance at $6,738.8, $6,798.1 and $6,834.4. The $6,738.8 level is the first level of resistance. The $6,798.1 level is the next resistance level to watch. The $6,834.4 level is the final resistance level to watch.
The upcoming economic calendar will be critical in determining the SP500's near-term direction. On Wednesday, the EUR and USD will have high impact events. The markets will also be closely watching the upcoming CPI data release next week. CPI data is a key measure of inflation, and a higher-than-expected reading could trigger a hawkish response from the Federal Reserve, potentially leading to higher interest rates and further downside for equities. Conversely, a lower-than-expected CPI reading could ease concerns about inflation, potentially leading to a dovish response from the Fed and a rally in equities.
Escalating tensions in the Middle East are also casting a shadow over the SP500. News outlets report that Brent Crude is nearing $100 a barrel due to rising tensions around the Strait. The US Dollar is approaching a 10-month high due to escalating tensions in the Middle East. A major lithium find in Texas could reshape the US energy sector. The SP500 is being affected by these geopolitical tensions. Investors are closely monitoring the situation, as any further escalation could lead to increased volatility and a flight to safe-haven assets. The market is pricing in the possibility of disruptions to global trade and supply chains, which could negatively impact corporate earnings and economic growth.
The SP500's current technical picture is undeniably bearish. The index is trading below key moving averages, momentum is negative, and key resistance levels remain unbroken. However, oversold conditions and the potential for a dovish surprise from the Fed could provide a temporary reprieve. Traders should closely monitor the upcoming CPI data release and geopolitical developments, as these factors will likely play a significant role in determining the SP500's near-term direction.
Having tracked SP500 through the 2024 rate cycle, this level of selling pressure is unusual outside of true 'risk off' events. Historically, when RSI reaches this zone on SP500, the outcome has been a short-term bounce, but the current macro environment suggests that this may not be the case this time. This pattern last appeared in late 2025, when price subsequently consolidated for several weeks before breaking lower. With DXY at 100.2, SP500 is under significant pressure, but this is not the only factor at play. The current geopolitical climate is also contributing to the selling pressure.
The SP500 is currently trading at $6,625.30 and the market faces a critical juncture. The next few days will be pivotal in determining whether the index can find a bottom and stage a recovery, or whether it is destined for further downside. The SP500 is in a bearish trend. The current market conditions suggest that caution is warranted. Until the NFP data resolves this, caution is warranted.
Frequently Asked Questions: SP500 Analysis
What happens if SP500 breaks below $6,606.9 support?
A break below the $6,606.9 support level could trigger a sharp selloff, potentially leading to further downside towards the $6,547.6 level. The SP500 has tested the $6,606.9 multiple times this week, showing how important the level is.
Should I buy SP500 at current levels of $6,625.30 given RSI at 33.58?
While an RSI of 33.58 indicates oversold conditions, the strength of the prevailing downtrend suggests that further downside is possible before a meaningful recovery takes place. Traders should watch for a divergence between price and RSI as a potential buy signal.
Is the deepening negative MACD histogram a bearish signal for SP500?
Yes, the MACD histogram shows the difference between the MACD line and the signal line. A negative histogram indicates negative momentum, and the SP500's MACD histogram is currently deepening, suggesting that the bearish trend is accelerating.
How will the upcoming CPI data affect SP500 this week?
The upcoming CPI data release next week will be a major catalyst for SP500 direction. A higher-than-expected reading could trigger a hawkish response from the Federal Reserve, potentially leading to higher interest rates and further downside for equities.
Technical Outlook Summary
| Indicator | Value | Signal |
|---|---|---|
| RSI (14) | 33.58 | Oversold |
| MACD Histogram | Negative | Bearish |
| Stochastic | 34.41 | Bearish |
| ADX | 37.61 | Strong Trend |
| Bollinger | Lower Band | Watch |
Key Levels
Support Levels
Resistance Levels
Track markets in real-time
AI-powered analysis, technical indicators and real-time price data.
Join Our Telegram Channel
Breaking market news, AI analysis and trading signals instantly.
Join Channel