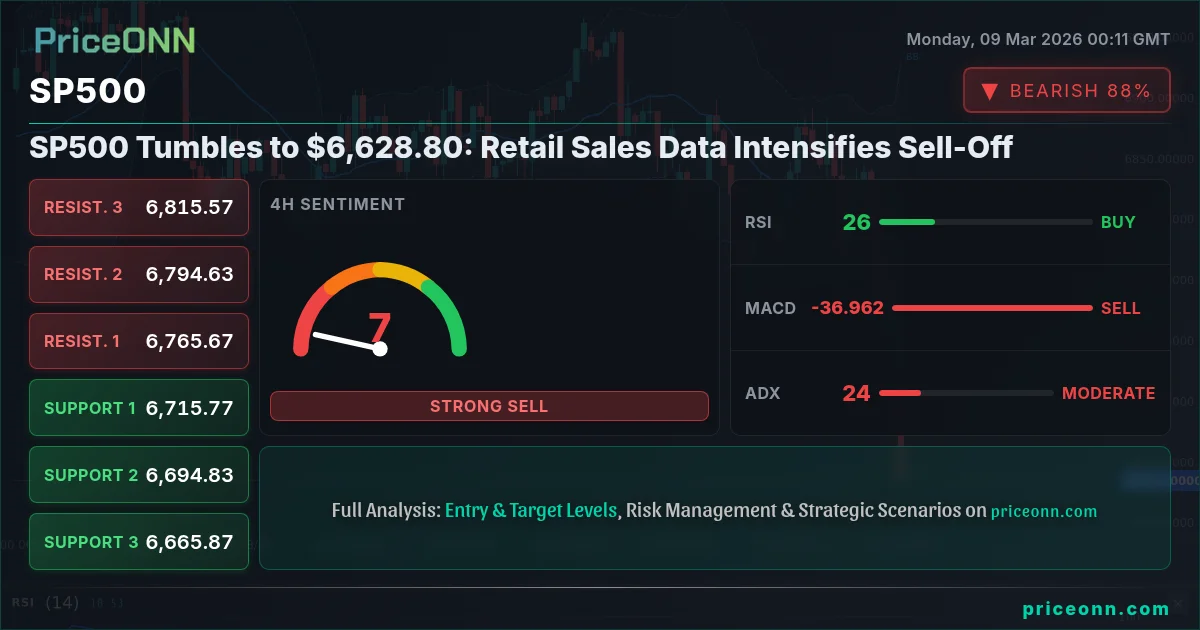
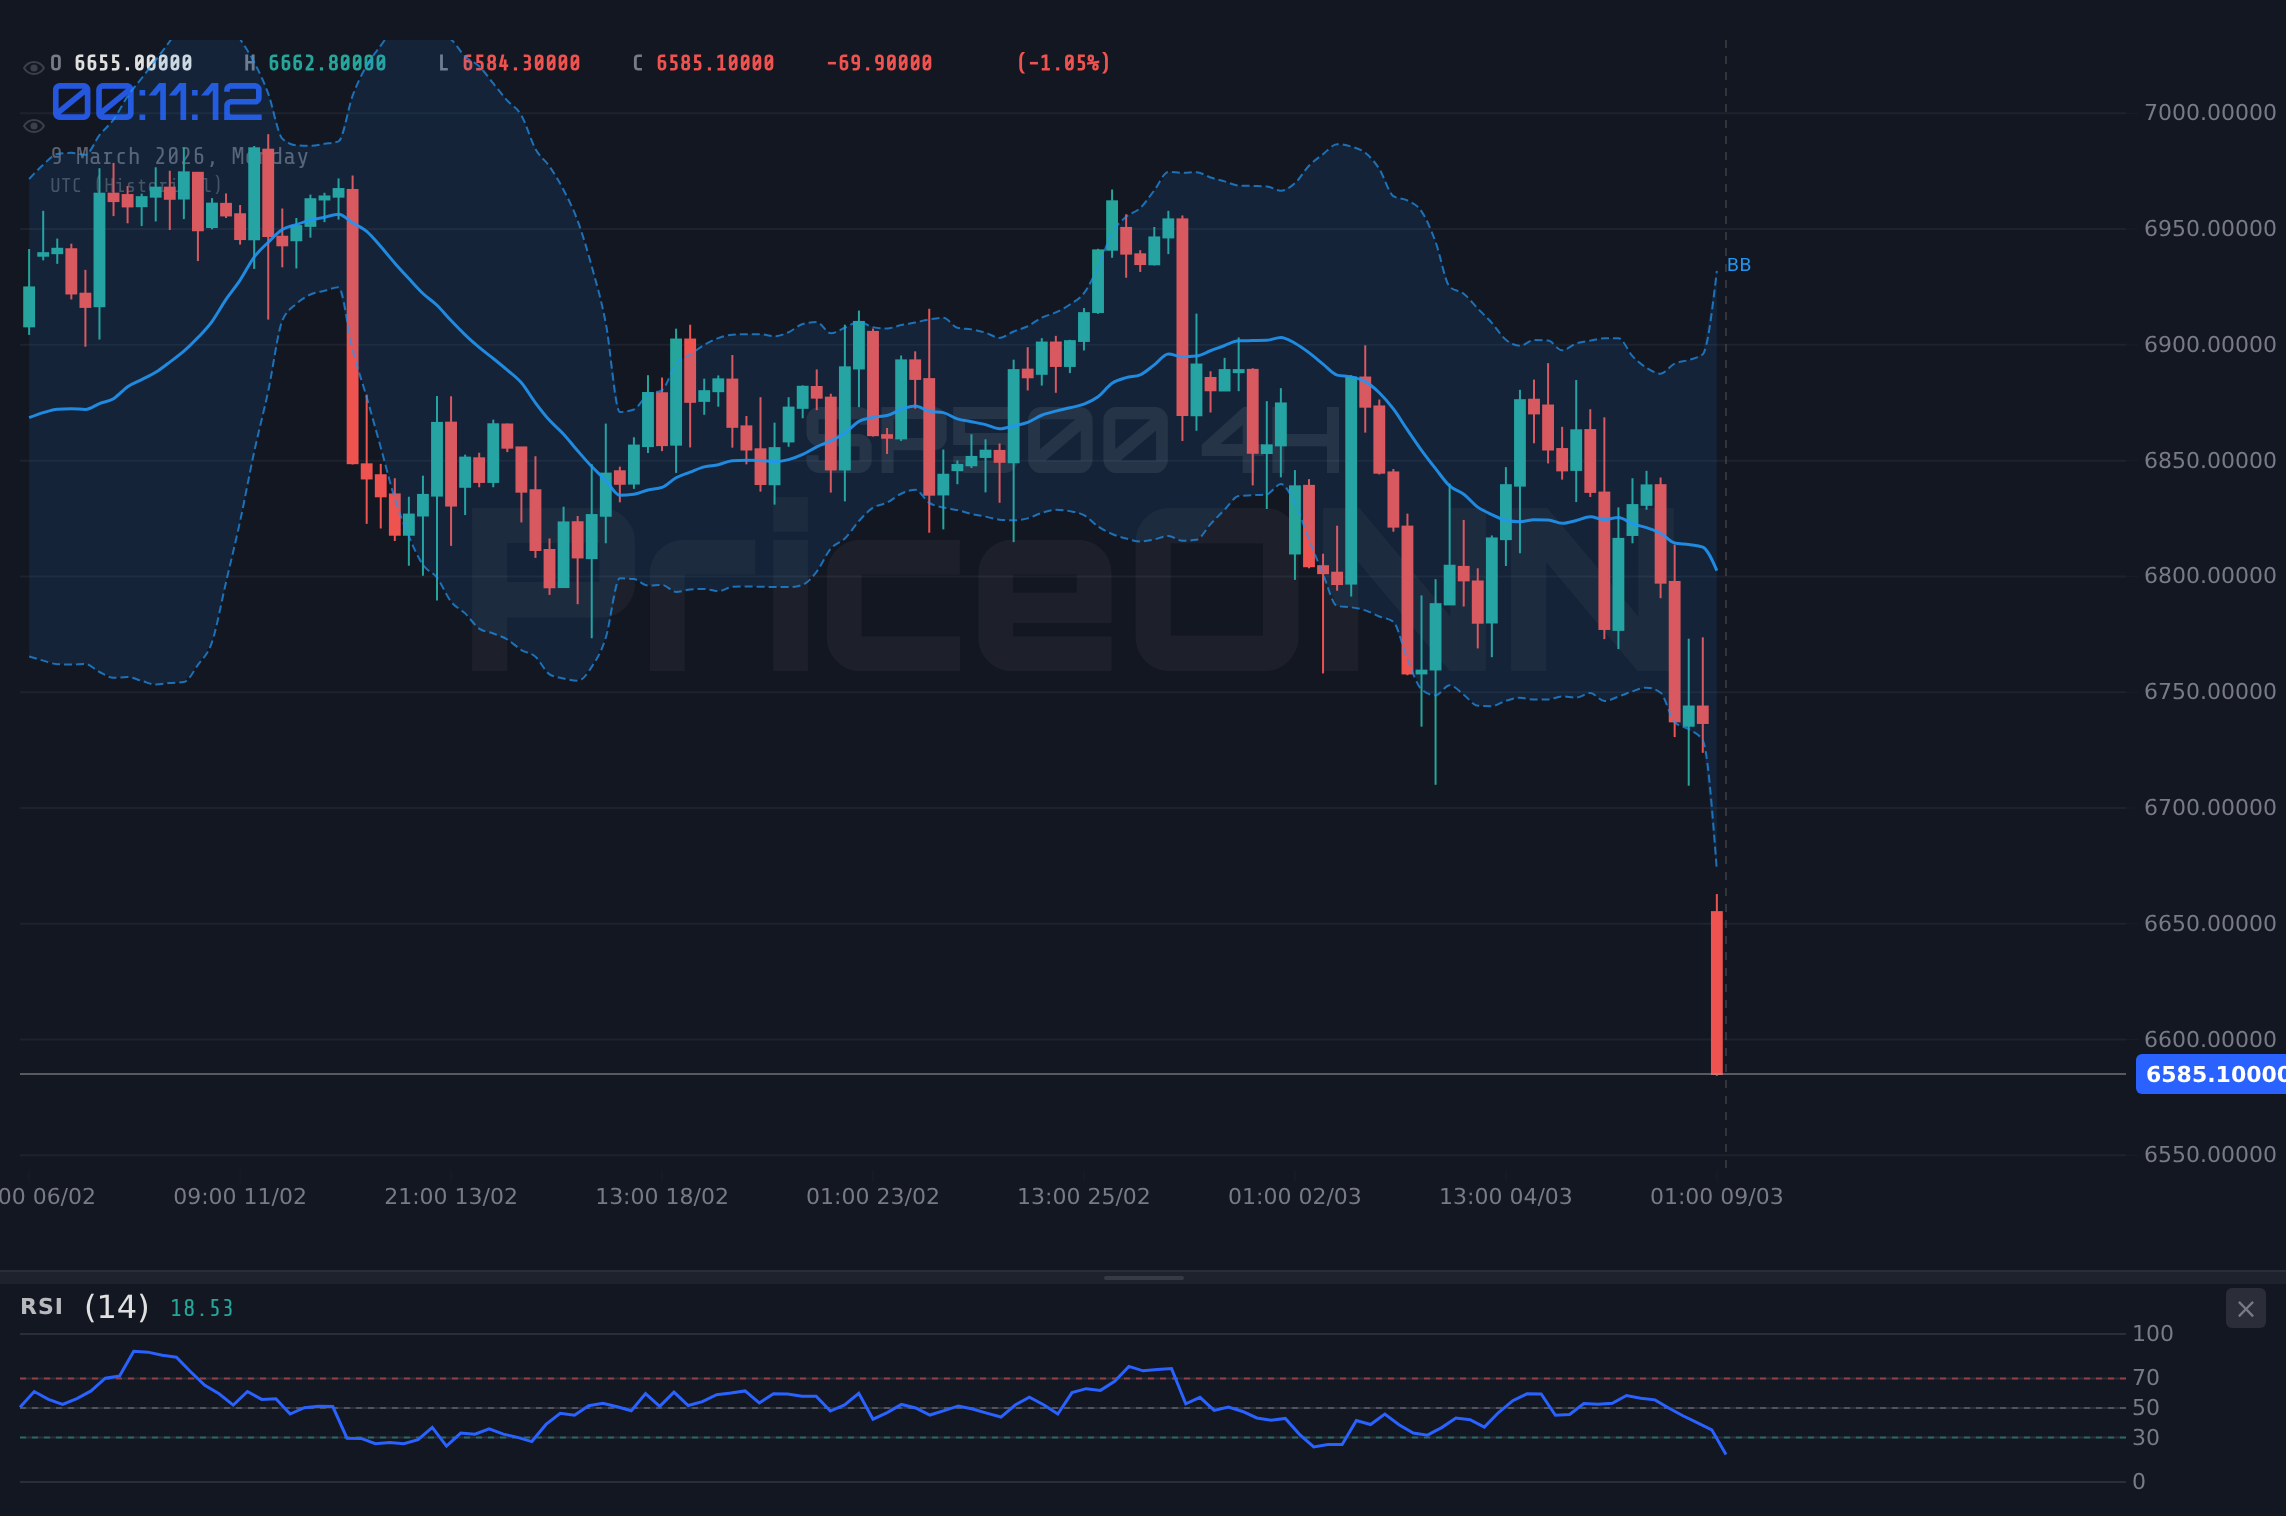
The SP500 is under significant pressure, currently trading at $6,628.80, as disappointing retail sales data fuels concerns about economic growth. The battle between bulls and bears is intensifying at this critical juncture, leaving investors wondering if this dip presents a buying opportunity or signals the beginning of a more substantial correction.
- SP500 RSI at 23.65 signals oversold conditions on the 1H chart, potentially indicating a short-term bounce.
- Key support level at 6,607.2, a break below which could trigger further downside.
- The MACD histogram shows increasing negative momentum, suggesting bearish pressure remains dominant.
- DXY strength, currently at 99.31, is exacerbating downward pressure on the SP500.
The Bullish Case for SP500 at $6,628.80
Despite the recent sell-off, there are arguments to be made for a potential SP500 recovery. One primary factor is the oversold condition indicated by the 1H RSI. At 23.65, the SP500's Relative Strength Index suggests that the market may be due for a short-term bounce as it's trading well below normal levels. This is often seen as a signal that selling pressure is exhausted, and buyers may step in to capitalize on discounted prices. The Stochastic on the 1H timeframe, with K=19.99 and D=34.91, reinforces this view, showing oversold territory.
Moreover, historical data suggests that periods of significant market downturns often lead to sharp recoveries. While past performance is not indicative of future results, the market's tendency to revert to the mean provides a degree of optimism. The SP500 has shown resilience in the face of economic uncertainty, and the current dip may be a temporary setback rather than a fundamental shift.
From a fundamental perspective, the potential for future earnings growth remains a bullish catalyst. As companies adapt to changing economic conditions and implement strategies to enhance profitability, their earnings are expected to increase, providing support for stock prices. Furthermore, the potential for interest rate cuts by the Federal Reserve could provide additional stimulus to the market, boosting investor confidence and driving prices higher.
Looking at cross-market correlations, a weakening DXY could provide some tailwind for the SP500. If the dollar index retreats from its current level of 99.31, it would alleviate some of the pressure on equities and other risk assets. Traders should monitor upcoming economic data releases, particularly inflation figures, for clues about the Fed's future policy decisions.
The Bearish Case: Why the SP500 Could Fall Further
On the other hand, there are compelling reasons to believe that the SP500's recent decline may continue. The weak retail sales data has raised concerns about the strength of the economy, suggesting that consumer spending, a key driver of economic growth, may be slowing down. This is reflected in the daily direction as bearish.
Technically, the SP500 is displaying bearish signals across multiple timeframes. The MACD on the 4H chart shows negative momentum, indicating that selling pressure remains strong. The ADX on the 1D timeframe is at 30.79, suggesting a strong downtrend is in place. Moreover, the SP500 is trading below its 200-day moving average, a key technical level that often acts as a support. A sustained break below this level could trigger further selling pressure.
Adding to the bearish sentiment is the strength of the dollar. With the DXY currently at 99.31, the dollar's strength is putting pressure on equities and other risk assets. A stronger dollar makes U.S. exports more expensive, reducing their competitiveness and potentially weighing on corporate earnings.
Geopolitical risks also loom large. Escalating tensions in the Middle East and other regions could disrupt global trade and investment, further weighing on market sentiment. As reported by several news outlets this week, the price of oil has surged due to these tensions, potentially leading to higher inflation and slower economic growth. According to Reuters, "the surge in oil prices is adding to concerns about stagflation, a combination of high inflation and low economic growth."
Technicals as Evidence: Bulls vs. Bears
Analyzing the SP500 through a multi-timeframe lens provides further insights into the battle between bulls and bears. On the 1H chart, the oversold RSI suggests a potential short-term bounce. The support level is at 6607.2. However, the MACD indicates negative momentum, suggesting that any bounce may be short-lived.
On the 4H chart, the bearish signals are more pronounced. The RSI at 28.65 indicates oversold conditions. The ADX at 22.23 showing a moderate downtrend. This is a cause for concern, as it suggests that the SP500 may be entering a period of sustained weakness.
The daily chart paints a mixed picture. The RSI is at 33.67, indicating neutral conditions. The MACD, however, shows negative momentum, and the SP500 is trading below its 200-day moving average. These factors suggest that the bears have the upper hand in the medium term.
The Stochastic is also showing bearish signals across multiple timeframes. On the 1H chart, the Stochastic is indicating a downtrend. These signals suggest that selling pressure remains strong and that the SP500 may continue to decline.
Trade Plan: Cautious Short Position
Given the bearish technical and fundamental outlook, a cautious short position may be warranted. However, traders should be mindful of the potential for a short-term bounce due to oversold conditions.
A short-term bounce occurs, with the SP500 retesting the resistance level at 6662.8. A break above this level could lead to further gains, potentially reaching the 6718.4 resistance.
The SP500 breaks below the support level at 6607.2, triggering further selling pressure. This could lead to a decline towards the next support level at 6579.4, with the potential to reach 6551.6.
Entry Trigger: Initiate a short position if the SP500 closes below the support level at 6607.2.
Target 1: 6579.4
Target 2: 6551.6
Stop/Invalidation: Place a stop-loss order above the resistance level at 6662.8 to limit potential losses.
Upcoming economic data releases, including the US data scheduled for Tuesday, could significantly impact market sentiment. Exercise caution and adjust your position accordingly.
Frequently Asked Questions: SP500 Analysis
Is SP500 a good buy right now?
Given the current bearish momentum and weak retail sales data, SP500 may not be a good buy right now. However, oversold conditions indicated by the RSI at 23.65 suggest a potential short-term bounce. Monitor the support level at 6607.2 for a potential buying opportunity.
What is the SP500 price forecast for this week?
The SP500 price forecast for this week is bearish, with the potential to decline towards the support level at 6579.4. However, a short-term bounce towards the resistance level at 6662.8 is also possible. The probability of a bearish scenario is estimated at 70%.
What are the key support and resistance levels for SP500?
Key support levels for SP500 are at 6607.2, 6579.4, and 6551.6. Key resistance levels are at 6662.8, 6690.6, and 6718.4. These levels should be closely monitored for potential trading opportunities.
Why is SP500 moving today?
SP500 is moving lower today due to weak retail sales data, which has raised concerns about the strength of the economy. Additionally, the strength of the dollar and geopolitical risks are weighing on market sentiment.
Track markets in real-time
AI-powered analysis, technical indicators and real-time price data.
Join Our Telegram Channel
Breaking market news, AI analysis and trading signals instantly.
Join Channel