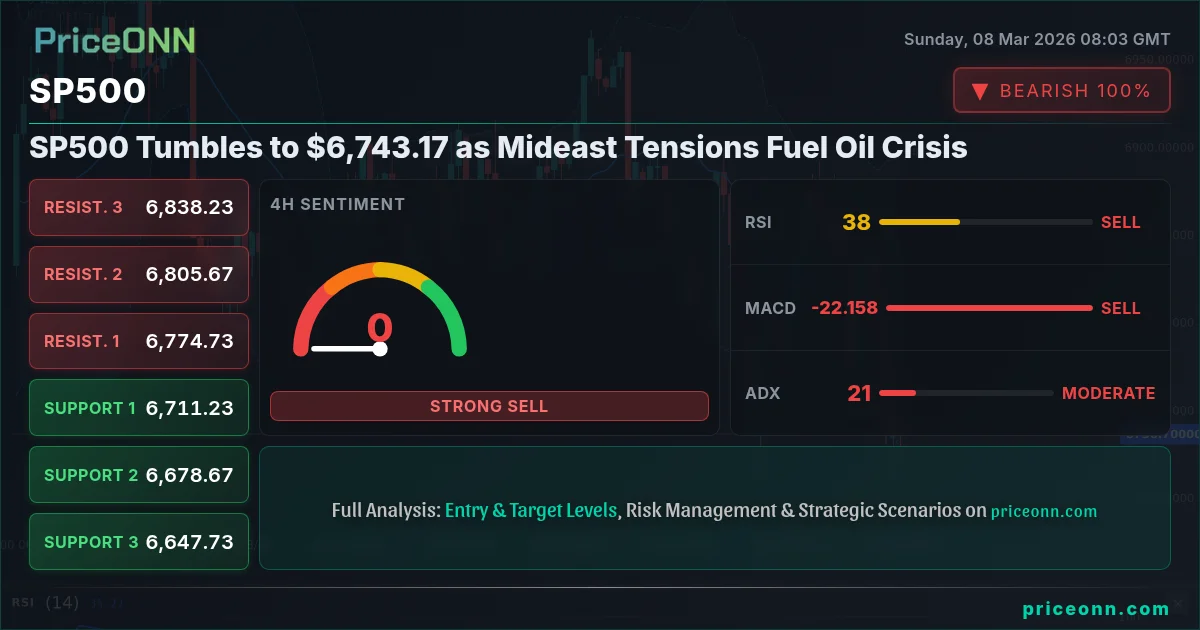
The SP500 closed last Friday at $6,743.17, a notable dip reflecting a week fraught with unsettling economic signals and escalating geopolitical turmoil. The confluence of a disappointing jobs report, coupled with a surge in oil prices driven by heightened tensions in the Middle East, has created a risk-off environment that's weighing heavily on investor sentiment. This comes as the market digests the implications of potentially higher energy costs and the impact on corporate earnings, further amplifying concerns about the overall health of the global economy.
The week's economic data painted a concerning picture, particularly the U.S. Weekly Economic & Financial Commentary, which highlighted a February jobs report that was "uniformly negative," according to PriceONN analysis. This news, combined with the broader understanding that Canadian consumer and business behavior has shifted significantly away from reliance on the U.S. after trade disputes in 2026, has injected uncertainty into the market, prompting investors to reassess their positions. Such shifts in economic behavior are critical indicators that can foreshadow broader market corrections.
Adding fuel to the fire is the escalating oil crisis, triggered by Middle East tensions. As PriceONN reported, "EUR/CAD Plunges Amidst Oil Crisis: Is This the Start of a Trend?" The sharp increase in crude oil prices, with Brent Crude nearing $90 a barrel, has significant implications for forex markets and equity valuations alike. The energy sector may benefit, but broader inflationary pressures could curtail consumer spending and corporate investment, squeezing overall economic growth. WTI currently sits at $90.66, a staggering 15.02% daily change that is unlikely to be sustained without significant economic disruption.
Technical Breakdown: SP500 at a Crossroads
From a technical perspective, the SP500 finds itself at a precarious juncture. The hourly timeframe shows a clear downtrend, with the index failing to hold above key support levels. The first level of support sits at 6739.50, which has been tested in the past hour. A break below this level could accelerate the decline, targeting the next support zone at 6725.70. Resistance is currently observed at 6770.40, which bulls need to overcome to regain some semblance of control. However, with the current market sentiment, this seems like a tall order.
The Relative Strength Index (RSI) on the 1-hour chart stands at 36.93, indicating bearish momentum but not yet oversold conditions. This suggests that there is still room for further downside before the market finds a bottom. The Moving Average Convergence Divergence (MACD) also confirms the bearish bias, with the MACD line trading below the signal line. The ADX indicator, however, tells a different story. With a reading of 19.71, the ADX suggests a weak trend. This indicator value suggests the market is choppy and potentially ranging rather than establishing a new bearish trend. This conflicting signal is why the trade recommendation is in a watch zone.
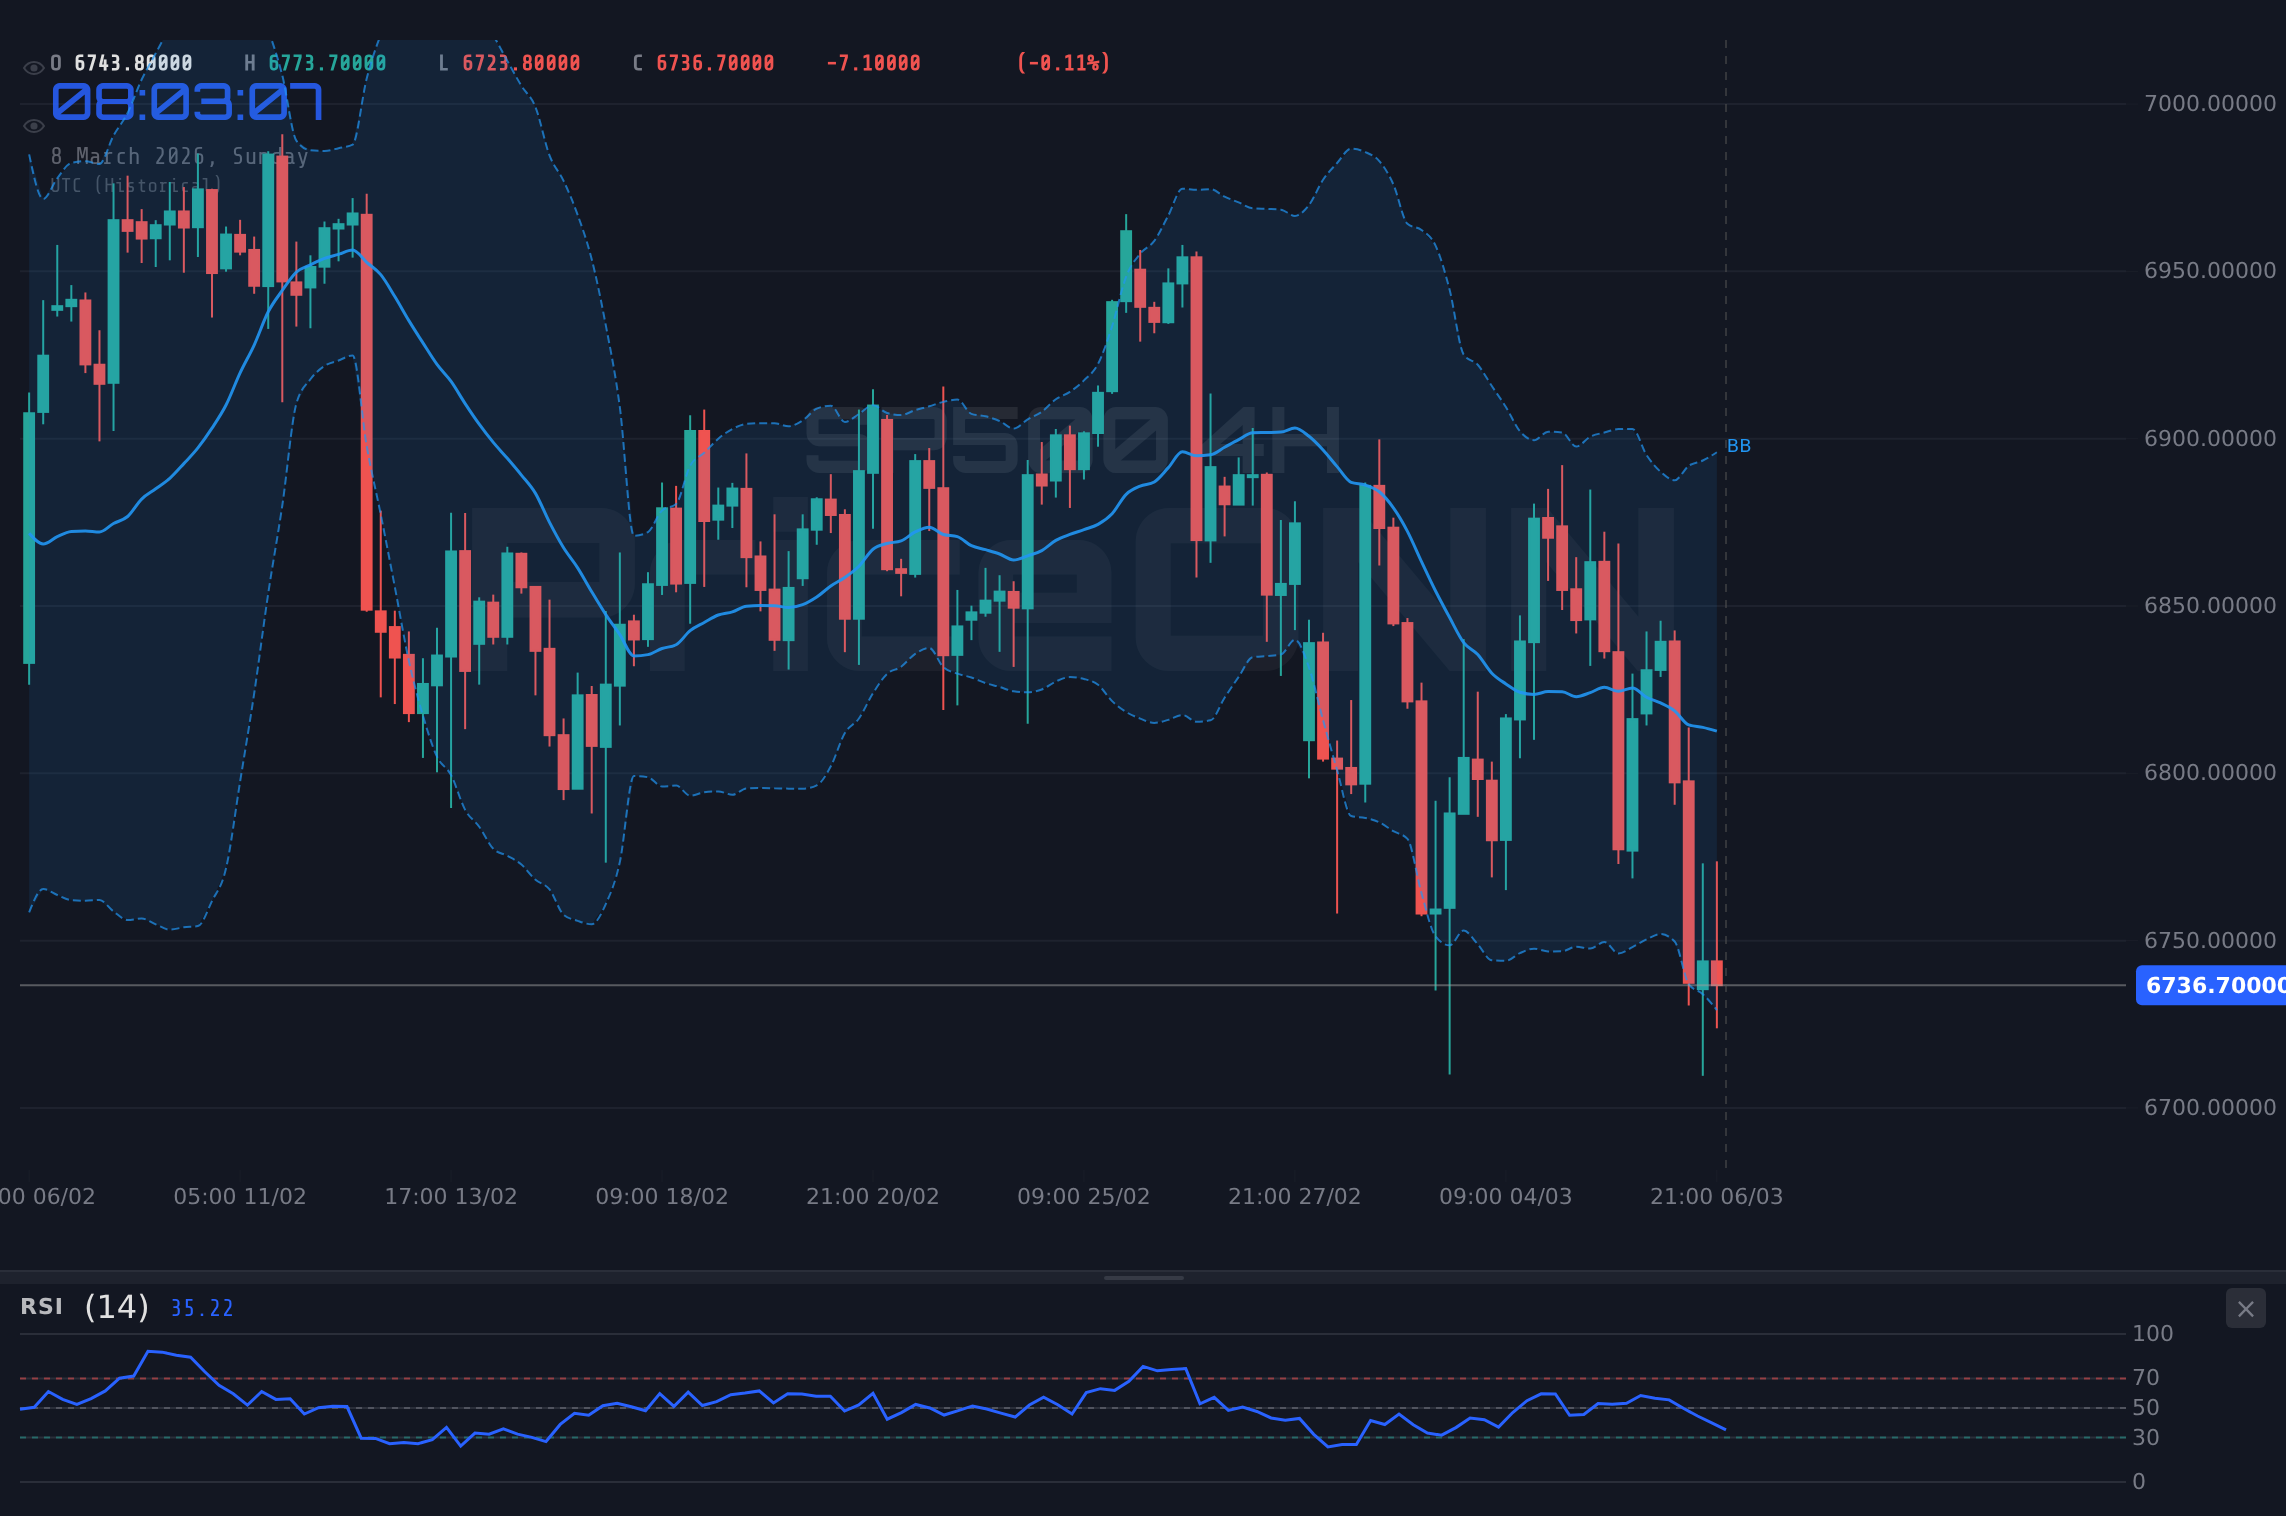
Stepping back to the 4-hour timeframe, the technical picture remains largely consistent. The SP500 is trading below its key moving averages, and the RSI at 38.41 further confirms the bearish bias. The ADX is also low on the 4-hour timeframe, indicating the market is choppy and ranging. Key support on this timeframe lies at 6707.43, a break below which could trigger a more significant sell-off. Resistance is pegged at 6790.53, which aligns with the 50-day moving average. Until the index can reclaim this level, the path of least resistance remains to the downside.
Zooming out to the daily timeframe, the SP500's vulnerability becomes even more apparent. The index has broken below a key trendline that had been in place for several months, signaling a potential trend reversal. The daily RSI at 39.59 is also trending lower, further corroborating the bearish sentiment. Key support on this timeframe lies at 6759.17, which, if broken, could pave the way for a test of the 6702.13 level. The daily ADX sits at 30.18, indicating a strong downward trend.
Risk Factors and Market Sentiment
Market sentiment is decidedly risk-averse, with investors flocking to safe-haven assets amidst the economic and geopolitical uncertainties. The dollar index (DXY) is trading lower, at 98.57, failing to capitalize on the risk-off sentiment, indicating that investors are not necessarily viewing the U.S. dollar as the ultimate safe haven. This may be due to the disappointing economic data emanating from the U.S.
The surge in oil prices is also exacerbating inflationary pressures, which could prompt central banks to adopt a more hawkish stance. Higher interest rates, in turn, could further weigh on equity valuations, creating a vicious cycle. The market will be closely watching upcoming economic data releases, particularly those related to inflation and employment, for clues about the Fed's next move. The last three days' economic data releases have been concerning, and the market is eagerly awaiting further data releases to help clear up the economic picture. The market will be especially focused on the US data being released on Tuesday and Wednesday.
Geopolitical tensions remain a significant wildcard, with the potential to trigger further market volatility. Any escalation in the Middle East conflict could send oil prices soaring and further undermine investor confidence. Investors should closely monitor news headlines and be prepared to adjust their positions accordingly.
Trade Recommendation: Watch Zone
Given the conflicting technical signals and the prevailing risk-averse sentiment, a cautious approach is warranted. The ADX reading of 19.71 on the hourly chart suggests that the market is choppy and lacking a clear trend. While the RSI and MACD histogram are aligned in a bearish direction, the Stochastic indicator is in a tradeable zone, neither overbought nor oversold. This suggests that any short-term rallies could be short-lived.
A daily close above 6770.40, the 1-hour resistance, would open the door for a potential test of the 50-day moving average, currently hovering around 6790.53. However, until this level is decisively breached, the bears remain in control. Traders should remain patient and wait for further confirmation before initiating any new positions. The choppy market conditions, as indicated by the ADX, increase the risk of stop-outs and whipsaws.
Key Levels
Support Levels
Resistance Levels
Economic Calendar and Next Week's Outlook
Looking ahead, investors will be closely monitoring a slew of economic data releases for further clues about the health of the global economy. The upcoming JPY data on Monday and USD data on Tuesday will be particularly important. Any surprises could trigger sharp market reactions. The market is pricing in a high probability of further interest rate hikes by the Federal Reserve, but this could change depending on the data.
In addition to economic data, geopolitical developments will also remain a key focus. Any de-escalation in the Middle East conflict could provide a boost to risk sentiment, while further escalation could exacerbate market volatility. Investors should remain nimble and be prepared to adjust their positions based on the latest news flow.
Bearish Scenario
If the SP500 fails to hold above the 6739.50 support level, a bearish scenario could unfold. The next support level to watch is 6725.70, followed by 6708.60. A break below 6708.60 could trigger a more significant sell-off, targeting the 6600 level. The bearish scenario would be invalidated if the SP500 can reclaim the 6770.40 resistance level.
Bullish Scenario
In a bullish scenario, the SP500 would need to break above the 6770.40 resistance level and sustain that momentum. A successful breakout could pave the way for a test of the 6787.50 level, followed by 6801.30. The bullish scenario would be invalidated if the SP500 fails to hold above the 6739.50 support level.
Technical Outlook Summary
| Indicator | Value | Signal |
|---|---|---|
| RSI (14) | 36.93 | Bearish |
| MACD Histogram | Negative | Bearish |
| Stochastic | 34.44 | Bullish |
| ADX | 19.71 | Weak Trend |
| Bollinger | Middle Band | Watch |
Frequently Asked Questions: SP500 Analysis
Is SP500 a good buy right now?
Given the current bearish sentiment and the conflicting technical signals, SP500 is not a clear buy right now. Traders should wait for a confirmed breakout above 6770.40 resistance or a clear bottoming pattern before initiating new long positions.
What is the SP500 price forecast for this week?
The SP500 price forecast for this week is highly uncertain, depending on the upcoming economic data releases and geopolitical developments. A break above 6770.40 could target 6787.50, while a break below 6739.50 could target 6725.70.
What are the key support and resistance levels for SP500?
Key support levels for SP500 are 6739.50, 6725.70, and 6708.60. Key resistance levels are 6770.40, 6787.50, and 6801.30. These levels should be monitored closely for potential breakouts or breakdowns.
Why is SP500 moving today?
The SP500 is moving lower today due to a combination of factors, including disappointing economic data, rising oil prices due to tensions in the Middle East, and a general risk-off sentiment in the market.
Track markets in real-time
AI-powered analysis, technical indicators and real-time price data.
Join Our Telegram Channel
Breaking market news, AI analysis and trading signals instantly.
Join Channel