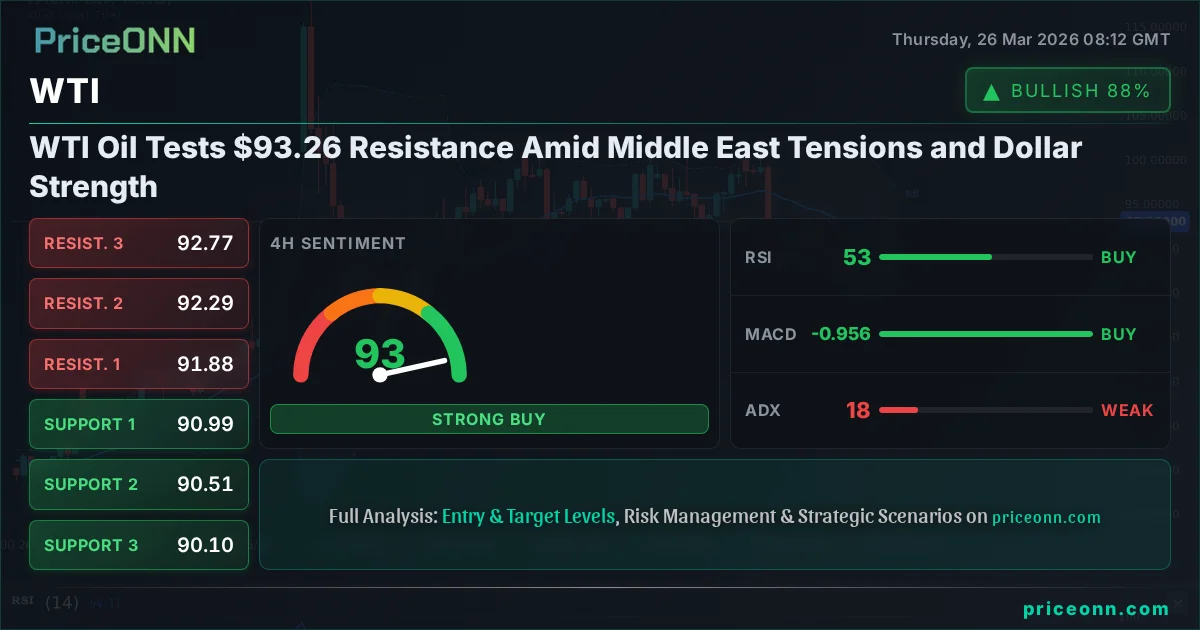
WTI crude oil is currently trading at $93.26, finding itself at a critical juncture as geopolitical tensions in the Middle East intensify, while the U.S. Dollar Index (DXY) shows renewed strength. This complex interplay of factors creates a volatile environment, demanding a nuanced approach from traders and investors. The current price action places WTI squarely near a significant resistance level, making the coming days pivotal for its short-term trajectory. Understanding the drivers behind this price action - from supply fears to currency movements and broader market sentiment - is crucial for navigating this challenging landscape.
- WTI crude oil is currently trading at $93.26, near a key resistance level.
- Escalating Middle East tensions are creating supply deficit fears, supporting oil prices, with Brent crude at $103.40.
- The strengthening U.S. Dollar Index (DXY) at 99.52 is acting as a headwind for dollar-denominated commodities like WTI.
- Technical indicators show mixed signals across timeframes, with the 1D ADX at 62.6 indicating a very strong uptrend, but shorter timeframes suggest caution.
- The market is keenly watching for any signs of de-escalation in the Middle East or shifts in Federal Reserve policy expectations.
The Bull's Roadmap: Navigating Towards Higher Ground
Why WTI Volatility Analysis Points to a Potential Breakout
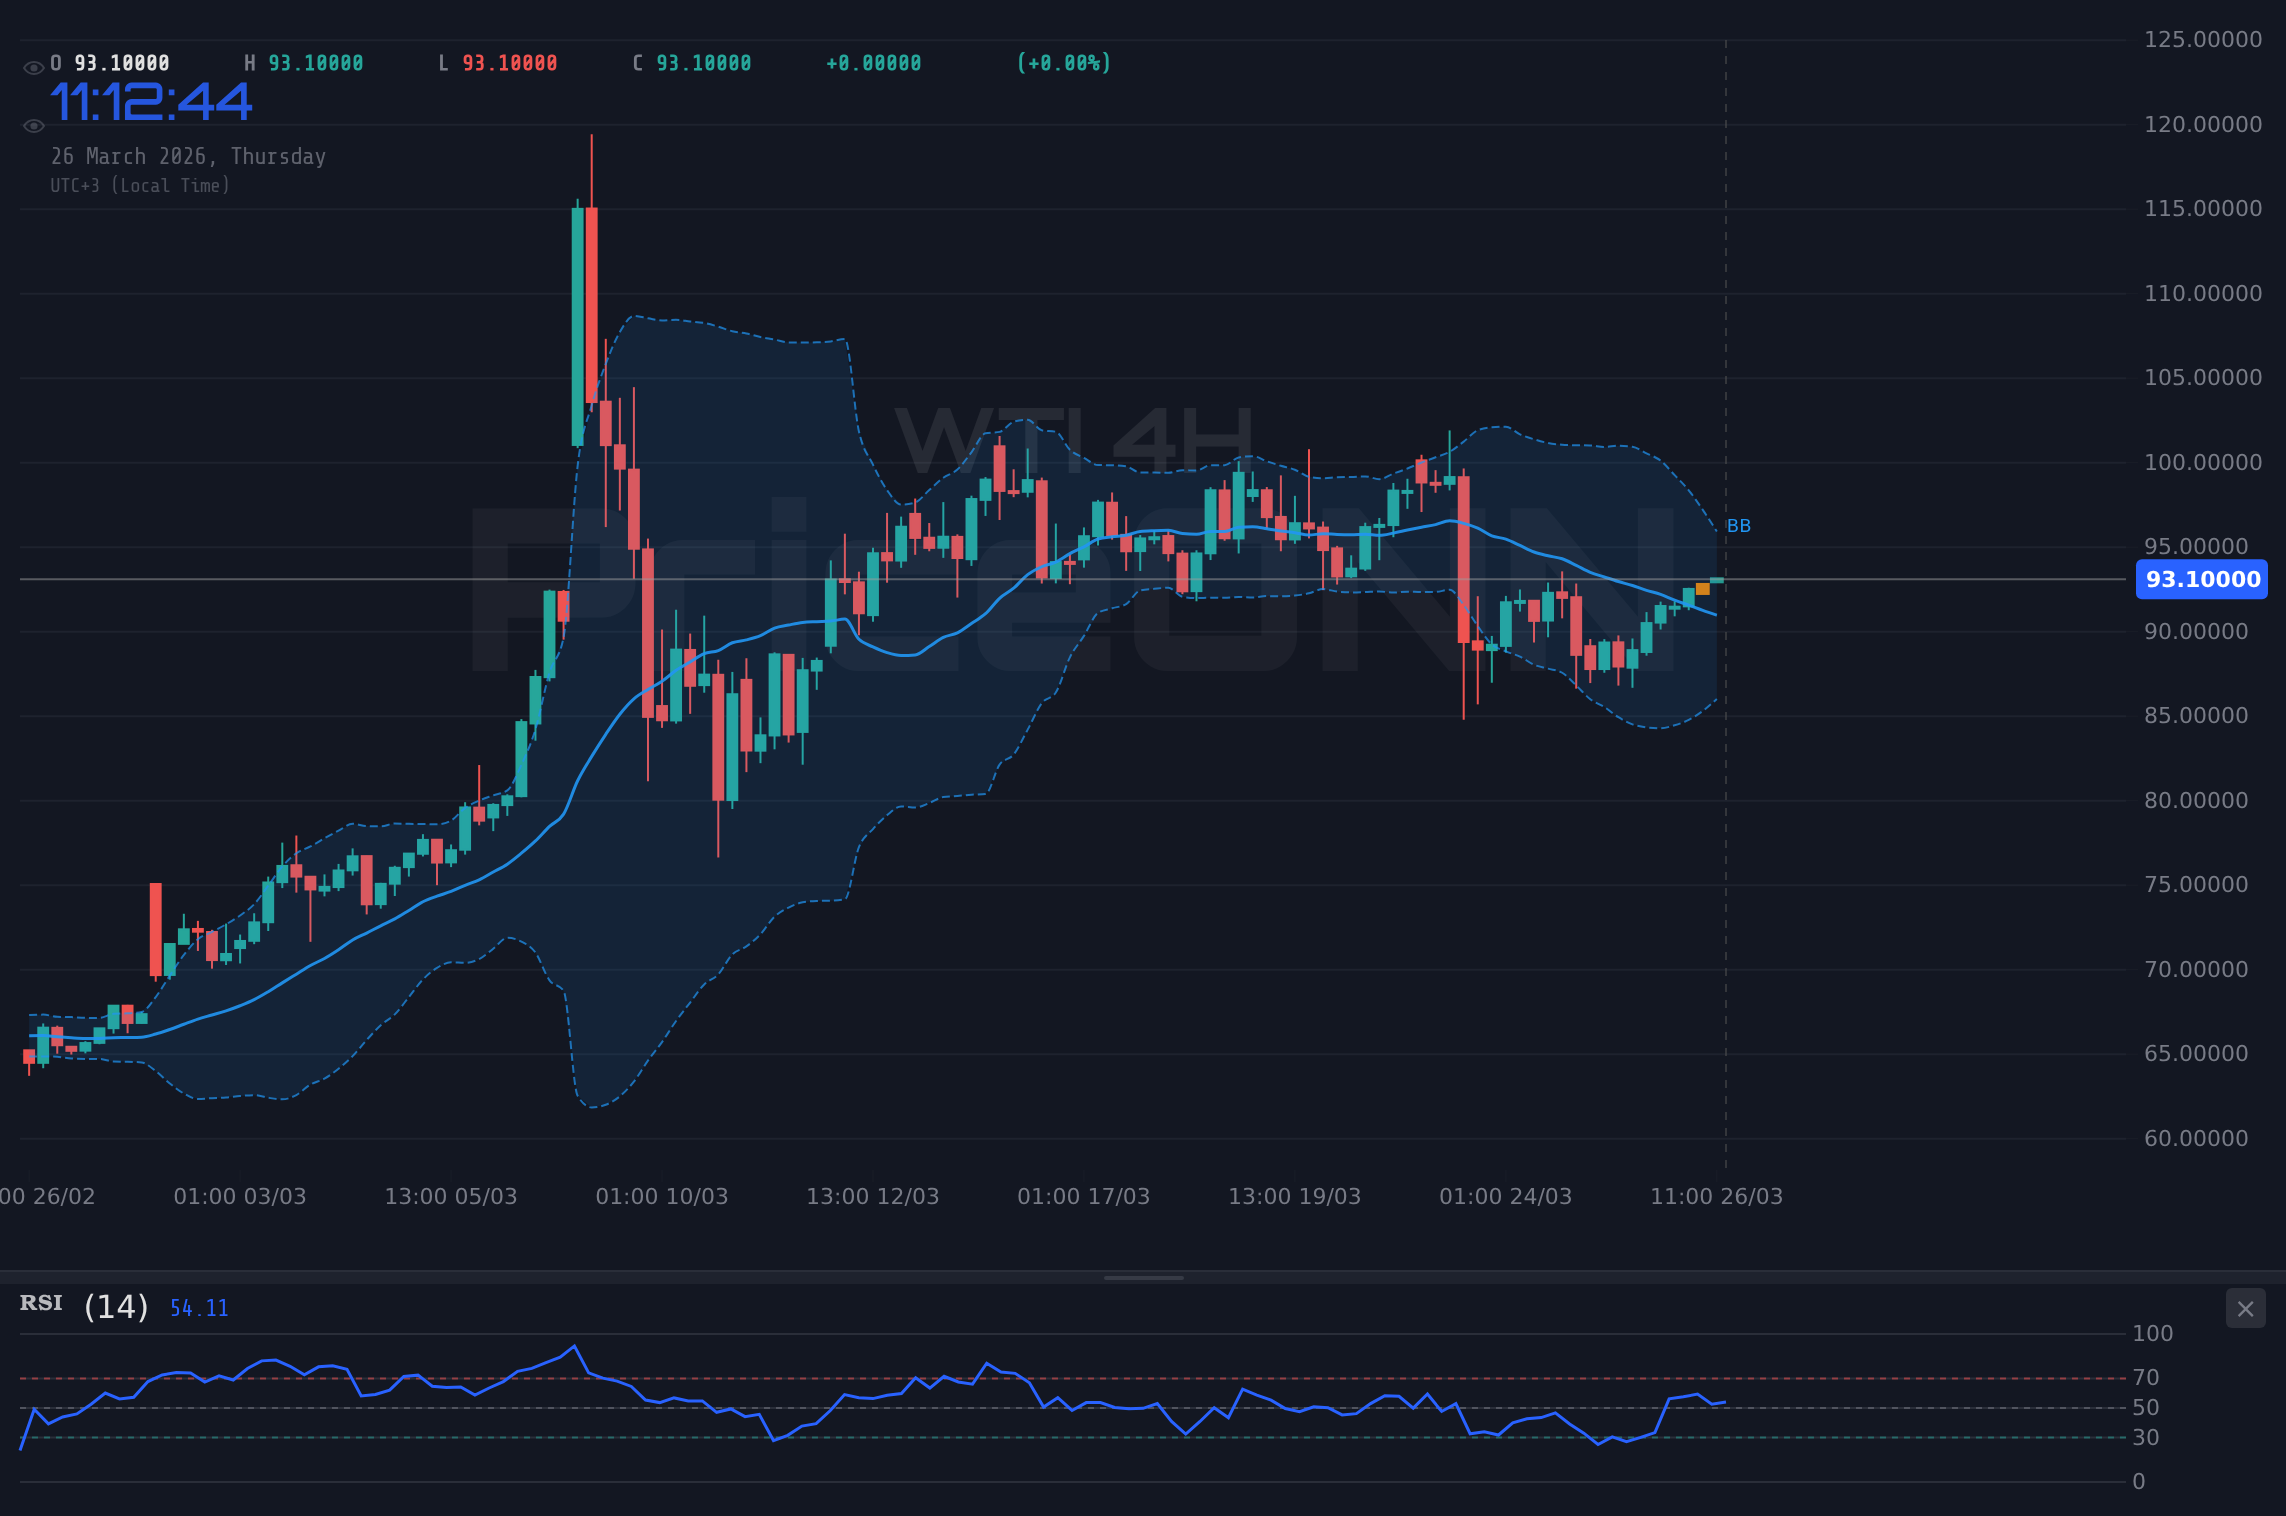
The immediate focus for WTI traders is the $93.26 mark. Currently, the market sentiment appears cautiously optimistic, driven primarily by persistent geopolitical risks in the Middle East. The ongoing conflict has disrupted a significant portion of global LNG trade, as highlighted by recent news suggesting a multi-year supply deficit. This fundamental supply-side pressure is a powerful tailwind for oil prices. When we look at the 1-day (1D) technicals, the picture is decidedly bullish. The ADX stands at a robust 62.6, signaling a very strong uptrend. This suggests that underlying momentum is firmly in place. Furthermore, the 1D RSI at 63.88 is comfortably in neutral territory, not yet showing signs of overbought conditions that might signal a reversal. The MACD, while showing negative momentum on the 1D chart, is still above its signal line on the 4-hour timeframe, indicating potential for upward continuation. The Stochastic Oscillator on the 1D chart, with %K at 24.5 and %D at 50.89, is signalling a potential shift upwards after a period of decline, though it's still below the 50-level. This confluence of a strong underlying trend and room for upward momentum suggests that a bullish scenario is certainly on the table, provided key conditions are met.The narrative supporting a bullish WTI outlook is multi-faceted. Geopolitical risk premium remains a dominant factor. Any hint of further escalation in the Middle East, or indeed any significant supply disruption event globally, could send prices surging. News reports have indicated that the conflict has halted 20% of global LNG trade, a stark reminder of the fragility of energy supply chains. This fundamental tightness in the market provides a solid floor. From a technical perspective, breaking decisively above the current resistance zone around $93.26 would be a significant psychological and technical event. The 1D chart shows resistance levels at $103.49, $105.37, and $108.66. A sustained move above $93.26, ideally with increasing volume, could open the door for a retest of these higher levels. The fact that WTI is showing a strong uptrend on the daily chart, as indicated by the ADX, suggests that if a catalyst emerges, the price could move rapidly. The $93.26 level itself is not just a technical resistance; it represents a psychological barrier that, once breached, could trigger a fresh wave of buying interest.
The Bull's Roadmap: Targeting Higher Ground
For WTI to sustain its upward momentum and challenge higher resistance levels, several conditions must be met. Firstly, the geopolitical situation in the Middle East needs to either remain tense or escalate further, thus maintaining or increasing the risk premium priced into oil. Secondly, the U.S. Dollar Index (DXY), currently at 99.52, needs to stabilize or even weaken. A strong dollar typically acts as a drag on dollar-denominated commodities like oil, making them more expensive for holders of other currencies. The current DXY uptrend, however, might be reaching overbought territory on shorter timeframes (1H RSI at 66.16, though still below the 70 threshold), which could offer a temporary reprieve for oil bulls. On the technical front, a clear break and hold above $93.26 is paramount. This level has acted as a ceiling, and a convincing move above it, ideally with strong volume confirmation, would signal the start of a new bullish leg. The 4-hour chart, while showing mixed signals with a neutral trend strength of 50%, has its Stochastic Oscillator in an oversold condition, suggesting potential for an upward bounce. If WTI can clear $93.26, the next significant resistance levels identified in the data are $103.49, followed by $105.37. A move towards these levels would require sustained buying pressure and potentially further supply-side disruptions or a significant shift in global risk sentiment.The path to $103.49 and beyond is not without obstacles. While the daily trend is strong, shorter timeframes present a more cautious picture. The 1-hour chart shows a neutral trend with an ADX of 21.22, and the RSI at 69.35 is approaching overbought territory, suggesting that a short-term pullback or consolidation is possible before any significant upward move. The Stochastic on the 1-hour chart is in extreme overbought territory (K=92.2, D=91.11), strongly indicating a potential short-term reversal or consolidation. This divergence between the strong daily trend and the overbought short-term indicators highlights the need for patience and confirmation. Traders looking to enter on the long side should ideally wait for a clear break above $93.26, followed by a successful retest of this level as support. Alternatively, a dip towards the 1-hour support at $92.47 could offer a lower-risk entry point if it holds firm and shows signs of reversal, aligning with the broader bullish trend. The key is to avoid chasing the price if it rallies sharply without confirmation, given the overbought conditions on shorter timeframes.
Where Bears Take Control: The Case for a WTI Pullback
While the long-term trend for WTI appears bullish, several factors could trigger a significant pullback, invalidating the optimistic scenario. The most immediate headwind is the strength of the U.S. Dollar. The DXY is currently at 99.52 and showing a strong uptrend on the 1-hour and daily charts. A continued rally in the dollar, perhaps fueled by hawkish signals from the Federal Reserve or a flight to safety, would put considerable downward pressure on WTI. The 1-hour RSI for DXY is at 66.16, nearing overbought levels, and the Stochastic is K=69.27, D=72.2, indicating a potential short-term pullback in the dollar, but the overall trend remains upward. If the DXY breaks above its 1D resistance at 99.51 and pushes towards 100.11, it could easily drag WTI lower. Furthermore, any signs of de-escalation in the Middle East, or confirmation that supply disruptions are less severe than feared, could remove the geopolitical risk premium that is currently supporting prices. Even a slight easing of tensions could lead to significant profit-taking by traders who have piled into oil longs based on fear.From a technical standpoint, the $93.26 level represents a significant hurdle. If WTI fails to break decisively above this resistance, it could face rejection, leading to a reversal. The 4-hour chart presents a mixed picture, but the ADX at 34.86 indicates a strong downtrend on this timeframe, contradicting the daily trend. The 4-hour RSI is at 42.71, suggesting room for a decline, and the Stochastic is K=55.02, D=75.38, showing a clear bearish signal (%K
The Bear's Exit Strategy: Levels to Watch for a Downturn
For the bearish scenario to materialize, WTI needs to show a clear inability to hold above the $93.26 resistance. A failure to break higher, followed by a close below the 1-hour support at $92.47, would be the first sign of weakness. This could trigger a move towards the 4-hour support levels, starting with $91.31. A decisive break below $90.99 would confirm a bearish shift and open the path towards the daily support at $88.21. The invalidation of the bullish thesis would occur if WTI fails to hold above $90.99, suggesting that the upward momentum has been fully reversed. In such a scenario, traders might look to short WTI with targets at $88.21 and potentially lower, towards $84.89, if the broader market sentiment turns significantly risk-off or if geopolitical tensions ease unexpectedly. The ADX on the 4-hour chart at 34.86 supports the idea of a strong trend, which, if downward, could lead to a rapid price decline. The conflicting signals between daily and shorter timeframes mean that a break of key levels will be crucial for determining the next direction.The Waiting Game: Consolidation and Range-Bound Dynamics
In the absence of a clear directional catalyst, WTI could enter a period of consolidation, trading within a defined range. This scenario is plausible given the conflicting signals across different timeframes and the delicate balance between bullish supply-side factors and bearish dollar strength. The 1-hour chart, with its neutral trend and ADX of 21.22, suggests a lack of strong directional conviction on that timeframe. Similarly, the 4-hour chart shows a neutral trend with a weak ADX of 20.18. This combination points to sideways price action, where WTI might oscillate between immediate support and resistance levels without a sustained move in either direction. The immediate support is found around $92.47 on the 1-hour chart, while resistance is capped near $93.26. If these levels hold, WTI could trade within a range defined by these boundaries. Such a range-bound environment often occurs when markets are awaiting significant news, such as a major economic data release or a definitive development in geopolitical hotspots. During this phase, volatility might decrease, and traders might focus on range-bound strategies, buying near support and selling near resistance, although the strong daily trend suggests that any consolidation might be temporary.The key to identifying a consolidation phase lies in observing the market's reaction to key levels. If WTI repeatedly tests $93.26 and fails to break through, while also finding strong bids around $92.47, it confirms a range-bound market. The ADX on the 1-hour and 4-hour charts, both below 25, supports the idea of a weak trend or consolidation. This suggests that breakout attempts may be false or short-lived. For traders, this period requires patience. Scalpers might find opportunities within the range, but swing traders might prefer to wait for a clear breakout from this consolidation pattern. The overall market sentiment also plays a role. If risk appetite remains subdued, the dollar's strength could cap oil prices, while persistent Middle East tensions could provide a floor, keeping WTI within a tight band. The absence of strong directional signals from indicators like MACD on shorter timeframes further supports the consolidation hypothesis. It’s a period of watchful waiting, where the market digests existing information and gathers strength for the next significant move.
Market Sentiment and Intermarket Correlations: The Bigger Picture
Understanding WTI's price action requires looking beyond the immediate oil market and examining broader correlations and sentiment. The U.S. Dollar Index (DXY) is a critical factor. Currently at 99.52, its upward trajectory is a significant headwind for WTI. As the dollar strengthens, oil becomes more expensive for international buyers, potentially dampening demand. The DXY's rally is partly driven by expectations surrounding the Federal Reserve's monetary policy. Any indication that the Fed might maintain a hawkish stance or delay rate cuts could further boost the dollar and pressure oil. Conversely, dovish signals or a pivot towards rate cuts would likely weaken the dollar and support WTI. The correlation between WTI and the DXY is typically inverse, meaning a stronger dollar often leads to lower oil prices, and vice versa. The current market data shows DXY in an uptrend on daily and hourly charts, reinforcing the bearish pressure on WTI from this angle.Equities, particularly the S&P 500 and Nasdaq, serve as a barometer for risk appetite. The S&P 500 is currently trading at 6568.65, showing a daily decline, suggesting a risk-off sentiment in the broader market. A sustained selloff in equities typically correlates with increased demand for safe-haven assets and can put downward pressure on riskier commodities like oil, although the geopolitical risk premium can sometimes override this correlation. The fact that WTI is showing a strong daily uptrend despite a risk-off environment in equities highlights the dominance of supply-side concerns and geopolitical factors. Brent crude, trading at $103.40, is also experiencing a rally, reinforcing the bullish sentiment in the oil complex. The spread between WTI and Brent remains a key indicator; a widening spread could signal specific supply issues in the U.S. or increased demand for global benchmarks. Geopolitical news from the Middle East, such as the recent reports of escalating conflict and its impact on LNG trade, directly fuels inflation fears, potentially influencing central bank policies and further impacting the dollar and oil prices. This interconnectedness means that a holistic view, incorporating currency, equity, and geopolitical dynamics, is essential for a comprehensive WTI analysis.
What I'm Watching This Week: Key Triggers for WTI
As WTI hovers around $93.26, the market is on tenterhooks, awaiting clear directional signals. Several key factors will dictate its path in the coming days. Firstly, the geopolitical situation in the Middle East remains the primary wildcard. Any significant development, whether a de-escalation or further escalation, could dramatically shift sentiment and price action. Traders should monitor headlines closely for news regarding Iran, OPEC+ dynamics, and any direct impact on oil production or shipping routes. Secondly, the trajectory of the U.S. Dollar Index (DXY) will be crucial. With the DXY showing strength, a sustained move above 99.51 could trigger further downside pressure on WTI. Conversely, a pullback in the dollar, perhaps due to shifting Fed expectations or profit-taking, could provide a tailwind for oil. Pay close attention to any commentary from Fed officials regarding inflation and interest rates.Technically, the $93.26 resistance level is the immediate battleground. A decisive close above this level on the daily chart, confirmed by increasing volume and supported by bullish momentum on shorter timeframes, would signal a continuation of the uptrend towards $103.49. Conversely, failure to break higher and a subsequent close below the 1-hour support at $92.47 would suggest a bearish reversal, potentially targeting $90.99 and lower. The divergence between the strong daily trend (ADX 62.6) and the overbought conditions on the 1-hour chart (RSI 69.35, Stochastic K=92.2) creates uncertainty. This suggests that while the long-term trend is bullish, short-term traders should exercise caution and wait for confirmation before committing. Watching how WTI behaves around the $92.47 and $93.26 levels will provide the clearest indication of its immediate direction. The market is essentially waiting for a catalyst to break the current stalemate, and that catalyst could come from either the geopolitical front or macroeconomic policy shifts.
Bearish Scenario: A Profit-Taking Reversal
40% ProbabilityNeutral Scenario: Range-Bound Consolidation
30% ProbabilityBullish Scenario: Breaking Out Higher
30% ProbabilityFrequently Asked Questions: WTI Analysis
What happens if WTI fails to break above $93.26 resistance, given the strong daily trend?
If WTI fails to decisively break and hold above $93.26, it could signal a bearish reversal. The 4-hour chart shows a strong downtrend with ADX at 34.86, and a close below $92.47 could initiate a move towards $90.99, invalidating the bullish thesis.
Should I buy WTI at current levels of $93.26 given the mixed signals and strong daily trend?
Buying at $93.26 without confirmation carries risk due to overbought conditions on shorter timeframes (1H RSI 69.35). A safer approach is to wait for a clear breakout above $93.26 with volume confirmation, or for a pullback to $92.47 to hold as support, aligning with the daily uptrend.
Is the RSI at 63.88 a concern for WTI's bullish outlook on the daily chart?
An RSI of 63.88 on the daily chart is in the neutral zone and indicates bullish momentum without being overbought. This level suggests there is still room for upward movement before reaching overbought territory, supporting the bullish outlook as long as the trend remains strong.
How will the ongoing Middle East tensions and strengthening DXY affect WTI's price this week?
Escalating Middle East tensions provide a bullish risk premium for WTI, while the DXY's strength at 99.52 acts as a headwind. The net effect will depend on which factor dominates; further escalation could push WTI towards $103.49, whereas a sustained dollar rally might cap gains around $93.26.
| Indicator | Value | Signal | Interpretation |
|---|---|---|---|
| RSI (14) | 63.88 | Bullish | Daily RSI indicates room for upside. |
| MACD Histogram | -0.72 | Bearish | Daily MACD shows negative momentum. |
| Stochastic | K:24.50, D:50.89 | Bearish | Potential shift downwards, but still strong trend. |
| ADX | 62.60 | Strong Uptrend | Confirms a very strong underlying trend. |
| Bollinger | Price above Mid Band | Bullish | Suggests upward momentum. |
Track markets in real-time
AI-powered analysis, technical indicators and real-time price data.
Join Our Telegram Channel
Breaking market news, AI analysis and trading signals instantly.
Join Channel