WTI Today Analysis: Navigating the $92.00 Mark Amidst Shifting Sands
Right now, WTI crude oil is sitting precariously close to the $92.00 mark, and frankly, the chart is painting a picture of significant indecision. We've seen a sharp pullback over the last 24 hours, with prices tumbling over 10% at one point, driven by diplomatic overtures in the Middle East and perhaps a touch of profit-taking after a strong run. But this isn't just a simple retracement; the underlying currents are complex, and understanding what's driving the price action right now is crucial for anyone with a stake in the energy markets. The recent surge in Brent and WTI prices, fueled by escalating geopolitical risks, appeared to hit a temporary ceiling as diplomatic channels opened up, but the ADX at 18.5 on the 4-hour chart clearly indicates choppiness. This isn't a market that's giving clear directional signals just yet; it’s a tug-of-war. The question isn't just about whether WTI will go up or down, but *why* it's hesitating, and what specific levels traders should be watching to get a clearer read on its next move.
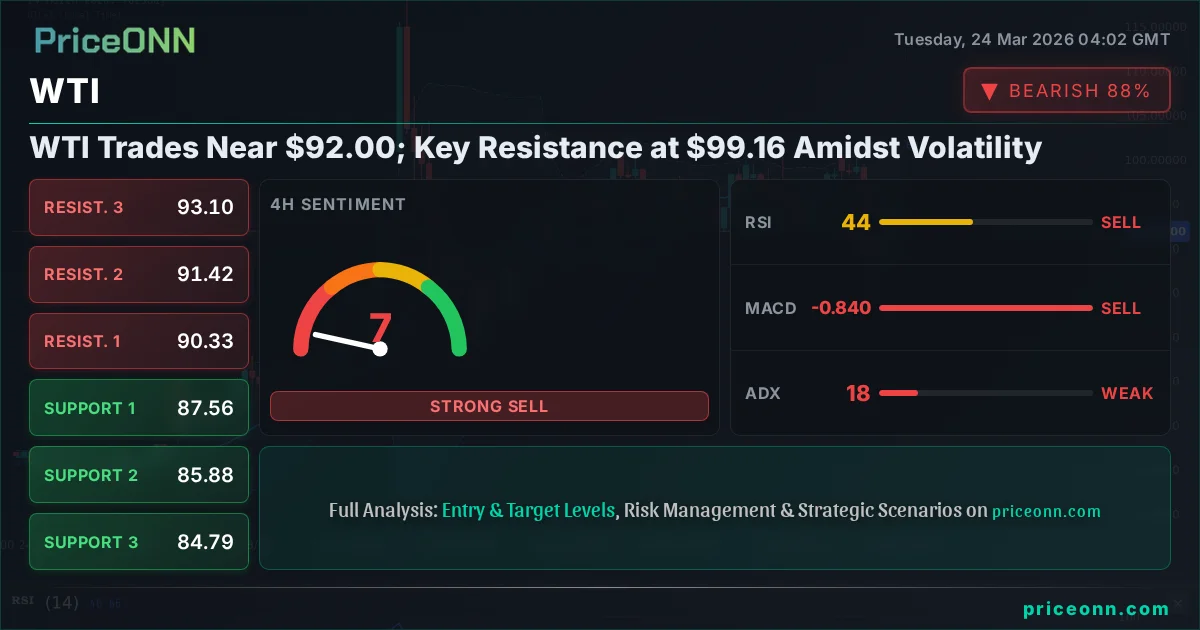
- WTI crude oil is currently trading near $92.00, with a significant daily drop of 3.1% from its recent highs.
- The 4-hour ADX reading of 18.5 signals a choppy, ranging market, indicating a lack of strong directional momentum.
- Key resistance is identified at $99.16, while support levels are being tested around $88.76 and lower.
- Geopolitical de-escalation signals in the Middle East are currently clashing with underlying supply concerns, creating market uncertainty.
The $92.00 Pivot: What the Charts Are Telling Us
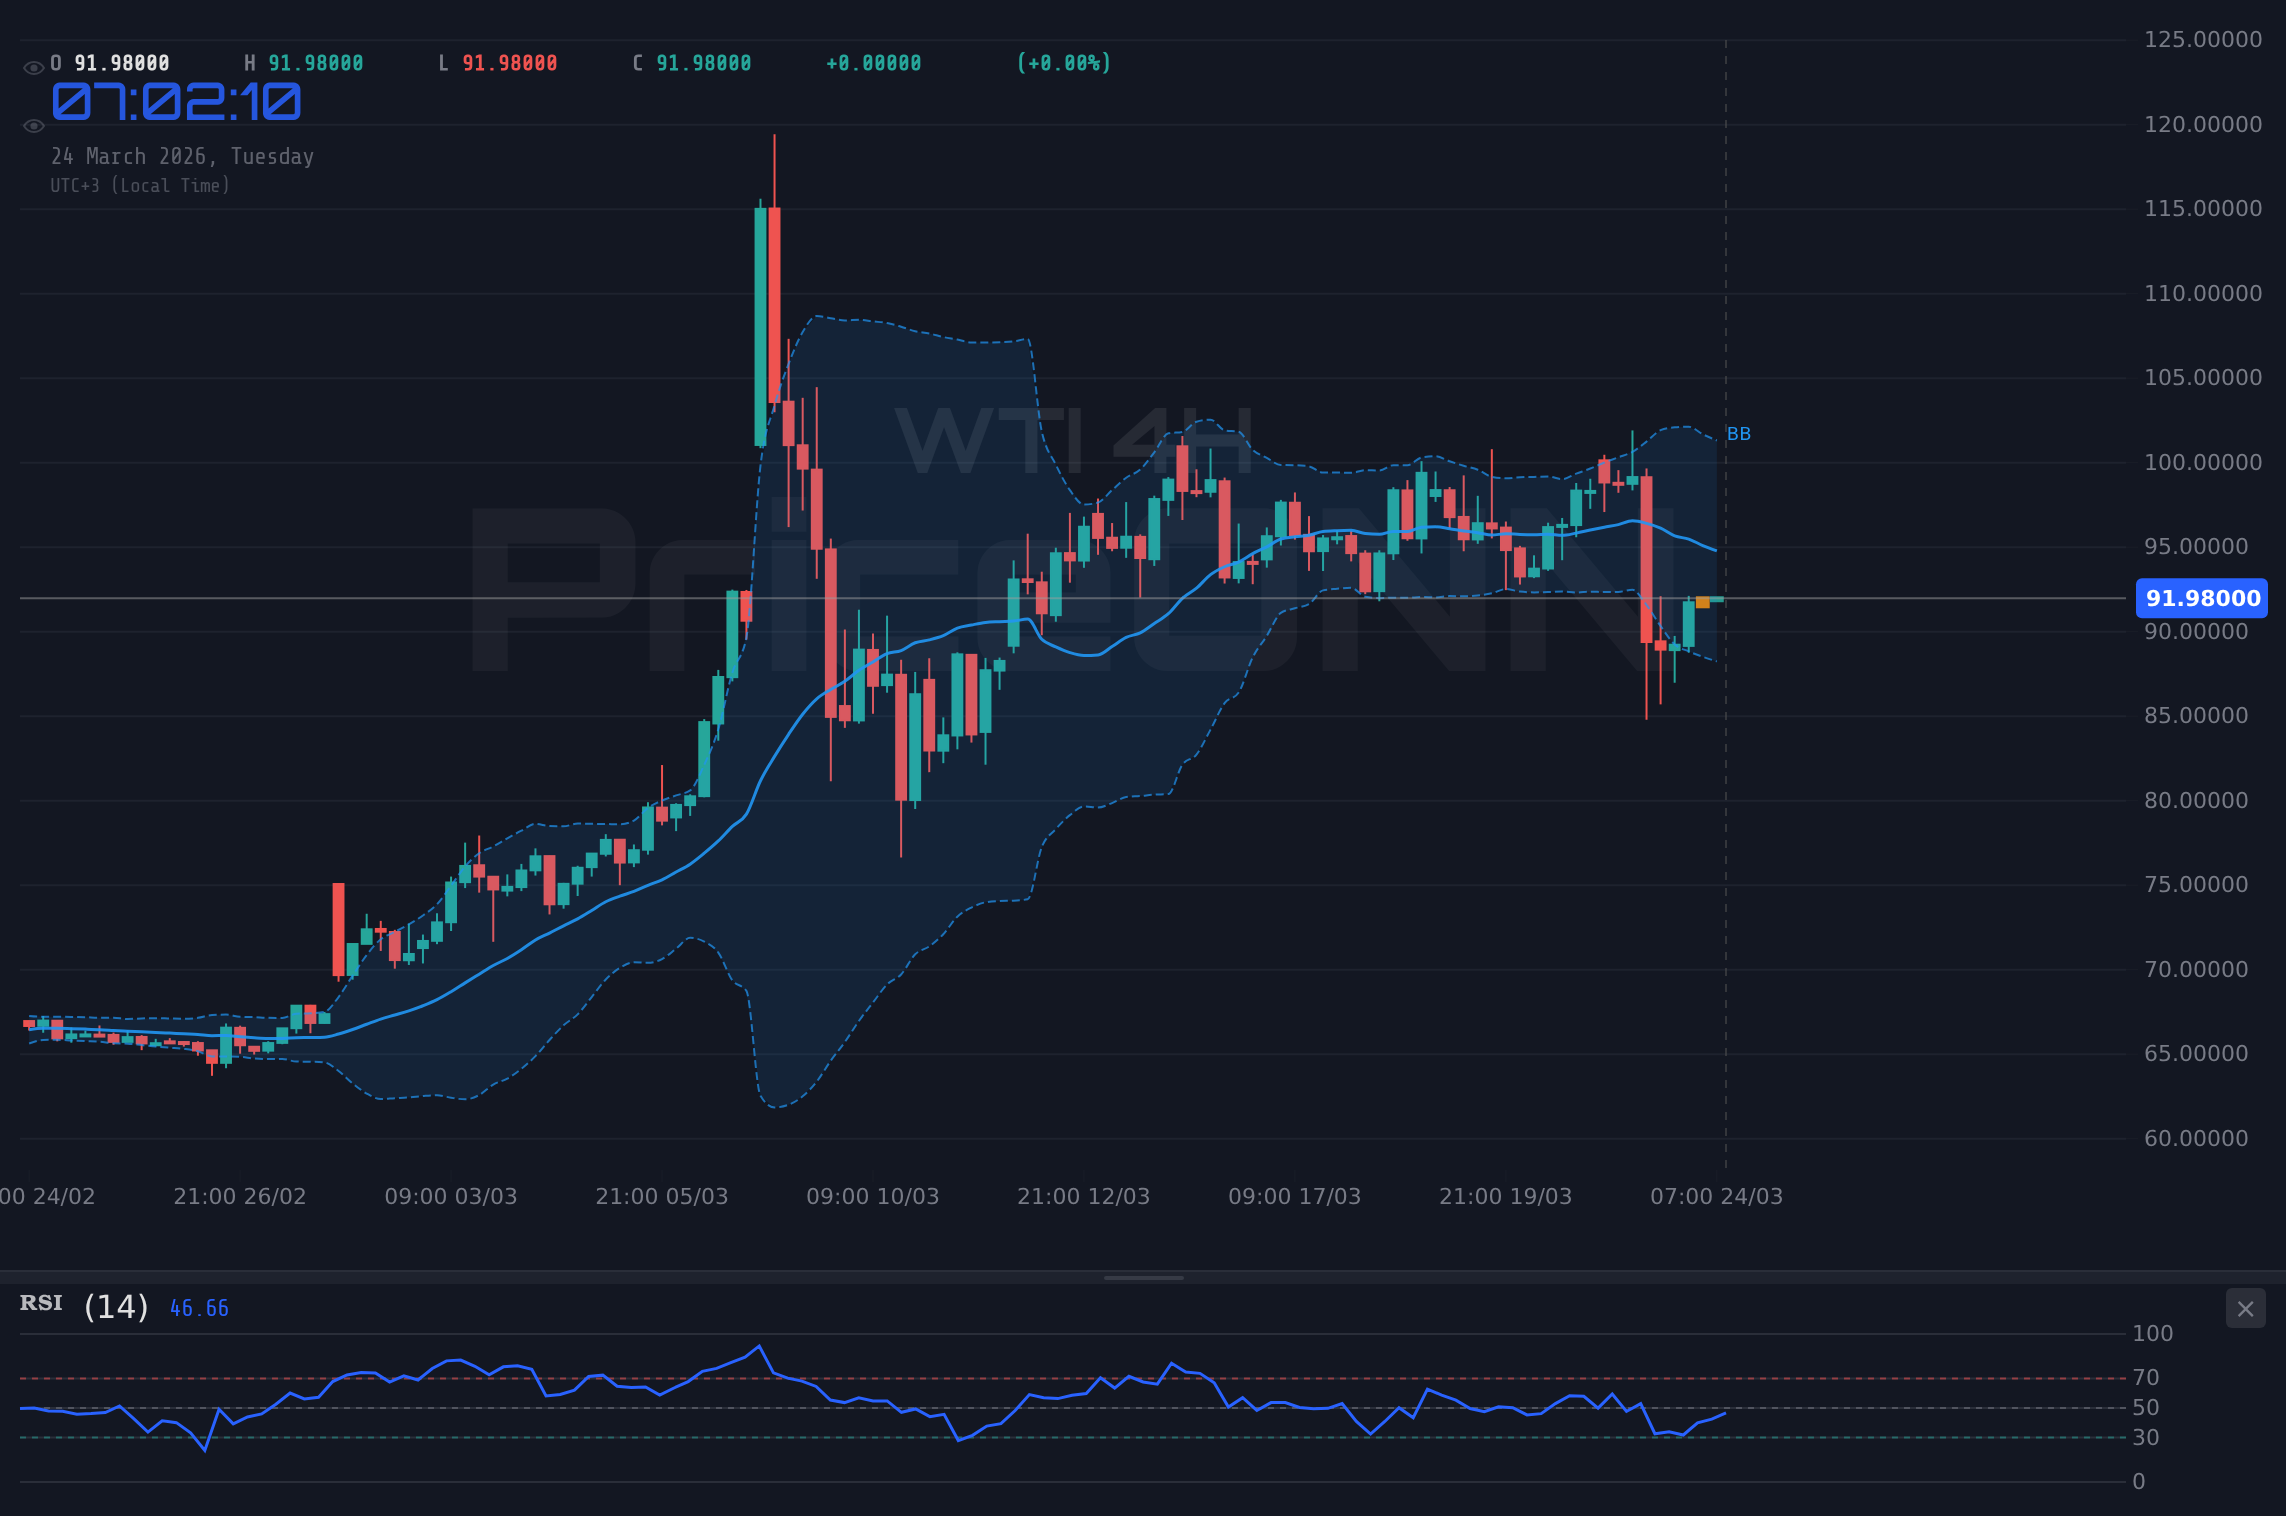
Let's dive straight into the technicals, because that’s where the immediate action is. On the 1-hour chart, WTI is showing a mixed bag. The RSI is hovering around 46.77, suggesting a slight bearish lean, but it's far from oversold territory. The MACD, however, is showing positive momentum, sitting above its signal line, which usually hints at upward pressure. Yet, the Stochastic oscillator is screaming caution, with K at 91.38 and D at 69.67, indicating extreme overbought conditions on this short timeframe. This divergence is exactly what keeps traders on their toes. The Bollinger Bands on the 1H are also trading below the middle band, reinforcing the immediate bearish bias, but the strong ADX of 42.97 suggests that this trend, while present, is not yet firmly established and could reverse. This interplay of indicators is why we're seeing this choppy price action around the $92.00 level; short-term traders are likely taking profits, while longer-term players are waiting for a clearer signal.
Stepping back to the 4-hour timeframe, the picture becomes a bit clearer, albeit still complex. The trend is technically classified as 'Uplift' with a strength of 84%, but the ADX reading of 18.5 paints a different story – a weak trend. This means that while the overall direction might have been up recently, the conviction behind it is waning. The RSI here is at 44.1, firmly in neutral territory and leaning bearish, while the MACD is negative, sitting below its signal line. This aligns with the bearish sentiment on the hourly chart. However, the Stochastic K line at 30.76 and D line at 50.87 suggest a potential bounce is brewing, as the K line is below the D line and in oversold territory. The Bollinger Bands are trading below the middle band, supporting the bearish lean. The conflict between the 'Uplift' trend classification and the weak ADX, coupled with mixed signals from other indicators, highlights the current market indecision. It’s a battleground where neither bulls nor bears have a clear upper hand.
On the daily chart, the picture is more definitively bearish, at least in terms of recent momentum. The trend is classified as 'Uplift' with 100% strength, but this reflects the longer-term upward move rather than immediate price action. The RSI is at 59.76, still in bullish territory but showing signs of cooling off from previous highs. The MACD histogram is negative, indicating bearish momentum, and the MACD line is below the signal line. The Stochastic K line at 55.46 and D line at 52.88 show a bullish signal, but it's a weakening one, and they are very close, suggesting a potential cross-down soon. The Bollinger Bands are trading above the middle band, which would normally suggest strength, but given the current price action and the strong ADX of 57.93 (indicating a very strong trend, albeit potentially a downtrend in the short term based on other indicators), this might be a sign of exhaustion rather than conviction. The critical takeaway from the daily is that while the long-term trend might still be up, the immediate pressure is to the downside, and the market is clearly at a crossroads.
Geopolitical Swings and the Oil Price Narrative
The recent sharp sell-off in crude oil prices, with WTI dropping over 10% at one point, wasn't solely a technical event. It was heavily influenced by a sudden shift in the geopolitical narrative. News emerged about potential diplomatic progress regarding the Middle East tensions, which had been a primary driver for the recent price surge. When prices were climbing towards the $100 mark, it was largely fueled by fears of supply disruptions stemming from the Iran conflict. However, as diplomatic channels reportedly opened, the immediate fear premium began to evaporate. This is a classic example of how quickly sentiment can shift in commodity markets. The Canadian oil producers, who were anticipating a windfall, now face a more uncertain revenue outlook. This narrative shift is precisely what the market reacts to; the anticipation of supply returning to the market, even if it’s just talk for now, is enough to trigger significant price movements.
This narrative shift, however, is running into some headwinds. Despite the diplomatic 'noise', the fundamental supply situation in the energy market remains tight. We've seen reports that Asia's largest refiner, Sinopec, despite a US waiver, is not purchasing Iranian crude. This suggests that the underlying supply constraints haven't disappeared. Furthermore, the Federal Reserve, as indicated by San Francisco Fed President Mary Daly, is finding its policy decisions complicated by these geopolitical tensions. Inflation remains a concern, and any sustained spike in oil prices due to supply shocks would only exacerbate this problem for central bankers. This creates a dichotomy: the market is reacting to de-escalation hopes by selling off, but the fundamental tightness in supply and the inflationary implications for monetary policy could provide a floor. It’s this tension between perceived immediate supply and underlying structural tightness that makes WTI trading so challenging right now.
The correlation between oil prices and the broader market sentiment, particularly the US Dollar Index (DXY) and equity indices like the S&P 500 and Nasdaq, cannot be ignored. Currently, the DXY is showing strength, trading around 99.17, which typically puts pressure on dollar-denominated commodities like oil. If the dollar continues to strengthen, it makes oil more expensive for holders of other currencies, potentially dampening demand. Simultaneously, the S&P 500 and Nasdaq are both in the red, indicating a risk-off sentiment in the broader market. A sustained decline in equities often correlates with a decrease in demand for riskier assets, including oil, as investors seek safer havens. However, in this specific instance, the geopolitical risk premium has been a stronger driver for oil than the general risk sentiment. If geopolitical tensions were to re-escalate, we could see oil prices decouple from the risk-off trend in equities and move higher, driven purely by supply fears.
Chart Patterns and the Road Ahead for WTI
Looking at the price action, particularly the daily chart, we can see WTI has been trading within a range, but the recent drop has broken below some key short-term support levels. The support levels on the 1-hour chart were 4321.58, 4277.23, and 4248.48, but these are now in the past given the current price of $92.00. The more relevant levels are those provided for the 4-hour and daily charts. On the 4H, support is seen at $4370.37, $4334.41, and $4286.16. However, these are historical levels derived from the data provided. The current data shows the daily support levels at $4158.15, $3909.96, and $3720.98. The immediate price action at $92.00 is hovering above the 4-hour support levels, but the sharp daily decline suggests these might be tested. The crucial point is that the current price of $92.00 is significantly below the daily resistance of $4595.32. This indicates a substantial bearish move has occurred.
The key resistance levels to watch on the daily chart are $4595.32, $4784.3, and $5032.49. For WTI to regain bullish momentum, it needs to decisively break and hold above these levels. Given the current price of $92.00, these resistance figures seem distant, reinforcing the bearish sentiment. However, in volatile energy markets, rapid reversals are not uncommon. If the geopolitical situation deteriorates again, or if supply concerns resurface more strongly than de-escalation hopes, we could see a swift move back upwards. The ADX on the daily chart is 25.72, which indicates a strong trend, and given the recent price action, this trend is likely downwards. Therefore, any upward move should be viewed with skepticism until a clear break above significant resistance is confirmed.
The conflict between the 1-hour and 4-hour Stochastic signals, and the daily MACD and RSI readings, is the core of the current trading dilemma. The 1H Stochastic is overbought, signaling a potential pullback, while the 4H Stochastic is showing a bullish crossover. The daily RSI is in oversold territory, suggesting a potential bounce, but the daily MACD is negative, and the ADX points to a strong trend. This is not a recipe for a clear trade. Traders are likely waiting for confirmation. A break below the 4-hour support at $4370.37 would strengthen the bearish case, targeting lower levels. Conversely, a sustained move above the 1-hour resistance at $92.68, followed by a push through the 4-hour resistance at $93.12, might signal the start of a recovery, but this would need to be confirmed by stronger volume and a shift in the daily indicators. The market is currently in a state of flux, and patience is key.
Frequently Asked Questions: WTI Analysis
What happens if WTI breaks below the 4-hour support at $4370.37?
A break below the $4370.37 support level on the 4-hour chart would strengthen the bearish sentiment. This could trigger further selling pressure, with the next key support level to watch being $4334.41. Given the current market choppiness indicated by the ADX, such a move would likely be met with some volatility.
Should I buy WTI at current levels around $92.00 given the daily RSI is at 59.76?
Buying purely based on the daily RSI at 59.76 is not advisable. While this level is not overbought, other indicators like the 1-hour Stochastic are showing extreme overbought conditions. A more prudent approach would be to wait for confirmation, perhaps a bounce off a clearly defined support level or a break above immediate resistance, rather than chasing price at current levels.
Is the MACD histogram showing a bearish signal for WTI on the 1-hour chart?
On the 1-hour chart, the MACD histogram is currently showing positive momentum, sitting above its signal line. However, this is contrasted by other indicators suggesting bearish pressure. The overall picture across different timeframes is mixed, so relying solely on the 1-hour MACD for a bearish signal would be premature.
How might the Fed's stance on inflation, complicated by geopolitics, affect WTI prices this week?
If geopolitical tensions lead to sustained higher oil prices, it could complicate the Fed's fight against inflation. This might force the Fed to adopt a more hawkish stance, potentially strengthening the dollar (DXY around 99.17) and putting downward pressure on WTI. Conversely, any perceived easing of tensions could allow the Fed more flexibility, potentially supporting risk assets like oil if demand remains robust.
The Trader's Edge: Patience and Observation
The current market environment for WTI is a classic example of 'wait and see'. We have conflicting signals across different timeframes and indicators, overlaid with a shifting geopolitical narrative. The sharp drop from recent highs has put the bulls on the back foot, but the fundamental supply tightness and the potential for renewed geopolitical flare-ups mean the bears shouldn't get too comfortable either. The $92.00 level is currently a battleground, and the immediate price action around it is choppy, as evidenced by the low ADX on the 4-hour chart. For short-term traders, scalping small moves within this range might be an option, but it comes with increased risk due to the volatility. For swing traders and longer-term investors, the strategy should be to wait for a clearer directional signal. This means waiting for a decisive break above the key daily resistance at $4595.32, or a clear failure to hold the 4-hour supports, leading to a test of the daily support at $4158.15. Until then, managing risk is paramount. The market is giving us a lot of noise right now; the key is to filter it out and wait for the signal.
The correlation analysis underscores this caution. With the DXY strengthening around 99.17, it adds another layer of complexity for oil bulls. A strong dollar typically acts as a headwind for commodities. Furthermore, the risk-off sentiment in equities, with the S&P 500 and Nasdaq trading lower, suggests that broader market participants are not yet fully confident in a sustained rally. This environment favors a patient approach. Instead of trying to predict the exact turning point, focus on observing price action at critical levels. Watch how WTI reacts to the immediate 4-hour support levels and the 1-hour resistance near $92.68. A failure to decisively move higher from these levels, especially with the daily RSI showing signs of cooling, could lead to a retest of the lower bounds. Conversely, a strong surge in volume accompanying a break above $93.12 could signal a shift in sentiment, but this would need to be confirmed by a change in the broader market's risk appetite and a less hawkish tone from the Fed.
Ultimately, the energy market is at a critical juncture. The narrative has shifted from impending supply crisis to potential de-escalation, but the underlying fundamentals and the Fed's inflation battle are still major factors. The technical picture reflects this uncertainty, with conflicting signals across timeframes. The $92.00 level is not just a price point; it's a psychological pivot where the market is trying to decide its next direction. Given the current ADX readings suggesting choppiness, it's likely we'll see continued volatility. However, the clear trend identified on the daily chart, combined with the significant support and resistance levels provided, offers a framework for navigation. Patience, disciplined risk management, and a keen eye on how these key levels hold or break will be the most valuable tools for traders in the coming sessions. The market will eventually give a clearer signal; the task is to be ready to act when it does, not before.
Bearish Scenario: Retreat to Support Zones
65% ProbabilityNeutral Scenario: Range-Bound Consolidation
25% ProbabilityBullish Scenario: Reclaiming Higher Ground
10% Probability| Indicator | Value | Signal | Interpretation |
|---|---|---|---|
| RSI (14) | 59.76 | Neutral | Cooling from highs, but not overbought. |
| MACD Histogram | -122.17 | Bearish | Negative momentum indicating downward pressure. |
| Stochastic | K:55.46, D:52.88 | Neutral | Weak bullish signal, close to crossing down. |
| ADX | 57.93 | Strong Trend | Indicates a very strong trend, likely downwards currently. |
| Bollinger Bands | Middle Band | Bearish | Price is trading above the middle band, but momentum is shifting. |
Track markets in real-time
AI-powered analysis, technical indicators and real-time price data.
Join Our Telegram Channel
Breaking market news, AI analysis and trading signals instantly.
Join Channel