XAGUSD Dips to $65.36: Can Key Support Hold Amidst Energy Surge?
Silver (XAGUSD) is trading at $65.36, testing critical support levels. With WTI crude oil breaching $100, the inflationary environment and geopolitical tensions are back in focus, impacting precious metals. This analysis dives deep into the technicals and potential scenarios.
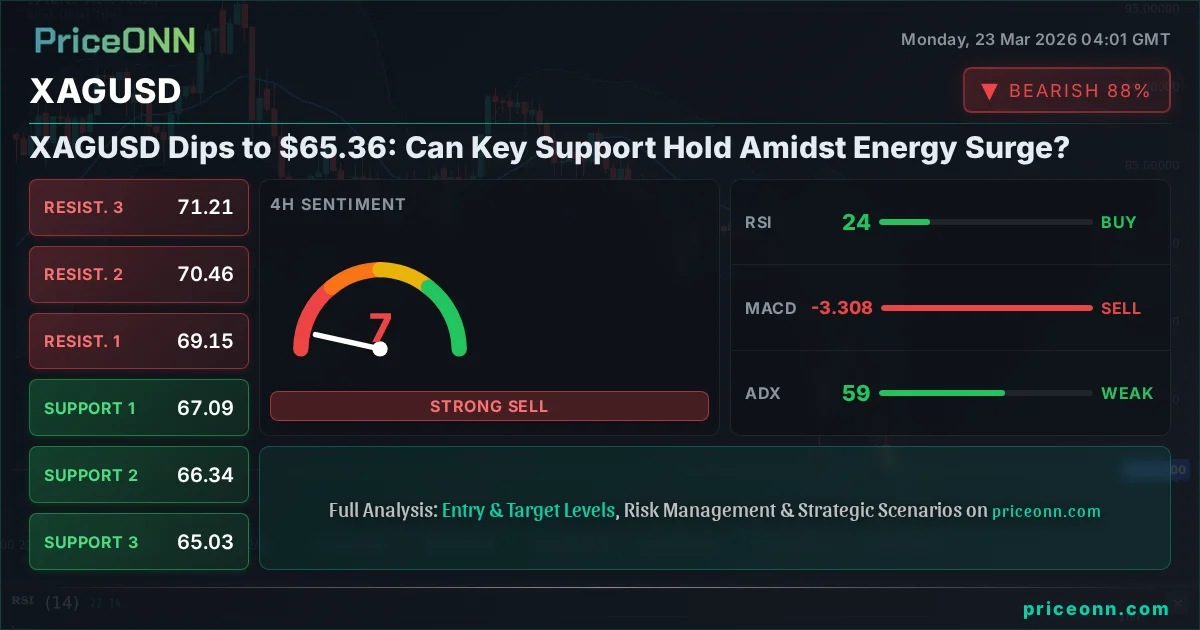
Silver prices are feeling the heat, with XAGUSD currently trading at $65.36. This sharp dip comes as a potent mix of factors, including a surge in crude oil prices past $100 for WTI and elevated geopolitical tensions, rekindle inflation fears and demand for safe-haven assets. While the broader market sentiment is cautious, the immediate technical picture for silver presents a critical juncture, with traders closely watching whether the current support levels can absorb the selling pressure.
- RSI at 26.38 on the 1H chart signals extreme oversold conditions, potentially presenting a buying opportunity.
- Critical support for XAGUSD sits at $64.26, a level tested multiple times and crucial for trend continuation.
- The ADX at 39.82 on the 1H chart indicates a strong downtrend, suggesting that any bounce might face immediate selling pressure.
- Geopolitical tensions and rising oil prices (WTI at $99.59) are driving safe-haven demand, creating a complex environment for silver.
The current market environment is a complex tapestry woven with threads of geopolitical uncertainty, shifting inflation expectations, and commodity price volatility. Silver, often seen as a dual-purpose asset - both an industrial metal and a safe-haven store of value - finds itself at a compelling crossroads. The recent sharp decline to $65.36 has brought the metal to a significant technical level, prompting a closer examination of its price action and the forces shaping its trajectory. Understanding the interplay between energy markets, the US dollar's strength, and broader risk sentiment is paramount for navigating this volatile period.
Navigating the Technical Landscape: A Multi-Timeframe Perspective
Diving into the technicals, the picture for XAGUSD is predominantly bearish across the shorter and medium-term timeframes, yet flashing oversold signals that warrant attention. On the 1-hour chart, the trend is firmly downwards, with an ADX reading of 39.82 underscoring the strength of this move. However, the RSI(14) is languishing at 26.38, deep in oversold territory, suggesting that the current selling momentum might be extended. This divergence between a strong trend and extreme oversold conditions often precedes a period of consolidation or a potential reversal, though it's not a direct buy signal on its own. The MACD also remains below its signal line, reinforcing the negative momentum, while prices are hugging the lower Bollinger Band, indicating significant downside pressure.
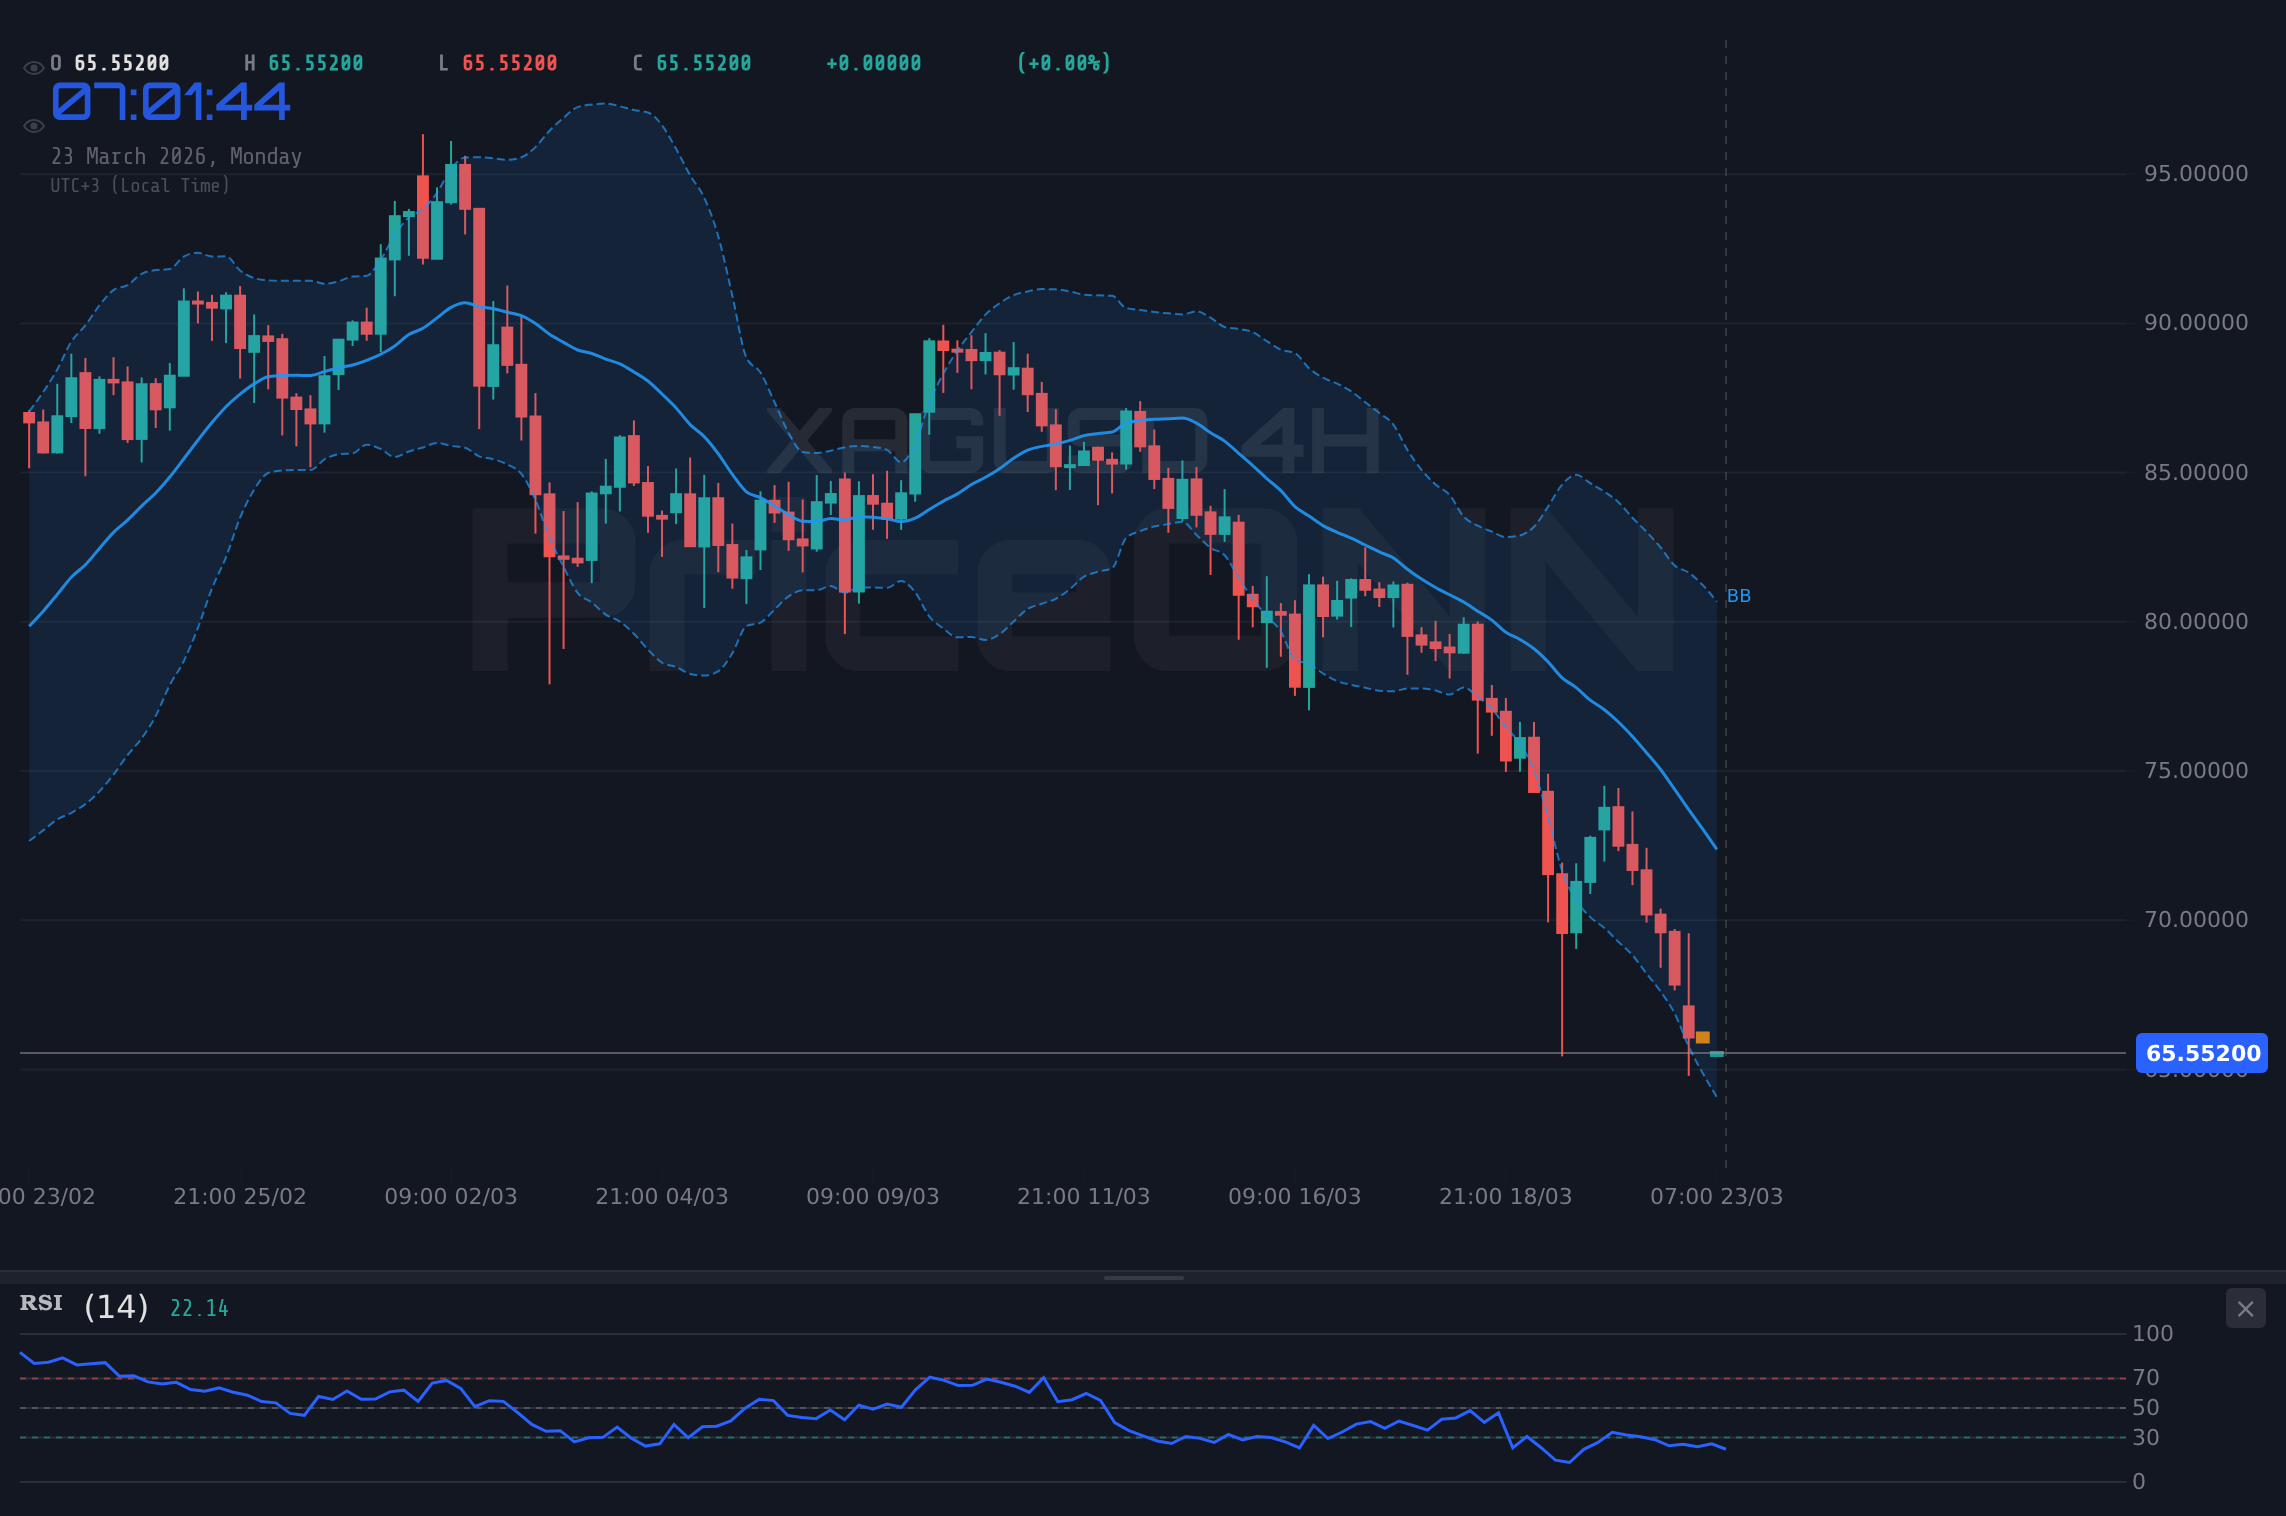
The 4-hour timeframe paints an even starker picture of the prevailing bearish trend. The trend strength is at a formidable 100%, with an ADX of 64.39 indicating a very strong downtrend. The RSI here is even lower, at 14.65, and Stochastic oscillators (K=12.49, D=32.01) are also deeply oversold and showing a bearish cross. Prices are trading significantly below the lower Bollinger Band, a condition that often signals extreme bearishness but also a potential for a snap-back rally if buyers step in. The support levels at 44.57, 44.16, and 43.56 are critical; a break below these could trigger further significant downside.
On the daily chart, the trend is officially neutral, a slight reprieve from the aggressive downtrends seen in shorter timeframes, with a trend strength of 50%. This neutrality is likely a reflection of the market pausing to digest the rapid sell-off. The RSI(14) at 26.4 still resides in oversold territory, offering a glimmer of hope for a potential bounce. The MACD, while showing negative momentum, is less aggressively positioned than on the hourly or 4-hour charts. The ADX at 22.26 indicates a moderately trending environment, a significant drop from the higher timeframes. The key support on the daily chart is identified at 44.04, followed by 43.11, and the more distant 41.46. Resistance is marked at 46.62, 48.28, and 49.21.
The Critical Juncture at $65.49 Support
The immediate focus for XAGUSD traders will undoubtedly be the $65.49 level. This is not just a random number; it represents the first significant support identified in the 1-day timeframe data, and it aligns closely with the current price action, where prices are hovering just above it. A decisive close below $65.49 on a daily basis would confirm a breakdown, potentially opening the door for a swift move towards the next support at $63.14. This level is crucial because it represents a significant psychological barrier and a historical price point where buying interest has previously emerged. Failure to hold this line could signal a continuation of the sharp downward momentum observed over the past week.
Conversely, if $65.49 holds and the RSI's oversold condition on shorter timeframes triggers a buying response, we could see a test of immediate resistance. The first resistance level to watch is $66.73 on the 1-hour chart, followed by $68.19. A sustained move above these levels, particularly breaking through the 4-hour resistance at $67.09, would be necessary to invalidate the current bearish outlook and suggest a potential trend change. The strength of the downtrend, evidenced by the high ADX readings, means that any rally will likely face strong headwinds from sellers looking to re-enter the market at higher prices.
Correlation Analysis: The Interplay of Commodities, Currencies, and Risk
The price action in XAGUSD cannot be viewed in isolation. The surge in WTI crude oil prices, breaking past $100 and trading at $99.59, is a significant factor. Historically, rising oil prices often correlate with increased inflation expectations, which can boost precious metals like gold and silver as inflation hedges. However, the current market is also sensitive to interest rate expectations. The US Dollar Index (DXY), currently trading around 99.46, has shown a slight upward bias, which typically exerts downward pressure on dollar-denominated commodities like silver. This creates a conflicting dynamic: rising oil prices and geopolitical risks suggest higher silver prices, while a strengthening dollar and potential for higher interest rates lean bearish.
The broader market sentiment, reflected in the S&P 500 (currently at 6475.3) and Nasdaq (at 23748.87), also plays a crucial role. Both major US indices are experiencing significant declines, indicating a risk-off environment. In such conditions, investors tend to flee riskier assets and seek refuge in safe-haven assets. While the US dollar often benefits from this flight to safety, gold and silver can also see increased demand, especially if inflation concerns are paramount. The current data shows a strong downtrend in these indices, which, paradoxically, should be supportive of silver. Yet, silver has been falling sharply, suggesting that the dollar's strength and rising bond yields might be overriding the traditional safe-haven narrative for now.
Geopolitical Tensions and Inflation Fears: A Double-Edged Sword
Recent news highlights the escalating geopolitical tensions in the Middle East, a factor that has historically been a strong catalyst for precious metals. Reports indicate that crude oil benchmarks remain elevated, trading near $100 for WTI, as geopolitical uncertainties persist. This situation can directly impact silver in a couple of ways. Firstly, it fuels inflation fears, as energy is a fundamental component of global economic activity. Higher energy costs translate to higher production and transportation costs across various sectors, potentially leading to broader price increases. Secondly, heightened geopolitical risk often drives investors towards perceived safe-haven assets, a category that includes silver, particularly when inflation is a concern.
However, the market's reaction is not always straightforward. While inflation fears might suggest a buy signal for silver, the simultaneous strengthening of the US dollar, currently at 99.46, acts as a significant headwind. A stronger dollar makes dollar-denominated commodities more expensive for holders of other currencies, potentially dampening demand. Furthermore, if these geopolitical tensions lead to expectations of more aggressive central bank tightening to combat inflation, this could increase bond yields and further pressure precious metals. The market is currently grappling with this dichotomy: is the fear of inflation and geopolitical instability driving demand for silver, or is the prospect of higher interest rates and a stronger dollar weighing it down more heavily?
Trade Scenarios: Mapping the Path Forward for XAGUSD
Given the conflicting signals and the critical technical levels, it's essential to map out potential scenarios for XAGUSD. The current price of $65.36 places it precariously close to key support, while the strong downtrend on shorter timeframes suggests caution. The high ADX values across multiple timeframes indicate significant directional momentum, making any trading decision contingent on a clear understanding of the prevailing trend and potential reversal points.
Bearish Scenario: Downside Continues
65% ProbabilityNeutral Scenario: Consolidation and Range-Bound Trading
25% ProbabilityBullish Scenario: Oversold Bounce
10% ProbabilityThe Trader's Perspective: Risk Management is Key
From a trader's standpoint, the current setup on XAGUSD is fraught with both risk and potential opportunity, heavily leaning towards risk mitigation. The strong downtrend across multiple timeframes, particularly the 4-hour and 1-hour charts with their high ADX readings, suggests that shorting on bounces or waiting for confirmation of a bottom might be the prudent approach. The oversold RSI readings are a beacon for contrarian buyers, but jumping in without confirmation against such a strong trend can be a costly mistake. Waiting for a clear break above immediate resistance levels, like $66.73, or a more convincing daily chart reversal pattern would be advisable.
For those considering a long position, the risk/reward ratio needs careful consideration. Entry near the $65.49 support level, with a tight stop-loss just below it (perhaps at $64.73, just above the 1H S2), could offer a favorable setup if a bounce materializes. However, the probability of this scenario playing out, based on the current technicals, is relatively low (estimated at 10-15%). A more conservative approach would be to wait for a confirmed breakout above the $66.73-$68.19 resistance zone, although this might mean missing the lowest entry points. Conversely, for bearish traders, the setup is more compelling. A break below $65.49 offers a clear entry point with defined targets at $64.26 and $63.14, supported by strong trend indicators.
The market remains highly sensitive to geopolitical developments and central bank policy shifts. Any unexpected news regarding the Middle East or a hawkish tone from major central banks could trigger significant volatility, overriding technical signals. Always employ strict risk management protocols, including setting appropriate stop-losses and position sizing, especially in the current high-uncertainty environment.
The influence of the US Dollar Index (DXY), currently at 99.46, cannot be overstated. As DXY shows a neutral to slightly bullish bias on the 4-hour chart (ADX 17.22), it generally exerts pressure on silver. If the DXY continues to climb, it will make it harder for XAGUSD to find sustainable upside momentum. Conversely, any weakness in the dollar, perhaps driven by changing Fed rate expectations or renewed risk aversion that favors other safe havens, could provide a tailwind for silver. Traders should monitor the DXY closely as a leading indicator for silver's short-term direction.
Looking at the broader commodity space, the strength in crude oil (WTI at $99.59, Brent at $113.07) is a double-edged sword for silver. While it fuels inflation narratives that *should* support precious metals, the simultaneous rise in the dollar and bond yields complicates the picture. The fact that silver is dipping despite these factors suggests that the bearish macro pressures might be temporarily outweighing the inflation hedge appeal. This is a critical observation; it implies that the typical correlation might be breaking down, or that market participants are prioritizing interest rate hikes over inflation concerns at this moment.
The divergence between the strong downtrend signals (high ADX) and the extremely oversold oscillators (RSI, Stochastic) is the key focus. This often leads to sharp, albeit potentially short-lived, reversals. For a confirmed bullish move, we need to see XAGUSD decisively break above at least the 1H resistance at $66.73, ideally with increasing volume and a softening dollar. Until then, the path of least resistance remains to the downside, making any long positions speculative and requiring tight risk control.
The economic calendar, while not explicitly detailed here, always plays a critical background role. Upcoming inflation data releases or central bank commentary could significantly shift market sentiment regarding interest rate hikes. If inflation proves stickier than expected, central banks might be forced into more aggressive tightening, which would likely strengthen the dollar and pressure silver. Conversely, any sign of cooling inflation could lead to expectations of rate cuts sooner, potentially boosting silver. The current price action suggests the market is still leaning towards the former scenario, but this can change rapidly.
The structure of the market itself, as indicated by the 'General Signal' across timeframes, predominantly leans towards 'SELL'. However, the daily chart shows a more neutral stance with a 'SAT' signal (2 sell, 6 buy, 0 neutral) which is unusual. This mixed bag of signals across different timeframes highlights the current indecision and the pivotal nature of the price action around $65.49. For seasoned traders, this might signal a period of consolidation before the next major move, or an opportunity for scalpers to play the short-term bounces within the established downtrend.
Frequently Asked Questions: XAGUSD Analysis
What happens if XAGUSD breaks below the $65.49 support level today?
If XAGUSD closes decisively below $65.49, the bearish scenario becomes more probable. The immediate downside target would be the next support at $64.26, with further potential towards $63.14 as indicated by the 1-hour chart levels. This would likely be accompanied by strengthening ADX and oversold oscillators continuing their trend.
Should I consider buying XAGUSD at current levels around $65.36 given the oversold RSI?
Buying at current levels is speculative given the strong downtrend and high ADX readings on shorter timeframes. While RSI is oversold, confirmation is needed. A potential entry could be considered if price holds $65.49 and shows signs of reversal, targeting $66.73, but with a very tight stop-loss just below the support level.
Is the RSI at 26.38 a reliable buy signal for XAGUSD right now?
An RSI reading of 26.38 is deeply oversold and historically can precede bounces. However, in a strong downtrend, RSI can remain in oversold territory for extended periods. While it suggests selling momentum may be exhausting, it's not a standalone buy signal; confirmation through price action and other indicators like MACD and ADX is crucial.
How will rising oil prices ($99.59 WTI) affect XAGUSD this week?
Rising oil prices typically fuel inflation concerns, which can be bullish for silver as an inflation hedge. However, if this leads to expectations of aggressive rate hikes by the Fed, it could strengthen the US dollar and pressure silver. The net effect depends on whether the market prioritizes inflation fears or tightening concerns.
Track markets in real-time
AI-powered analysis, technical indicators and real-time price data.
Join Our Telegram Channel
Breaking market news, AI analysis and trading signals instantly.
Join Channel