Silver prices are currently navigating a complex landscape, with XAGUSD trading precisely at $72.65. This pivotal moment comes as broader market sentiment shows a divergence between risk assets and safe havens, influenced by geopolitical tensions and shifting economic indicators. Understanding the interplay between these factors and silver's unique position is crucial for traders aiming to capitalize on potential price action. The current technical indicators present a mixed bag, demanding a nuanced approach rather than a straightforward directional bet. This deep dive will dissect the XAGUSD's current standing, examining its correlation with the US Dollar Index (DXY), equity markets, and commodity peers, while also considering the impact of recent economic data and geopolitical developments.
- XAGUSD is currently trading at $72.65, showing a neutral trend on the 1-hour and 4-hour charts but a strong bearish trend on the daily timeframe.
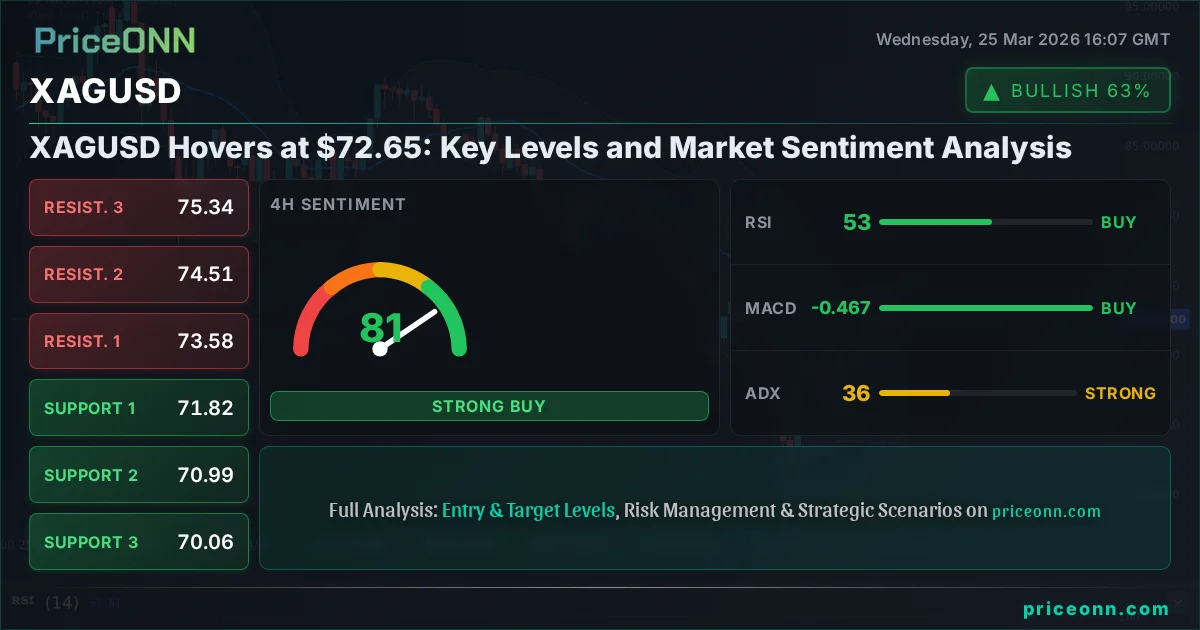
- Critical support sits at $72.16 on the 1-hour chart, tested multiple times, while resistance is eyed at $73.56.
- The RSI at 56.24 (1H) suggests upward momentum, but the MACD histogram shows negative momentum, indicating caution.
- DXY at 99.32 is rising, generally pressuring silver prices, while the S&P 500 at 6592.1 shows slight weakness, potentially increasing safe-haven demand for silver.
Navigating the Silver Tightrope: Technical Signals in Focus
Looking at the 1-hour chart for XAGUSD, the trend is currently neutral with a 50% strength. However, the immediate support level is holding at $72.16, a level that has seen some attention. Resistance looms at $73.56, and breaking above this could signal a short-term bullish shift. The RSI(14) stands at 56.24, residing in neutral territory but leaning towards an upward inclination, suggesting that buyers are not entirely absent. Yet, the MACD presents a counter-signal, indicating negative momentum with the MACD line below its signal line. This divergence is a classic sign of caution; while the RSI nudges higher, the underlying momentum is weakening. The Stochastic oscillator, with K at 55.49 and D at 49.75, offers a bullish signal as %K is above %D, but it's not in extreme territory, leaving room for further movement. The ADX at 14.97 reinforces the neutral stance, pointing to a lack of strong directional conviction in the short term. The overall signal on this timeframe leans towards a 'Sell' (Al: 3, Sat: 5, Nötr: 0), reflecting the conflicting indicators.
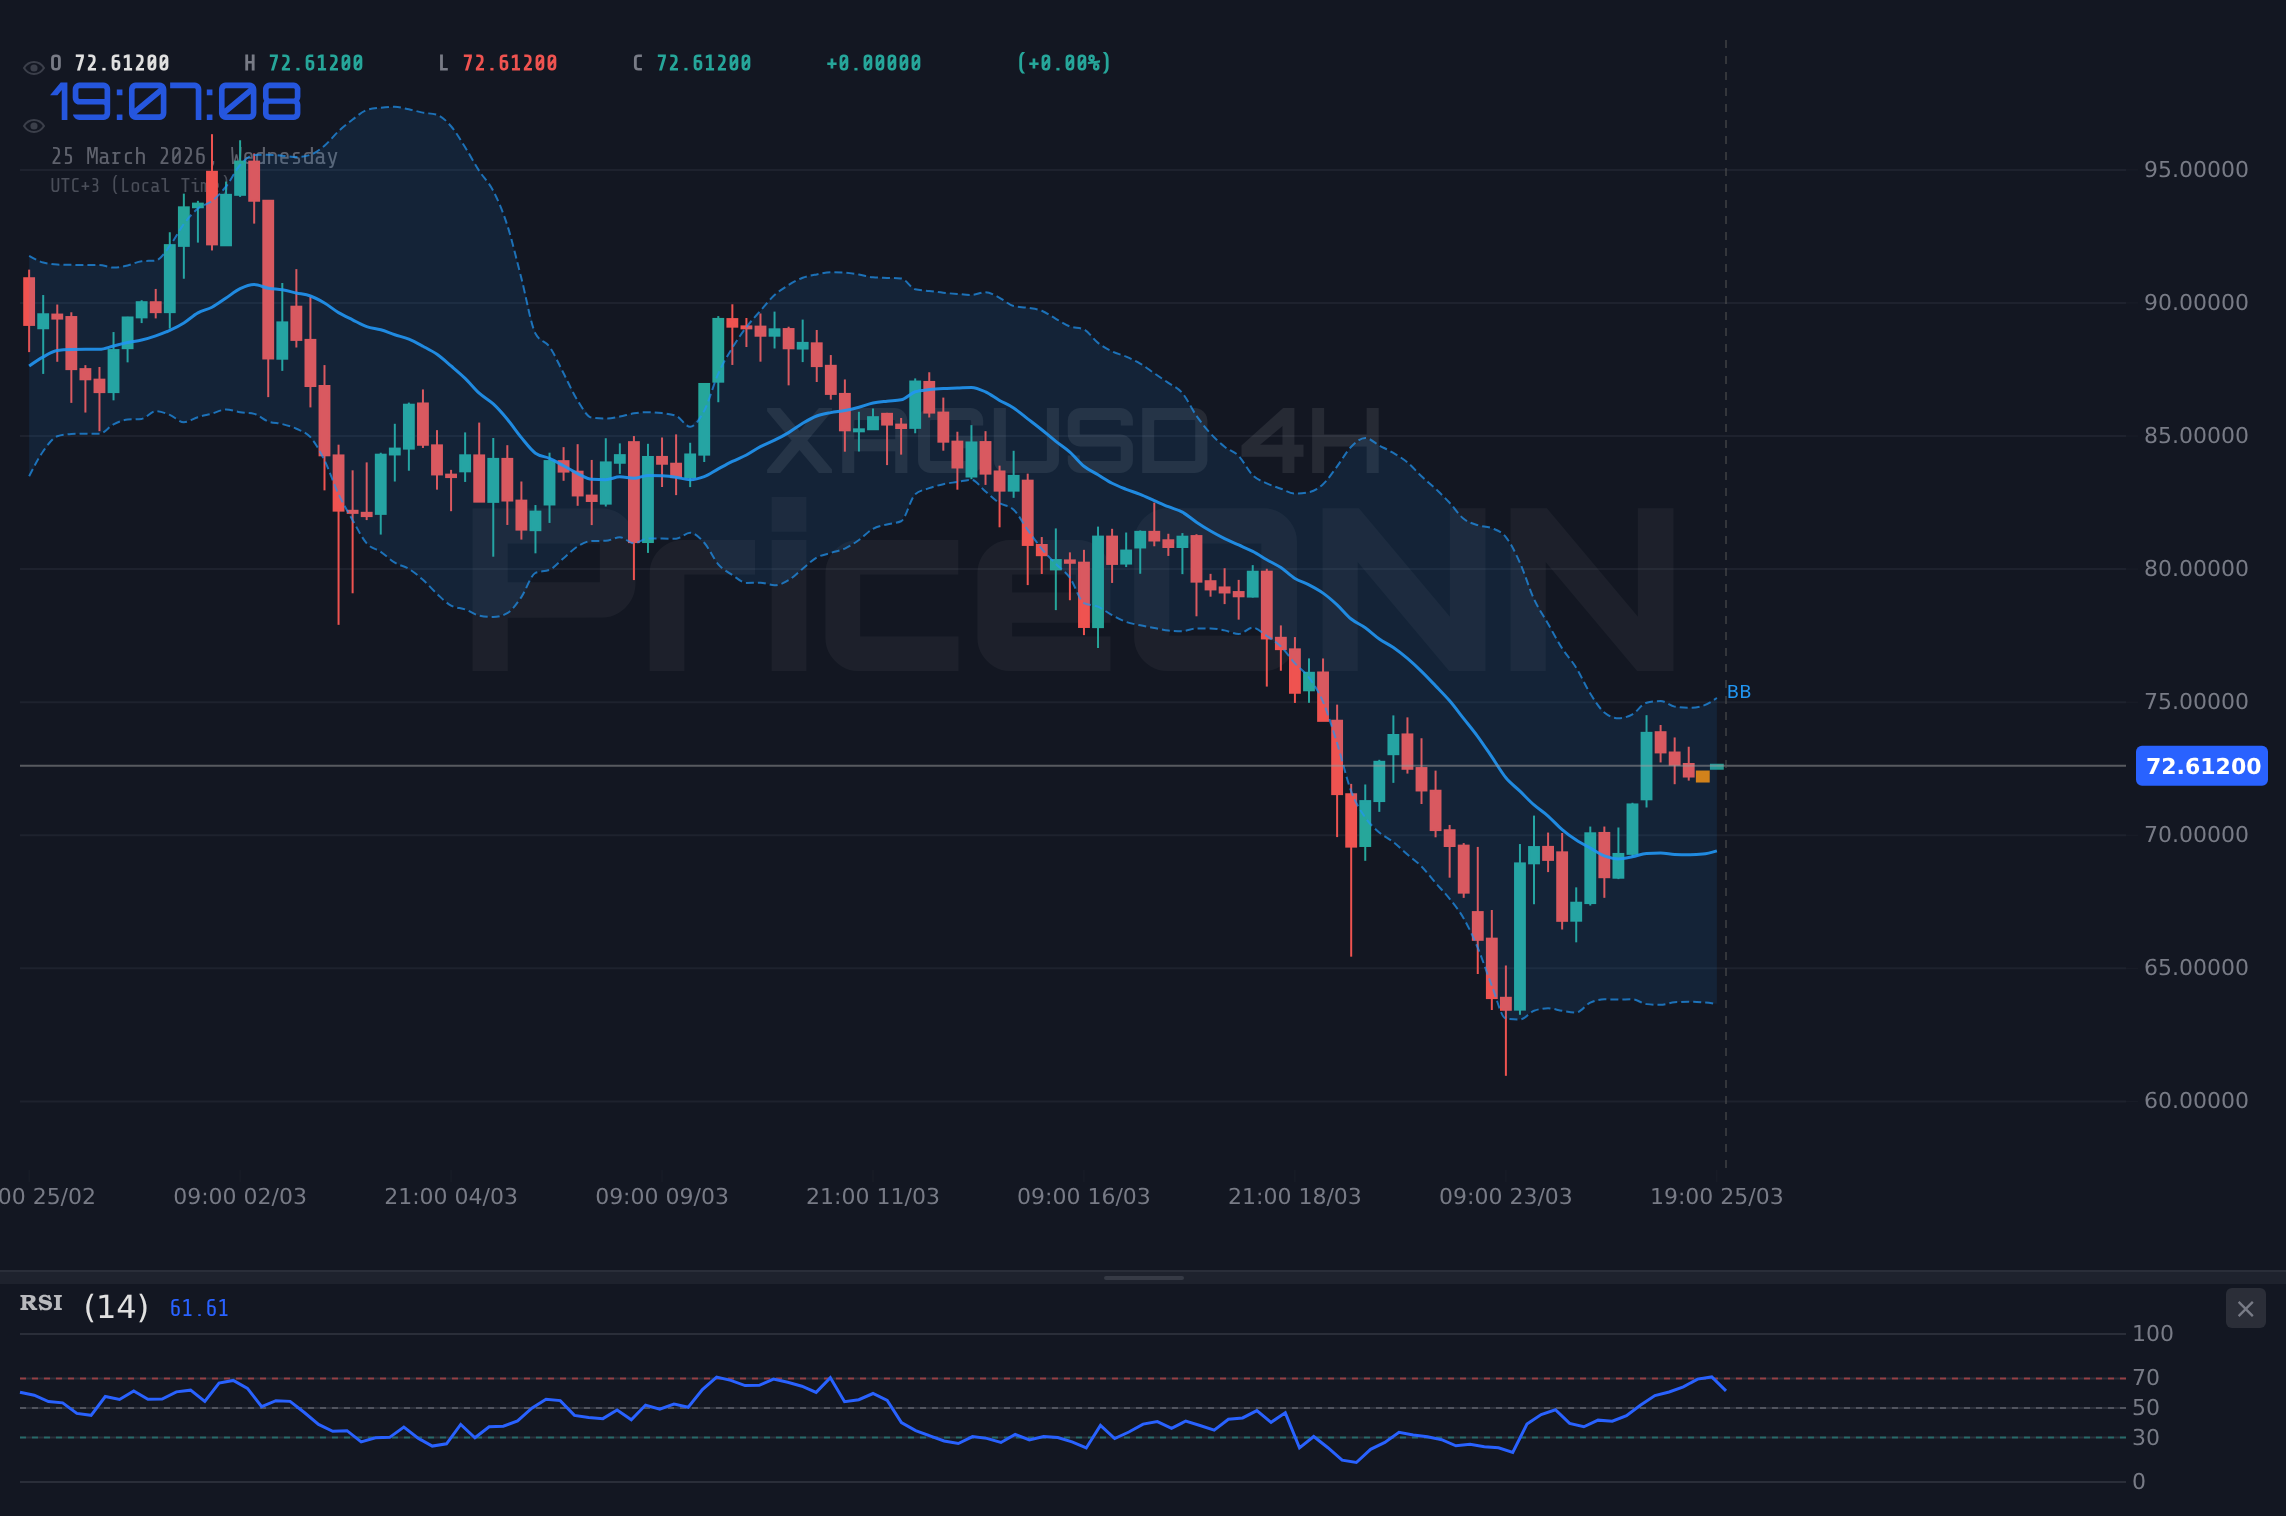
Shifting to the 4-hour timeframe, the picture remains mixed but with a slight edge towards caution. The trend is still neutral (50% strength), with support identified at $71.82 and resistance at $73.58. The RSI(14) is hovering near the 50 mark at 53.04, indicating a balanced market sentiment. However, the MACD here shows positive momentum, with the MACD line above its signal line, a more encouraging sign for bulls than on the 1-hour chart. The Stochastic oscillator, however, is flashing a warning sign. With K at 80 and D at 86.74, it has entered the overbought region, suggesting that any further upward move might be met with profit-taking or a reversal. The ADX at 35.51 indicates a stronger trend, albeit one that is currently favoring a downward move on this timeframe, which contradicts the MACD's positive momentum. The general signal here is 'Buy' (Al: 5, Sat: 3, Nötr: 0), but the overbought Stochastic and the ADX reading warrant close observation. This suggests that while there might be short-term upward potential, the underlying trend strength indicators are not fully aligned for a sustained rally.
The daily chart paints a more defined, albeit bearish, picture for XAGUSD. The trend is clearly identified as bearish with a high strength of 94%. Key support levels are significantly lower, found at $67.68, $64.21, and $62.44. Resistance, however, is more immediate, with the first significant hurdle at $72.93. The RSI(14) is at 40.92, in neutral territory but trending downwards, indicating that selling pressure is more dominant than buying. The MACD is firmly in negative territory, with the histogram below the signal line, reinforcing the bearish momentum. Bollinger Bands are showing the price trading below the middle band, a classic sign of a downtrend. The Stochastic oscillator, with K at 38.32 and D at 22.21, is showing a bullish signal as %K has crossed above %D, which is often seen as a potential reversal indicator. However, the ADX at 25.11 confirms a strong bearish trend, suggesting that this Stochastic bullish signal might be a temporary bounce within a larger downtrend rather than a sustained reversal. The overall signal for the daily timeframe is 'Sell' (Al: 2, Sat: 6, Nötr: 0), aligning with the prevailing bearish trend.
The conflicting signals across different timeframes for XAGUSD highlight a market in transition. While the 1-hour and 4-hour charts show some potential for short-term gains, the dominant bearish trend on the daily chart cannot be ignored. Traders should be wary of chasing short-term rallies without clear confirmation of a sustained trend reversal.
Intermarket Dynamics: DXY, Equities, and the Commodity Complex
The movement of the US Dollar Index (DXY) is a critical factor influencing silver prices. Currently, the DXY is trading at 99.32, showing a significant daily gain of 0.47%. This strength in the dollar typically exerts downward pressure on commodities priced in USD, including silver. On the 1-hour chart, the DXY shows a neutral trend but with strong bullish signals, and its daily chart indicates a powerful upward trend with an ADX of 31.94. This suggests that the dollar's strength is likely to continue, acting as a headwind for XAGUSD. A rising DXY, as seen today, often correlates with a risk-off sentiment, which can, paradoxically, sometimes boost safe-haven assets like gold and silver, but the immediate price action suggests the dollar's strength is the dominant force right now.
Equity markets are also providing context. The S&P 500 is trading at 6592.1, showing a slight daily decline of 0.07%. The Nasdaq 100, a tech-heavy index, is down 0.15% at 24155.25. The Dow Jones Industrial Average, however, is showing a marginal gain of 0.02% at 46409. This mixed performance in major US indices indicates a cautious risk appetite. On the 1-hour and daily charts, both the S&P 500 and Nasdaq 100 show bearish signals, suggesting potential headwinds for riskier assets. While a strong risk-off sentiment might normally drive investors towards safe havens like silver, the simultaneous strength of the DXY complicates this relationship. Historically, silver can act as both an inflation hedge and a safe haven, making its price action sensitive to a wider array of factors than just a simple risk-on/risk-off dynamic.
In the broader commodity complex, oil prices are showing considerable strength. Brent crude is up 1.48% at $100.94, and WTI crude is surging 2.45% to $90.8. This rise in oil prices, often driven by geopolitical concerns and supply-demand dynamics, can fuel inflation expectations. Higher inflation expectations typically benefit precious metals like silver as they are seen as a hedge against the erosion of purchasing power. However, the current price action of XAGUSD suggests that this inflation-hedge narrative is currently being overshadowed by the strengthening dollar and potentially a broader risk aversion that is not uniformly translating into safe-haven demand across all asset classes. The correlation between oil and silver is often positive, but today's data shows a disconnect, with oil rallying strongly while silver shows mixed signals and a bearish daily trend.
The current environment presents a classic case of conflicting market drivers. The rising DXY suggests headwinds for XAGUSD, yet strong oil prices and geopolitical jitters could normally support silver as an inflation hedge and safe haven. Traders should pay close attention to how these forces resolve, particularly watching for a decisive break above $73.56 resistance or a failure to hold the $72.16 support.
Fundamental Drivers and Geopolitical Undercurrents
Recent economic data releases provide further context for the market's cautious stance. The latest US Services PMI came in at 51.1, slightly below the forecast of 52 and the previous reading of 51.7, indicating a slight cooling in the services sector. Conversely, the US Manufacturing PMI surpassed expectations, printing at 52.4 compared to a forecast of 51.5 and a previous reading of 51.6, suggesting resilience in the manufacturing sector. This mixed economic picture contributes to the uncertainty surrounding the future path of monetary policy, particularly from the Federal Reserve. The Fed's stance on inflation and interest rates remains a key driver for the dollar and, consequently, for silver.
Geopolitical tensions continue to simmer, adding a layer of complexity to market analysis. Reports indicate escalating Middle East conflict, which has led to a naphtha shortage and is threatening petrochemical output. While this directly impacts energy markets, such conflicts often spill over into broader market sentiment, increasing demand for safe-haven assets. However, as noted earlier, the current DXY strength seems to be overriding this traditional safe-haven flow for silver. The news about potential ceasefire hopes emerging in the Middle East, as reported, could lead to a decrease in oil prices and potentially reduce the safe-haven appeal of commodities, which might put further pressure on XAGUSD if the dollar continues its ascent.
The Reserve Bank of New Zealand (RBNZ) is also weighing economic slack against oil price shocks, a dynamic that, while specific to NZD, reflects a global concern about inflation and economic resilience. This highlights the intricate global economic puzzle policymakers are trying to solve, with central banks worldwide balancing inflation concerns against growth risks. For silver, this complex global backdrop means that price action will likely remain sensitive to geopolitical news, inflation data, and central bank communications. The market is essentially pricing in a scenario where inflation remains a concern, but the path forward for interest rates is far from clear, leading to the choppy, mixed signals observed across various asset classes.
"The current market environment is a delicate balancing act. Investors are weighing the persistent threat of inflation, fueled by geopolitical risks and strong commodity prices, against the possibility of central banks maintaining higher-for-longer interest rate policies to combat it. This tension is creating volatility across asset classes, and silver is caught in the crossfire."
Trading Scenarios for XAGUSD
Bearish Scenario: Downside Risk Prevails
60% ProbabilityNeutral Scenario: Consolidation Around Key Levels
25% ProbabilityBullish Scenario: Reclaiming Upper Ground
15% ProbabilityFrequently Asked Questions: XAGUSD Analysis
What happens if XAGUSD breaks below the $72.16 support level?
If XAGUSD breaks decisively below the $72.16 support on the 1-hour chart, it invalidates the short-term bullish potential. The bearish scenario would then likely play out, targeting the next support levels at $71.82 and potentially $70.99 as the daily bearish trend reasserts itself.
Should I buy XAGUSD at current levels of $72.65 given the mixed signals?
Buying at current levels carries significant risk due to conflicting indicators and a dominant daily bearish trend. A more prudent approach might be to wait for a confirmed breakout above $73.56 resistance or a clear rejection at $72.16 support, offering a better risk-reward ratio.
Is the RSI at 56.24 a buy signal for XAGUSD on the 1-hour chart?
An RSI of 56.24 is in neutral territory and suggests some upward momentum, but it is not a strong buy signal on its own. Considering the negative MACD momentum and the strong daily bearish trend, this RSI reading should be viewed with caution and requires confirmation from other indicators and price action.
How will the rising DXY at 99.32 affect XAGUSD this week?
The rising DXY, currently at 99.32 and showing strong upward momentum, typically exerts downward pressure on silver prices like XAGUSD. This could hinder any attempts by bulls to push prices higher and may contribute to the bearish scenario playing out if key support levels are breached.
The path forward for XAGUSD remains uncertain, characterized by conflicting technical signals and a tug-of-war between bullish and bearish drivers. While short-term charts offer glimpses of potential upside, the dominant bearish trend on the daily timeframe, coupled with a strengthening dollar, casts a significant shadow. Traders must remain vigilant, prioritizing risk management and waiting for clear confirmation before committing to a trade. The levels at $72.16 (support) and $73.56 (resistance) on the 1-hour chart are critical battlegrounds that will likely dictate the immediate direction. Patience and discipline will be key in navigating these choppy waters; the market always provides opportunities for those who wait for the right setup.
| Indicator | Value | Signal | Interpretation |
|---|---|---|---|
| RSI (14) | 56.24 | Neutral | Upward bias on 1H, but daily trend is bearish. |
| MACD Histogram | -0.08 | Bearish | Negative momentum on 1H chart. |
| Stochastic | K:55.49, D:49.75 | Bullish | Bullish crossover on 1H, not overbought. |
| ADX | 14.97 | Neutral | Weak trend strength on 1H, indicating consolidation. |
| Bollinger | Middle Band | Watch | Price above middle band on 1H, suggesting potential upside. |
Track markets in real-time
AI-powered analysis, technical indicators and real-time price data.
Join Our Telegram Channel
Breaking market news, AI analysis and trading signals instantly.
Join Channel