The precious metals market has been a focal point of intense speculation and volatility, and silver, or XAGUSD, is no exception. Last week saw silver trading around the critical $69.66 mark, a level that has become a battleground for bulls and bears alike. With geopolitical tensions simmering and macroeconomic indicators flashing mixed signals, understanding the key levels and the underlying fundamental drivers is more crucial than ever for any trader navigating these choppy waters. This analysis delves into the technical landscape of XAGUSD, examining the confluence of indicators and economic factors that are shaping its trajectory, and provides a forward-looking perspective on what to expect in the coming week.
- XAGUSD is consolidating around $69.66, with the 1-hour RSI at 52.67 indicating neutral momentum but a slight upward lean.
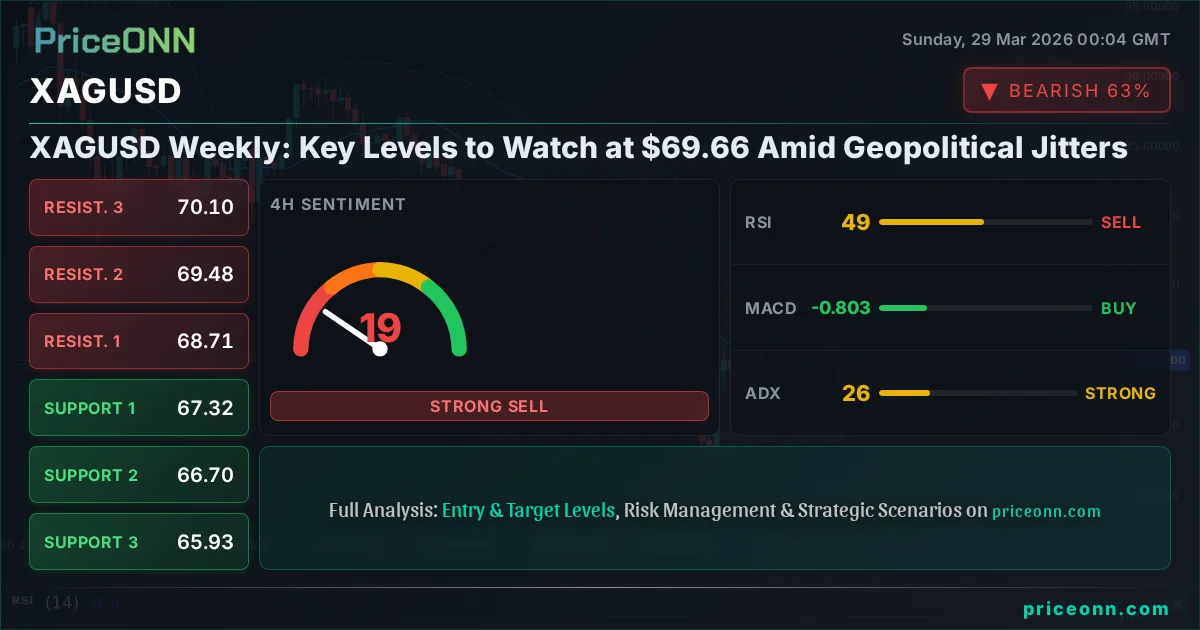
- Key support is identified at $68.59, a level that needs to hold for any bullish continuation, while resistance looms at $70.65.
- The 1-day trend shows a bearish bias (90% strength) with RSI at 36.2, suggesting underlying weakness despite short-term fluctuations.
- Geopolitical risks remain elevated, potentially supporting safe-haven demand for silver, but a strengthening DXY (currently 99.79) poses a counteracting headwind.
Navigating the Silver Landscape: A Look at Key Technical Indicators
The technical picture for XAGUSD presents a complex interplay of signals across different timeframes, demanding a nuanced approach. On the 1-hour chart, the trend is currently neutral, with a strength of 50%. The Relative Strength Index (RSI) hovers at 52.67, suggesting a lack of strong directional conviction but a slight upward inclination. This is corroborated by positive momentum on the MACD, which sits above its signal line, and the Bollinger Bands, which are positioned above the middle band, indicating a leaning towards bullish sentiment in the very short term. However, the Stochastic oscillator presents a counter-signal, with %K at 56.24 and %D at 61.70, indicating a potential bearish divergence and a possible pullback. The ADX, measuring trend strength, sits at 19.81, pointing to a weak trend, which aligns with the neutral sentiment. This 1-hour outlook suggests a market that is hesitant, with conflicting signals that could lead to range-bound trading or a sharp move if a significant catalyst emerges.
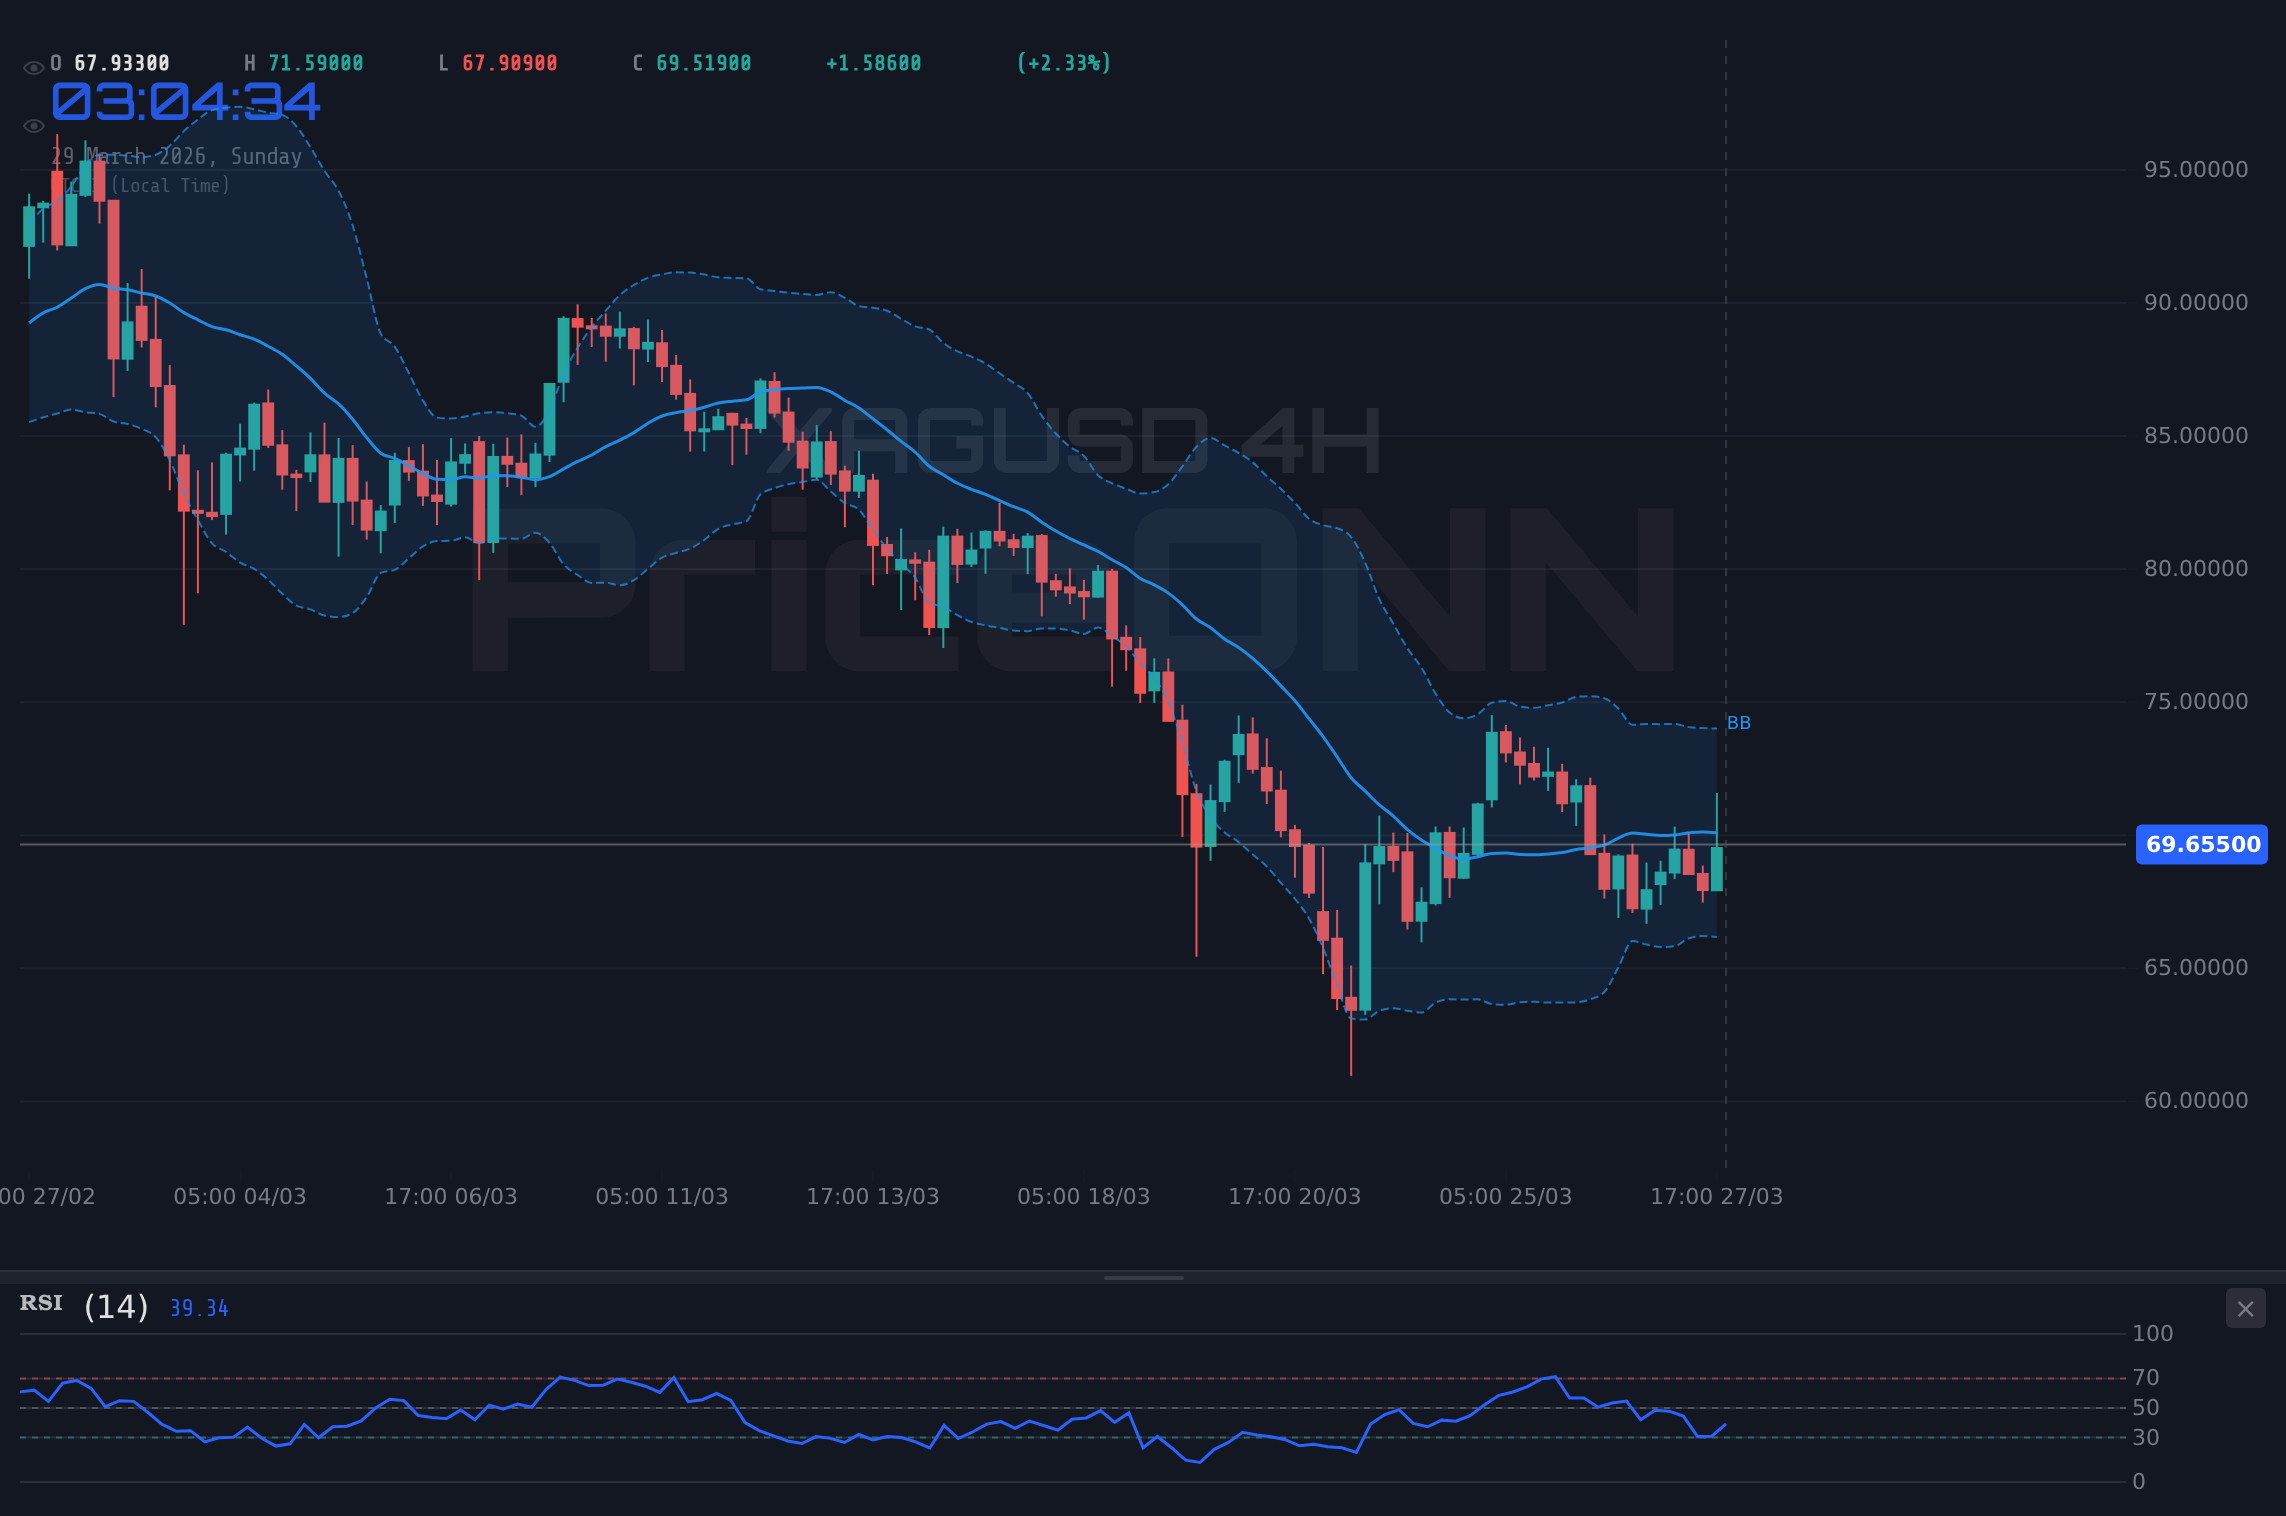
Shifting to the 4-hour timeframe, the narrative begins to change, revealing a stronger bearish undertone. Here, the trend is officially classified as bearish, with a significant strength of 84%. The RSI at 50.32 is remarkably neutral, suggesting indecision, but the Stochastic oscillator shows a clear bullish signal with %K (51.25) above %D (32.02). This divergence between the RSI and Stochastic on the 4-hour chart warrants attention. The MACD also shows positive momentum, and the Bollinger Bands are above the middle band, hinting at potential upside. However, the ADX at 28.83 indicates a strong trend, and when viewed against the overall bearish classification, it suggests that any upward movement might be a counter-trend rally within a larger downtrend. The general signal on this timeframe leans towards BUY, but the underlying trend strength and bearish classification cast a shadow of doubt on the sustainability of any gains.
The daily chart, however, paints the clearest picture of the prevailing sentiment, firmly establishing a bearish trend with a formidable 90% strength. The current price of $69.66 is well below the daily resistance levels, with the nearest significant barrier at $4497.62. The RSI(14) at 36.2 is firmly in the neutral zone but trending downwards, indicating weakening buying pressure. The MACD is exhibiting negative momentum, trading below its signal line, and the Bollinger Bands are situated below the middle band, reinforcing the bearish outlook. The Stochastic oscillator, while showing a bullish signal with %K (36.92) above %D (25.3), often acts as a lagging indicator in strong trends. Crucially, the ADX at 30.99 signifies a strong trend, and in the context of the daily bearish classification, this suggests that the downward momentum is robust and likely to continue. The overall signal on the daily timeframe is a clear SELL, underscoring the dominant bearish sentiment in the longer-term view.
The Crucial Role of Key Levels: Support and Resistance Dynamics
Understanding the critical support and resistance levels is paramount for navigating the XAGUSD market. On the 1-hour chart, immediate support is found at $69.62, followed by $69.05 and $68.59. These levels represent areas where buying interest has previously emerged, potentially halting further declines. Conversely, resistance lies at $70.65, $71.11, and $71.68. A decisive break above $70.65 could signal a short-term bullish reversal, but the strength of the longer-term trend must be considered. The 4-hour chart reinforces the significance of these levels, with support identified at $67.32, $66.70, and $65.93. These are deeper levels, and a fall below them would indicate a significant escalation of bearish pressure. Resistance on this timeframe is seen at $68.71, $69.48, and $70.10. The fact that the current price of $69.66 is hovering near the upper end of the 4-hour resistance zone, but well within the daily bearish territory, highlights the immediate tension in the market.
The daily chart’s support levels at $65.68, $63.43, and $60.19 are significant psychological and technical barriers. A sustained move below $65.68 would confirm the bearish trend and potentially open the door for a much larger correction. On the resistance side for the daily timeframe, $71.18, $74.42, and $76.67 are the levels to watch. For any bullish sentiment to return, silver would need to convincingly break and hold above the $71.18 mark, thereby challenging the established downtrend. The current price action at $69.66 is caught between the immediate 1-hour resistance and the broader daily bearish trend, creating a precarious balance.
The Interplay of Macroeconomics and Geopolitics on Silver Prices
The price of silver is not formed in a vacuum; it is deeply intertwined with global macroeconomic trends and geopolitical developments. The Dollar Index (DXY), currently trading at 99.79 and showing a strong upward trend on the daily chart, acts as a significant counterforce to silver prices. When the dollar strengthens, typically due to risk aversion or rising US interest rate expectations, commodities priced in dollars, like silver, tend to become more expensive for holders of other currencies, thus potentially dampening demand. The recent surge in oil prices, with Brent crude futures climbing significantly and WTI reaching $100.94, also plays a critical role. Higher oil prices can fuel inflation expectations, which historically have driven demand for precious metals as an inflation hedge. However, this effect can be counteracted if rising oil prices also lead central banks, particularly the Federal Reserve, to adopt a more hawkish stance on interest rates, thereby strengthening the dollar and pressuring gold and silver.
The broader market sentiment, as indicated by the performance of the SP500 and Nasdaq, provides further context. The sharp decline in the SP500 (down 2.03% to 6355.66) and Nasdaq (down 2.3% to 23076.09) last week signals a significant increase in risk aversion among investors. This 'risk-off' sentiment typically benefits safe-haven assets like gold and, to a lesser extent, silver. However, the simultaneous strength in the DXY complicates this traditional correlation. If the market perceives the US dollar as the ultimate safe haven amidst global turmoil, then the inverse relationship between DXY and silver might weaken, or even invert, as seen in some recent trading sessions. The Federal Reserve's monetary policy remains a key variable. While specific upcoming economic data releases were not detailed in the provided context, any indication of persistent inflation or a more hawkish tone from Fed officials could further bolster the dollar and pressure silver.
Geopolitical tensions in the Middle East, as highlighted in recent news, continue to be a significant underlying factor supporting precious metals. Reports of potential energy rationing and the US offering incentives to halt offshore wind projects underscore the fragility of the global energy supply chain and the broader geopolitical instability. Such events typically increase demand for safe-haven assets, providing a floor for silver prices. However, the market's reaction is often complex; while tensions might boost silver's appeal as a hedge, they can also trigger broader economic slowdown fears, which might eventually weigh on industrial demand for silver. The interplay between inflation hedging, safe-haven demand, and potential industrial slowdown concerns creates a dynamic environment that traders must continuously monitor. The upcoming economic calendar events, particularly those related to inflation and employment in major economies like the US and Europe, will be crucial in shaping the narrative for silver in the week ahead.
Market Sentiment and Divergences: Reading Between the Lines
Market sentiment for XAGUSD is a mixed bag, characterized by conflicting signals across different timeframes and indicators. The short-term 1-hour chart leans neutral to slightly bullish, with indicators like MACD and Bollinger Bands suggesting upward momentum. However, this is tempered by the Stochastic oscillator’s bearish divergence and the overall weak trend indicated by the ADX at 19.81. This suggests that any short-term gains might be fragile and susceptible to quick reversals. The 4-hour timeframe introduces a stronger bearish bias, despite some bullish signals from Stochastic and Bollinger Bands. The ADX at 28.83 points to a stronger trend, and when aligned with the overall bearish classification, it implies that the short-term bullish signals might be temporary pullbacks within a dominant downtrend.
The daily timeframe provides the most definitive sentiment reading: strongly bearish. The RSI at 36.2, MACD's negative momentum, and the Bollinger Bands below the middle band all paint a picture of underlying weakness. The ADX at 30.99 confirms a strong trend, indicating that sellers are in control. This longer-term perspective is crucial. While short-term traders might find opportunities in counter-trend moves, the broader trend suggests caution and a bias towards seeking opportunities on the short side, provided risk management is strictly adhered to. The general signals across all timeframes are predominantly SELL, with only the 1-hour and 4-hour charts showing some conflicting BUY signals, likely reflecting short-term fluctuations rather than a change in the dominant trend. This divergence is where careful analysis and a robust trading strategy become essential.
The recent news flow also adds layers to the sentiment analysis. Reports of rising oil prices fueling stagflation fears, coupled with a strengthening dollar, create a complex environment for silver. While stagflationary environments often favor commodities as inflation hedges, a strong dollar can negate these benefits. The significant drops in major equity indices like the SP500 and Nasdaq indicate a clear risk-off sentiment. Traditionally, this would boost safe-haven assets. However, the market's current interpretation of the US dollar as the primary safe haven in this specific turmoil means that the usual inverse correlation might not hold. This uncertainty requires traders to be exceptionally vigilant, focusing on price action and key levels rather than relying solely on traditional correlations.
Strategic Considerations: What Traders Should Watch Next Week
Looking ahead, the coming week for XAGUSD will likely be shaped by the interplay between ongoing geopolitical risks, central bank policy signals, and key economic data releases. Traders will be closely watching the $69.66 level as immediate support. A failure to hold this price point could see a rapid descent towards the $69.05 and $68.59 support levels. The $68.59 level is particularly significant; a break below it would likely invalidate any short-term bullish thesis and open the path towards the 4-hour support at $67.32. Conversely, for any sustained upside move, silver needs to overcome the immediate 1-hour resistance at $70.65. A clear break and hold above this level, ideally with increasing volume, could signal a short-covering rally, potentially targeting the $71.11 and $71.68 resistance zones. However, given the prevailing bearish trend on the daily chart, such a move would likely face significant headwinds.
The macroeconomic calendar will be a key driver. Any data releases that suggest persistent inflation or a more hawkish stance from the Federal Reserve could strengthen the DXY (currently at 99.79) and put renewed pressure on silver. Conversely, signs of economic cooling or a dovish shift in central bank rhetoric could weaken the dollar and provide support for XAGUSD. The correlation with oil prices also remains a critical factor. If geopolitical tensions continue to push oil prices higher, this could feed into inflation concerns, but the market's reaction will depend heavily on how central banks respond. The overall market sentiment, reflected in equity markets, will also be important. A continued sell-off in stocks could increase safe-haven demand, but the DXY's strength might cap silver's gains.
From a technical perspective, the divergence in signals across timeframes is the most compelling aspect. The short-term bullish leanings on the 1-hour chart are overshadowed by the strong bearish trend on the daily chart. This suggests that while short-term traders might look for tactical long positions on pullbacks to support, the overall bias should remain cautious. Confirmation of any trend change would require a sustained break above key daily resistance levels, such as $71.18, ideally coupled with a shift in momentum indicators and a weaker dollar. Until then, the path of least resistance appears to be downwards, with significant support levels at $65.68 and below holding the key to the medium-term outlook.
Bearish Scenario: Downside Momentum Builds
65% ProbabilityNeutral Scenario: Range-Bound Consolidation
25% ProbabilityBullish Scenario: Short Covering Rally
10% ProbabilityFrequently Asked Questions: XAGUSD Analysis
What happens if XAGUSD breaks below the $68.59 support level?
A decisive break below $68.59 on the 1-hour chart would signal a significant acceleration of the bearish trend. This could lead to a rapid decline towards the 4-hour support at $67.32, and potentially challenge the $65.68 level on the daily chart.
Should I consider buying XAGUSD at current levels around $69.66 given the mixed signals?
Buying at current levels carries significant risk due to the dominant bearish trend on the daily chart. While short-term pullbacks to support might offer tactical opportunities, a clear invalidation of the bearish thesis would require a sustained move above daily resistance at $71.18. Traders should prioritize risk management and wait for clearer directional confirmation.
Is the RSI at 52.67 on the 1-hour chart a buy signal for XAGUSD?
An RSI of 52.67 is in the neutral zone and shows a slight upward inclination, but it does not constitute a strong buy signal on its own. It indicates a lack of strong directional conviction in the short term. For a bullish signal, we would look for RSI to move decisively above 60, ideally coupled with other bullish indicators confirming the trend.
How will the current DXY strength around 99.79 affect XAGUSD this week?
The current strength of the DXY at 99.79, supported by a strong daily uptrend, generally exerts downward pressure on XAGUSD as the dollar becomes more expensive for foreign buyers. This macro headwind needs to be overcome by bullish catalysts for silver to sustain any significant upward moves.
| Indicator | Value | Signal | Interpretation |
|---|---|---|---|
| RSI (14) | 52.67 | Neutral | Slight upward lean on 1H, but bearish on 1D (36.2) |
| MACD Histogram | Positive | Bullish Momentum | Positive on 1H/4H, but context is key against daily trend |
| Stochastic | K=56.24, D=61.70 | Bearish Divergence | On 1H, suggests potential pullback despite other indicators |
| ADX | 19.81 | Weak Trend | Indicates consolidation or lack of strong directional commitment on 1H |
| Bollinger | Middle Band Break | Bullish Lean | Price above middle band on 1H/4H suggests short-term upside potential |
The XAGUSD market is at a critical juncture. While short-term technicals show some signs of life, the overarching bearish trend on the daily chart, coupled with a strengthening dollar and risk aversion in broader markets, presents significant headwinds. The $69.66 level is a key pivot point. A sustained hold above it could lead to a tactical bounce, but failure to do so opens the door for further downside towards established support levels. Traders must remain vigilant, monitor key economic data and geopolitical developments, and adhere strictly to risk management principles. The coming week will likely be defined by whether silver can muster the strength to challenge resistance levels or succumb to the prevailing bearish pressure.
Track markets in real-time
AI-powered analysis, technical indicators and real-time price data.
Join Our Telegram Channel
Breaking market news, AI analysis and trading signals instantly.
Join Channel