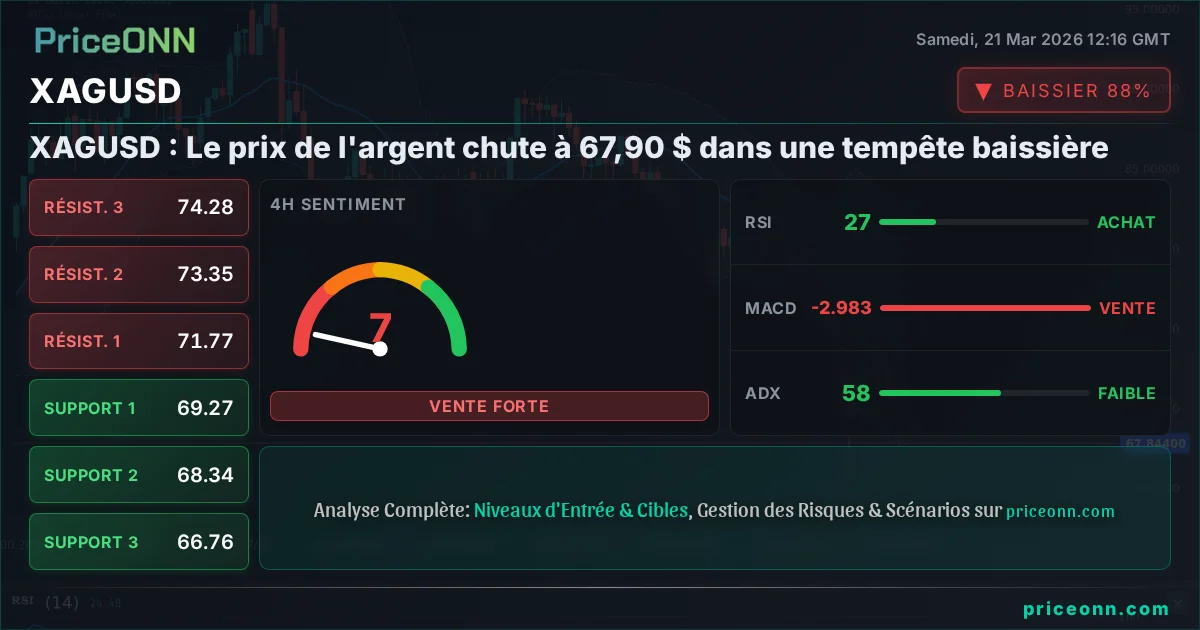
XAGUSD : Le prix de l'argent chute à 67,90 $ dans une tempête baissière
L'argent a connu une forte baisse, chutant de plus de 6,80 % pour s'échanger à 67,90 $. La paire XAG/USD fait face à de forts vents contraires, les indicateurs techniques étant au rouge et les facteurs macroéconomiques pesant lourdement.
Le métal précieux, l'argent, souvent considéré comme un baromètre du sentiment du marché et de la demande industrielle, a traversé une semaine brutale. S'échangeant précisément à 67,90 $, le XAGUSD a perdu 6,80 % dans ce qui a été une période profondément baissière. Cette forte baisse, survenue alors que les prix du pétrole brut augmentaient et que les principaux indices boursiers comme le S&P 500 et le Nasdaq connaissaient des replis notables, dresse un tableau complexe pour les investisseurs. La confluence d'un indice du dollar américain (DXY) en renforcement, qui tourne autour de 99,39, et d'un sentiment de plus en plus faucon concernant les changements potentiels de politique des banques centrales a créé une tempête parfaite, poussant les prix de l'argent à des niveaux critiques. Cette analyse plonge dans les facteurs qui ont conduit à cette chute précipitée et explore les perspectives de l'argent pour la semaine à venir, en disséquant les arguments haussiers et baissiers avec une précision basée sur les données.
- Le RSI de l'argent est actuellement à 33,56 sur le graphique journalier, indiquant des conditions de survente mais sans parvenir à dissuader le fort élan baissier.
- Le niveau de support critique pour le XAGUSD se maintient précairement à 66,58 $, une rupture en dessous de laquelle pourrait déclencher de nouvelles baisses significatives.
- Les lectures de l'histogramme MACD sur plusieurs horizons temporels montrent un élan négatif persistant, suggérant que la pression vendeuse est loin de s'atténuer.
- La corrélation avec un DXY en renforcement (actuellement 99,39) est un obstacle majeur, car un dollar plus fort rend généralement les actifs libellés en dollars comme l'argent plus chers pour les acheteurs étrangers.
Le Cas Baissier : Pourquoi l'Argent est Assiégé
Le récit entourant l'argent cette semaine a été majoritairement négatif, alimenté par un puissant cocktail de pressions macroéconomiques et techniques. Le développement le plus frappant a été la vitesse de la baisse ; les prix de l'argent ont chuté de plus de 6 % en une seule journée et se dirigent vers leur deuxième plus forte perte hebdomadaire de l'année. Il ne s'agit pas d'une simple correction ; c'est une capitulation significative motivée par l'évolution de la dynamique du marché. Le principal catalyseur semble être un recalibrage des attentes en matière de taux d'intérêt. Bien que la position de la Réserve fédérale reste un point central, les données persistantes sur l'inflation, même avec une certaine volatilité récente, suggèrent un environnement de taux d'intérêt plus élevés plus longtemps. Des taux plus élevés augmentent le coût d'opportunité de la détention d'actifs sans rendement comme l'argent, les rendant moins attrayants par rapport aux instruments à revenu fixe. De plus, l'indice du dollar américain (DXY) en renforcement, qui a montré un solide élan ascendant et s'échange actuellement autour de 99,39, agit comme un obstacle important. Un dollar plus fort rend intrinsèquement l'argent, coté en dollars, plus cher pour les détenteurs d'autres devises, freinant ainsi la demande. Cette relation inverse est un principe bien établi sur les marchés des changes et des matières premières, et sa manifestation actuelle pèse clairement sur le XAGUSD.
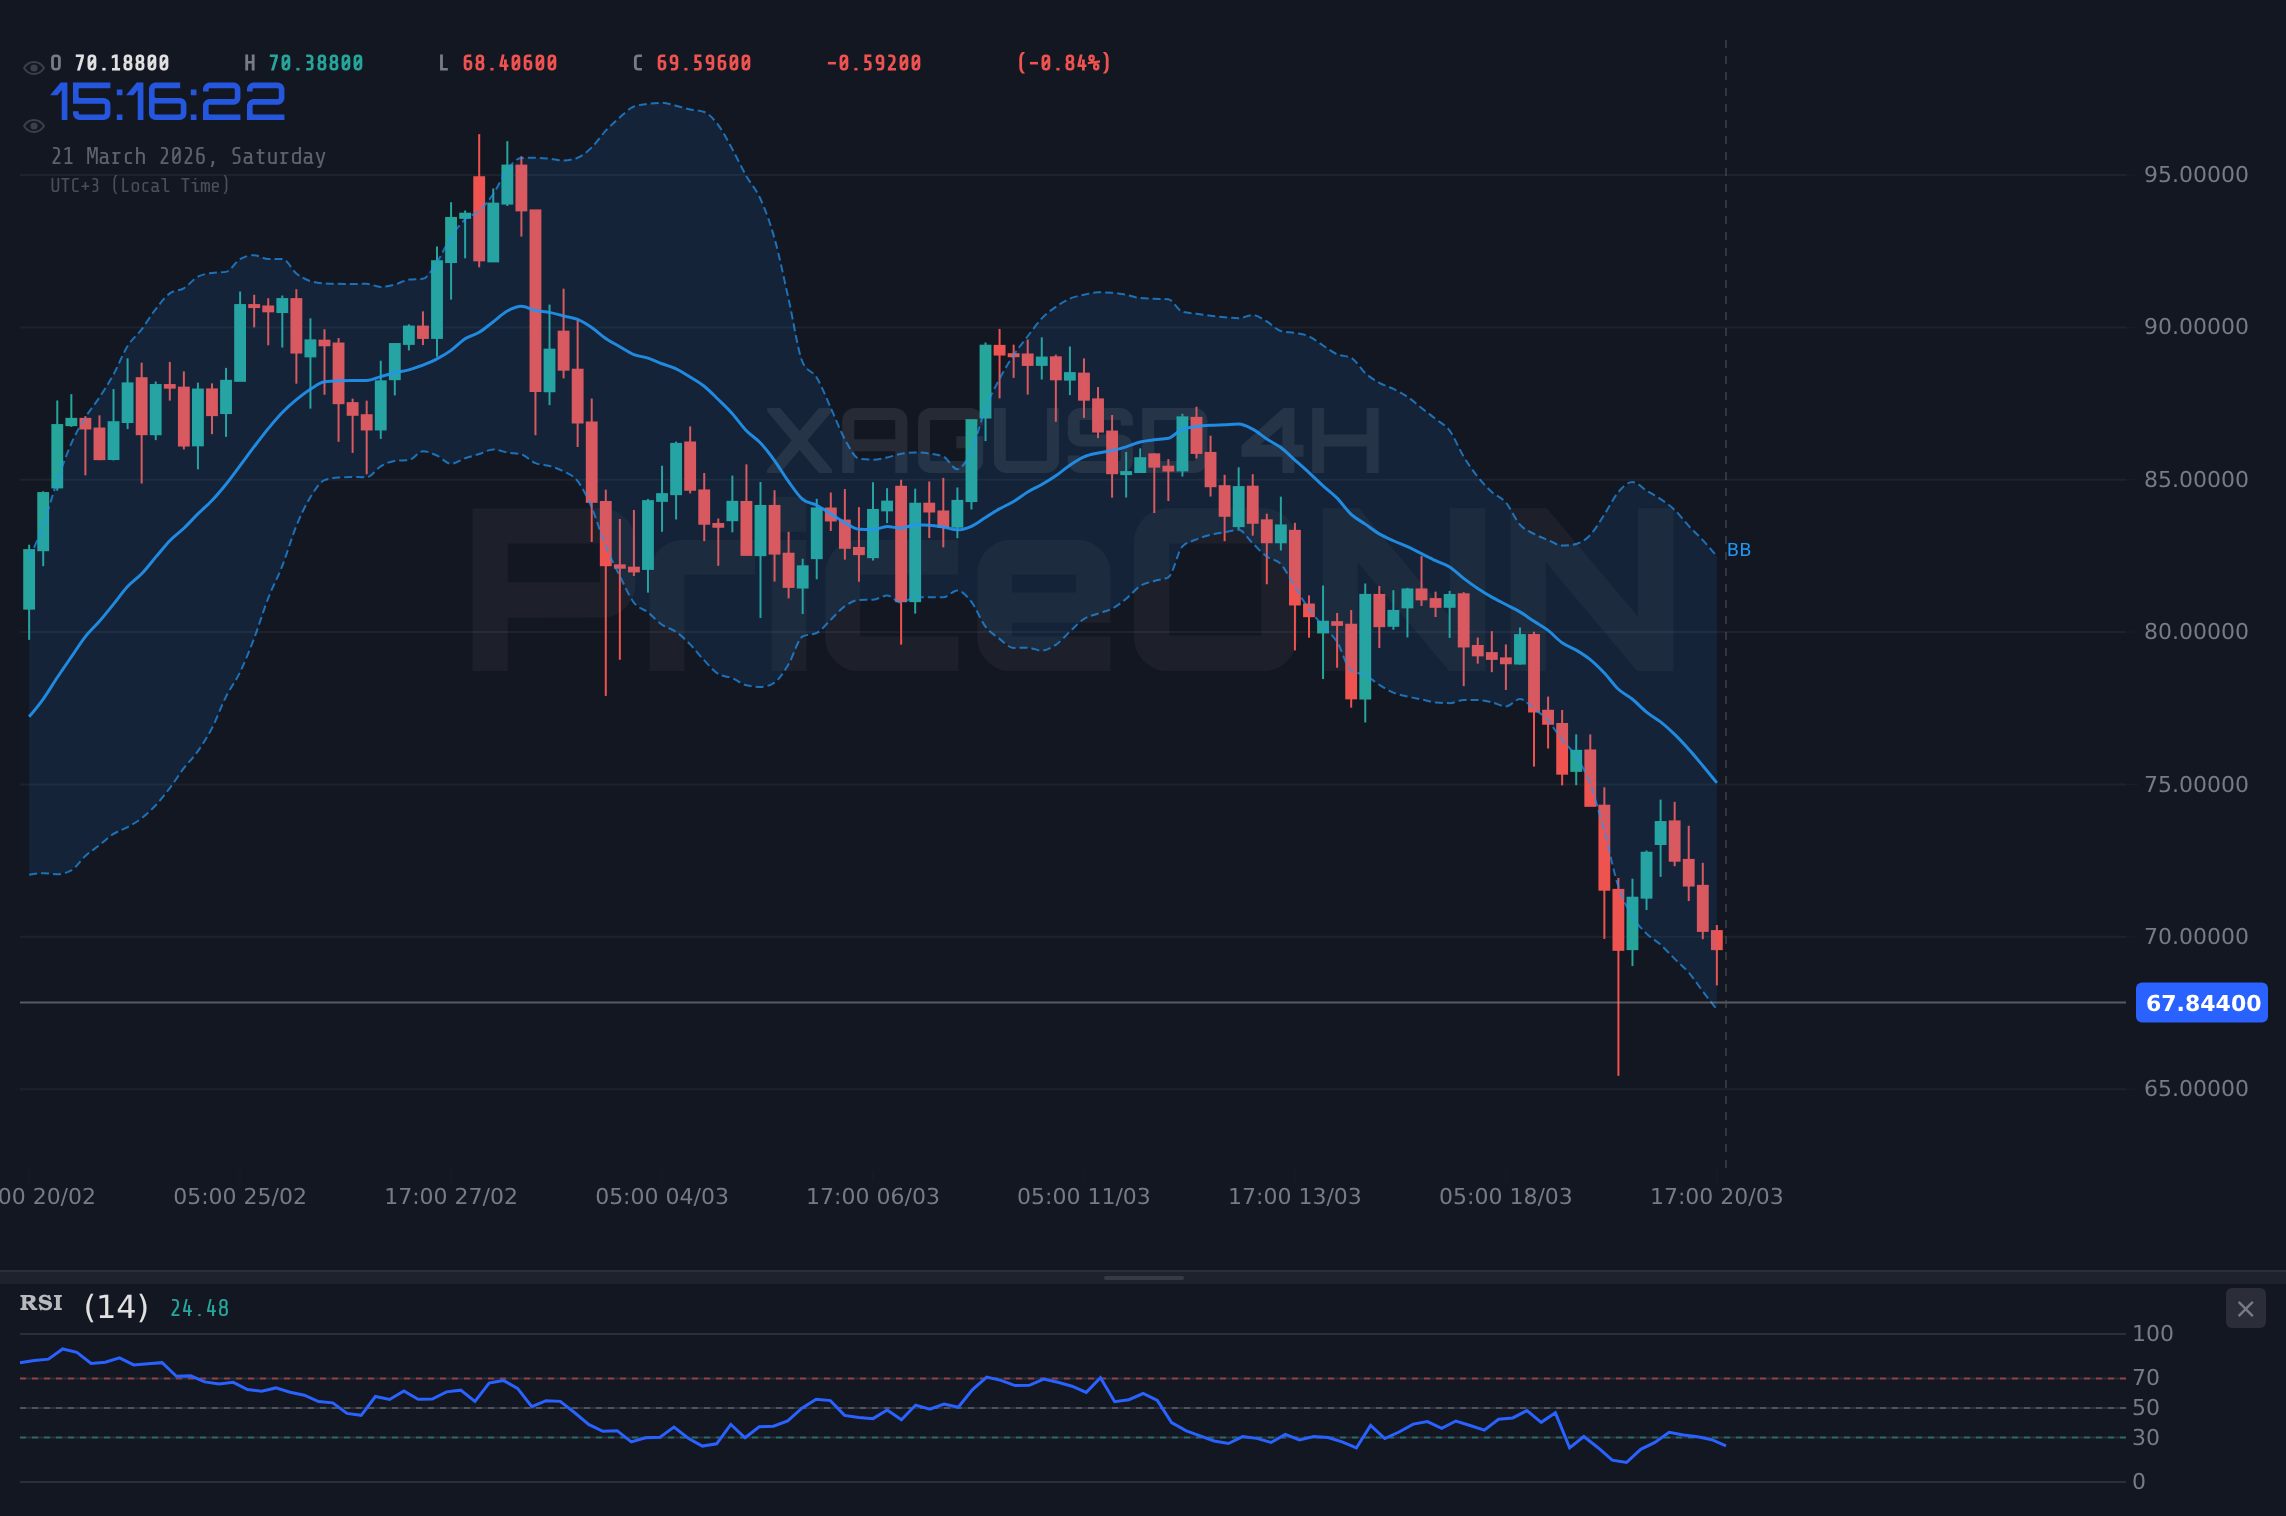
Techniquement, le tableau est tout aussi sombre pour les haussiers. Sur le graphique horaire, la tendance est décisivement baissière avec une force de 98 %, soutenue par une cascade de signaux négatifs. Le RSI(14) à 30,51, bien que techniquement en territoire neutre, est entraîné par un élan descendant, suggérant un potentiel de baisse supplémentaire avant tout rebond significatif de survente. Le MACD est fermement en dessous de sa ligne de signal, indiquant un fort élan négatif. Les bandes de Bollinger sur l'horizon temporel d'une heure montrent le prix s'échangeant en dessous de la bande inférieure, un signe de pression baissière extrême et de potentiel de rebond à court terme en survente, mais pas un signal de renversement. L'ADX à 36,09 confirme une forte tendance baissière. L'horizon temporel de 4 heures amplifie ce sentiment baissier, avec une force de tendance de 100 % et un ADX atteignant 62,9, ce qui signifie une très forte tendance baissière. Le RSI à 27,22 est profondément en survente, et bien que cela précède souvent un rebond, la force de la tendance suggère que de tels rebonds pourraient être de courte durée et rencontrés par une pression vendeuse renouvelée. Les oscillateurs stochastiques sont également profondément en territoire de survente, mais dans une forte tendance baissière, ceux-ci peuvent rester en survente pendant des périodes prolongées. Le graphique journalier, tout en montrant une tendance 'Neutre' avec une force de 50 % et un ADX plus faible de 19,51, est toujours fortement influencé par le sentiment baissier prédominant à court et moyen terme. Le RSI à 29,58 et le Stochastique à des niveaux extrêmement bas (K=8,5, D=13,09) suggèrent que le marché est en survente sur un horizon temporel plus long, mais la vente agressive actuelle indique que ces niveaux pourraient être franchis avant qu'une reprise durable ne puisse se produire. Le signal global sur tous les horizons temporels analysés penche fortement vers 'VENDRE', renforçant le sentiment baissier.
Les tensions géopolitiques, en particulier au Moyen-Orient, ont historiquement stimulé la demande de valeurs refuges pour l'or, mais la réaction de l'argent a été plus complexe. Bien que certains puissent s'attendre à ce que l'argent bénéficie des flux de valeurs refuges, le récit actuel semble dominé par un sentiment général de prudence qui pèse également sur les matières premières industrielles et les actifs plus risqués. Les récentes nouvelles soulignant une forte chute des prix de l'or (en baisse de 8,50 % cette semaine) et des baisses importantes dans les actions minières, avec des milliards effacés de leur valeur, soulignent qu'il ne s'agit pas d'une vente sélective mais d'un marché baissier général des matières premières en jeu. Cela suggère que même si les tensions géopolitiques devaient s'intensifier, la réaction immédiate de l'argent pourrait être dictée davantage par des préoccupations de liquidité et un désendettement à travers les classes d'actifs plutôt que par une fuite vers la sécurité. La nouvelle selon laquelle les prix de l'argent ont chuté de plus de 6 % en une seule journée et se dirigent vers leur deuxième plus forte perte hebdomadaire de l'année reflète directement cette pression. L'implication est que les traders liquident des positions dans l'ensemble, et l'argent, avec son double rôle de métal précieux et de matière première industrielle, est particulièrement vulnérable dans un tel environnement. La vente généralisée des matières premières, associée aux vents contraires macroéconomiques, crée un défi redoutable pour les haussiers de l'argent.
Plusieurs indicateurs techniques, y compris les oscillateurs RSI, MACD et Stochastique sur les horizons temporels 1H, 4H et 1J, affichent de forts signaux de vente. Les valeurs ADX, en particulier sur les graphiques horaires (36,09) et 4 heures (62,9), confirment des conditions de tendance baissière très fortes, suggérant que l'élan baissier actuel est peu susceptible de s'inverser sans changements fondamentaux ou techniques significatifs.
Le Cas Haussier : Recherche de Valeur en Territoire de Survente
Malgré le sentiment baissier écrasant, il y a des arguments à faire valoir pour un potentiel rebond de l'argent. L'argument le plus convaincant repose sur les conditions de survente indiquées par plusieurs indicateurs techniques clés. Sur le graphique journalier, le RSI(14) est à 29,58, et l'oscillateur Stochastique montre %K à 8,5 et %D à 13,09. Ces lectures sont profondément en territoire de survente, suggérant historiquement qu'une baisse de prix significative pourrait avoir épuisé son pouvoir de vente immédiat. De tels niveaux précèdent souvent un rebond, car les vendeurs commencent à prendre leurs profits et les acheteurs opportunistes interviennent. Bien que la force de la tendance baissière actuelle (ADX à 19,51 sur le graphique journalier) soit faible, indiquant un manque de conviction directionnelle forte sur cet horizon temporel, cela implique également qu'une inversion, si elle se produit, pourrait ne pas rencontrer immédiatement une opposition écrasante d'une tendance forte. Les graphiques horaires et 4 heures montrent également des conditions de survente, avec des RSI à 30,51 et 27,22 respectivement, et des oscillateurs Stochastiques profondément dans les plages basses. Cette image technique généralisée de survente suggère que l'argent est 'dû' pour une correction, du moins à court terme. Les traders à la recherche de valeur pourraient interpréter ces niveaux comme un point d'entrée attractif, anticipant une reversion à la moyenne ou un rebond technique.
De plus, les moteurs fondamentaux qui soutiennent généralement les prix de l'argent ne sont pas entièrement absents, même s'ils sont actuellement éclipsés. La double nature de l'argent, à la fois métal précieux et matière première industrielle, offre une dynamique de demande unique. Bien que la demande industrielle puisse être sensible aux ralentissements économiques mondiaux, les perspectives à long terme de l'argent restent solides, tirées par son rôle essentiel dans la technologie, les énergies renouvelables (panneaux solaires) et l'électronique. Alors que les économies se tournent vers des technologies plus vertes, la demande d'argent devrait croître. Les achats d'or par les banques centrales ont atteint des niveaux record, et bien que l'argent ne connaisse pas la même thésaurisation institutionnelle, son utilité industrielle fournit un support de base moins susceptible au sentiment purement spéculatif. Si les préoccupations inflationnistes réapparaissent ou si les banques centrales s'orientent vers des cycles d'assouplissement plus tôt que prévu, l'argent pourrait en bénéficier considérablement. La vente agressive actuelle pourrait être excessive, créant un décalage entre le prix et sa valeur fondamentale sous-jacente, surtout si l'on considère ses applications industrielles à long terme. La nouvelle selon laquelle les sociétés minières réorganisent leurs piles technologiques pourrait également être interprétée comme un signe d'investissement à long terme et d'améliorations de l'efficacité, ce qui, au fil du temps, pourrait soutenir la stabilité de l'offre, voire sa croissance, mais l'action des prix immédiate est dominée par les ventes.
Le prix actuel de 67,90 $ représente lui-même un niveau psychologique important. Bien qu'il soit le résultat d'une forte baisse, il représente également un point de retournement potentiel si les acheteurs parviennent à rassembler suffisamment de conviction. Les niveaux de support identifiés à 67,33 $, 66,59 $ et 65,40 $ sur le graphique horaire, et 66,58 $, 60,41 $ et 55,38 $ sur le graphique journalier, représentent des zones où l'intérêt acheteur pourrait émerger. Un échec à maintenir ces niveaux invaliderait le cas haussier immédiat, mais une défense réussie pourrait déclencher un rallye de soulagement. La nouvelle selon laquelle les actions de Santacruz Silver Mining (SCZM) sont entrées en territoire de survente à 6,90 $, avec des indicateurs techniques signalant un potentiel de renversement, pourrait être un indicateur avancé pour le marché général de l'argent. Si les principaux producteurs d'argent commencent à montrer des signes de stabilisation technique ou de rebonds potentiels, cela pourrait suggérer que le prix du métal lui-même approche d'un plancher, même au milieu de la volatilité actuelle du marché. La réaction du marché à ces conditions de survente sera cruciale pour déterminer si l'action des prix actuelle n'est qu'une pause dans la tendance baissière ou le début d'une reprise plus soutenue.
Les lectures RSI et Stochastique profondément en survente sur les graphiques journaliers et horaires suggèrent que l'argent pourrait approcher d'un plancher à court terme. Historiquement, de telles lectures extrêmes ont souvent précédé des corrections de prix, offrant des opportunités d'achat potentielles pour les traders tactiques, à condition que les niveaux de support clés soient maintenus.
Combler le fossé : les techniques comme facteur décisif
Dans l'environnement de marché actuel, où l'incertitude macroéconomique et les risques géopolitiques créent des signaux contradictoires, l'analyse technique sert souvent d'arbitre. Pour le XAGUSD, les indicateurs techniques présentent un tableau divisé, penchant fortement vers la baisse sur les horizons temporels plus courts mais montrant des signes de conditions de survente extrêmes sur les plus longs. La pression vendeuse agressive, mise en évidence par les valeurs ADX dépassant 30 sur les graphiques intrajournaliers et 60 sur le graphique de 4 heures, indique une tendance baissière forte et engagée. Cette force suggère que les rebonds à court terme seront probablement vendus, plutôt que de marquer le début d'un rallye soutenu. Le fait que la force de la tendance journalière ne soit que de 50 % avec un ADX faible (19,51) est une arme à double tranchant ; cela signifie que la tendance baissière n'est pas encore pleinement établie sur une base journalière, mais cela implique également un manque de conviction haussière forte pour initier une inversion. Cela pourrait entraîner une action des prix erratique, où les baissiers contrôlent en intraday mais le marché peine à franchir de manière décisive les niveaux de support journaliers clés.
La corrélation avec l'indice du dollar américain (DXY) est un facteur critique à surveiller. Avec le DXY actuellement à 99,39 et montrant un élan ascendant, il exerce une pression baissière significative sur l'argent. Une hausse soutenue du DXY, peut-être alimentée par des données économiques américaines plus fortes que prévu ou des commentaires hawkish de la banque centrale, exacerberait probablement le déclin de l'argent. Inversement, tout signe de faiblesse du DXY, peut-être en raison d'un pivot dovish de la Fed ou d'une escalade du risque mondial bénéficiant à d'autres valeurs refuges, pourrait offrir à l'argent un certain répit. Le sentiment actuel du marché, tel qu'il est reflété dans le S&P 500 (6536,05) et le Nasdaq (23992,13) qui s'échangent tous deux à la baisse, suggère que l'aversion au risque est présente, ce qui profite généralement aux actifs de valeur refuge. Cependant, la vente généralisée des matières premières indique que ce mouvement de prudence conduit à un désendettement dans de nombreuses classes d'actifs, plutôt qu'à une fuite claire vers les valeurs refuges traditionnelles comme l'or et l'argent, ce qui complique la corrélation attendue. Les nouvelles concernant la chute des prix de l'or de 8,50 % cette semaine malgré la flambée des prix du pétrole soulignent ce comportement inhabituel du marché, où les relations traditionnelles semblent se rompre.
Les niveaux clés à surveiller sont donc primordiaux. À la baisse, le support immédiat à 67,33 $ et le support journalier plus significatif à 66,58 $ sont critiques. Une rupture soutenue en dessous de 66,58 $ déclencherait probablement des ordres stop-loss et accélérerait les baisses vers le prochain support majeur à 60,41 $ et potentiellement 55,38 $. À la hausse, la résistance se forme à 69,26 $ et 71,77 $. Pour que les haussiers retrouvent une quelconque maîtrise, l'argent doit non seulement tenir le support mais aussi franchir de manière décisive ces niveaux de résistance, idéalement avec un volume croissant et une divergence haussière confirmant sur des indicateurs comme le RSI et le MACD. Le signal actuel de 'VENTE' sur la plupart des horizons temporels intrajournaliers, malgré les conditions de survente sur les graphiques journaliers, suggère que les baissiers ont le dessus à court et moyen terme. Cependant, les lectures extrêmes de survente ne peuvent être ignorées indéfiniment. Un changement dans le DXY, une pause dans les attentes de hausse des taux, ou un événement géopolitique majeur déclenchant une demande généralisée de valeurs refuges pourrait rapidement modifier le paysage technique, transformant ces conditions de survente en un tremplin pour une reprise.
La divergence entre les signaux baissiers intrajournaliers et les conditions de survente journalières est la principale tension. Bien que la tendance à court terme soit fortement baissière, les lectures extrêmes sur le graphique journalier suggèrent que tout catalyseur significatif pourrait déclencher un rallye de couverture de positions courtes, vif. Cependant, jusqu'à ce que les niveaux de résistance clés soient franchis avec conviction, le risque principal demeure à la baisse, surtout avec un DXY fort et des sous-entendus de banque centrale hawkish.
Verdict : Prudence à l'horizon, mais l'opportunité se cache
Nous assistons actuellement à une bataille entre un fort élan technique baissier et des conditions de survente extrêmes qui précèdent historiquement les rebonds de prix. Sur les graphiques horaires et 4 heures, la tendance est sans équivoque baissière, avec des lectures ADX indiquant de puissantes tendances descendantes. Le RSI est profondément en territoire de survente sur ces cadres intrajournaliers, et le MACD continue d'imprimer un élan négatif. Cela suggère que tout mouvement ascendant immédiat sera probablement accueilli par une pression vendeuse, surtout alors que le DXY se maintient fermement autour de 99,39. La nouvelle selon laquelle les prix de l'argent ont chuté de plus de 6 % en une seule journée et se dirigent vers des pertes hebdomadaires importantes souligne la conviction baissière actuelle du marché. La vente généralisée des matières premières, y compris la forte baisse de l'or, renforce l'idée qu'il s'agit d'un mouvement de prudence affectant plusieurs classes d'actifs.
Cependant, le graphique journalier présente une perspective différente. Avec un RSI à 29,58 et un Stochastique profondément en survente, l'argent crie techniquement 'survente' sur un horizon temporel plus long. Cela suggère que bien que la tendance baissière puisse continuer à court terme, le potentiel de rebond ou d'inversion significatif augmente à mesure que le prix approche des niveaux de support journaliers clés, tels que 66,58 $. Le fait que l'ADX journalier soit relativement faible à 19,51 suggère également que la forte tendance baissière observée sur les graphiques intrajournaliers pourrait ne pas se traduire par un effondrement journalier complet, laissant place à une reprise potentielle si les niveaux de résistance clés comme 69,26 $ sont franchis. La demande industrielle sous-jacente pour l'argent, bien qu'actuellement éclipsée, fournit un plancher structurel qui pourrait empêcher un effondrement complet. Par conséquent, bien que les perspectives immédiates restent prudentes, avec les baissiers en contrôle, les conditions de survente présentent une opportunité potentielle pour les traders agiles de se positionner pour une reprise à court terme, à condition que les niveaux de prix clés soient respectés. La patience et la gestion des risques seront primordiales pour naviguer dans cet environnement volatil. Le marché signale la prudence, mais les lectures extrêmes de survente sur les horizons temporels plus longs suggèrent une valeur potentielle pour ceux qui sont prêts à attendre des signaux plus clairs.
Questions Fréquentes : Analyse XAGUSD
Que se passe-t-il si le XAGUSD passe sous le niveau de support de 66,58 $ ?
Une rupture décisive sous le niveau de support de 66,58 $ sur le graphique journalier déclencherait probablement une pression vendeuse supplémentaire significative. Cela pourrait accélérer les baisses vers le prochain support majeur à 60,41 $, à mesure que les ordres stop-loss sont déclenchés et que les traders de momentum entrent dans des positions courtes. L'ADX sur le graphique de 4 heures à 62,9 indique une tendance baissière très forte, suggérant qu'une telle rupture pourrait entraîner une dépréciation rapide des prix.
Le RSI à 33,56 est-il un signal d'achat pour le XAGUSD en ce moment ?
Bien qu'un RSI de 33,56 sur le graphique journalier indique des conditions de survente, ce n'est pas un signal d'achat direct isolé, surtout compte tenu du fort élan baissier ailleurs. Le RSI sur 4 heures à 27,22 et le RSI horaire à 30,51 montrent des lectures de survente similaires, mais les valeurs ADX sur ces horizons temporels plus courts (36,09 et 62,9) confirment une tendance baissière puissante. Un signal d'achat nécessiterait une confirmation, telle que le maintien des prix au-dessus des supports clés et la rupture des niveaux de résistance, idéalement avec une divergence haussière.
Comment le renforcement du DXY à 99,39 affectera-t-il les prévisions de prix du XAGUSD ?
Un indice du dollar américain (DXY) en renforcement à 99,39 exerce généralement une pression baissière sur les prix de l'argent, car le XAGUSD est coté en dollars. Cela rend l'argent plus cher pour les acheteurs utilisant d'autres devises, ce qui pourrait réduire la demande. La corrélation actuelle suggère qu'une force accrue du DXY pourrait exacerber le déclin de l'argent, rendant plus difficile pour les haussiers d'initier un rallye soutenu jusqu'à ce que l'élan ascendant du dollar faiblisse.
Que devraient surveiller les traders pour la semaine à venir concernant le XAGUSD ?
Les traders devraient surveiller de près le point de prix de 67,90 $ et le support critique à 66,58 $. Un maintien au-dessus de ce niveau pourrait entraîner un rallye de couverture de positions courtes vers la résistance à 69,26 $. Inversement, une rupture sous 66,58 $ renforcerait le cas baissier. Les principales publications de données macroéconomiques et tout changement dans le discours des banques centrales seront également des catalyseurs cruciaux, influençant potentiellement le DXY et le sentiment de risque, et par conséquent la trajectoire de l'argent.
Scénario Baissier : Accélération de la Baisse
65% ProbabilitéScénario Neutre : Volatilité en Fourchette
25% ProbabilitéScénario Haussier : Rebond en Survente
10% Probabilité| Indicateur | Valeur | Signal | Interprétation |
|---|---|---|---|
| RSI (14) | 33.56 | Baissier | Survente sur le graphique journalier, mais fort élan baissier. |
| Histogramme MACD | -0.45 | Baissier | Élan négatif persistant sur tous les horizons temporels. |
| Stochastique (%K/%D) | 8.5/13.09 | Baissier | Profondément en survente sur le graphique journalier, mais la tendance reste baissière. |
| ADX | 19.51 | Neutre | Tendance faible sur le graphique journalier, mais forte sur les graphiques intrajournaliers. |
| Bandes de Bollinger | Bande Inférieure | Baissier | Le prix s'échangeant sous la bande inférieure indique une pression vendeuse extrême. |
Suivez les marchés en temps réel
Analyses IA et données en temps réel.