This past week, gold has been caught in a tug-of-war, grappling with significant geopolitical headwinds and a resurgent US Dollar. As Friday's trading session closed, XAUUSD found itself testing critical psychological and technical levels around $4,495.44. This price point, far from being just another number, represents a confluence of factors that have defined the precious metal's recent trajectory and will likely shape its path in the coming week. The narrative is complex, weaving together the threads of escalating global conflicts, shifting inflation expectations, and the ever-present influence of central bank monetary policy. For traders and investors, understanding the interplay of these forces is paramount to navigating the choppy waters ahead. The question on everyone's mind is whether the current bearish pressure is a temporary pause or the beginning of a more sustained downturn.
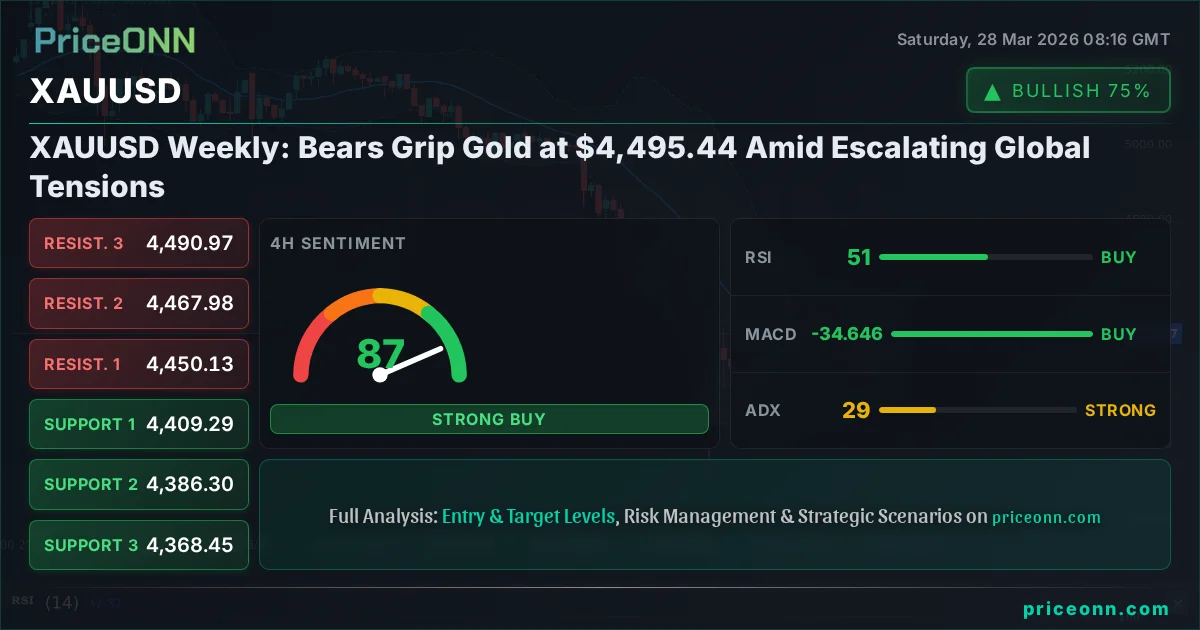
- XAUUSD closed Friday trading at $4,495.44, showing significant volatility throughout the week.
- The 1-Day RSI is at 36.34, indicating bearish momentum, while the 4-Hour RSI at 50.56 suggests a neutral stance in that timeframe.
- Key support is identified at $4,492.65 on the 1-hour chart, while resistance looms at $4,534.50.
- Geopolitical tensions, particularly the recent news regarding the Strait of Hormuz, are a primary driver for gold's safe-haven appeal.
The past week has been a dramatic chapter for gold, a testament to its role as a barometer of global uncertainty. We saw prices surge past the $4,500 mark earlier in the week, fueled by escalating geopolitical tensions, particularly the news of Iran shutting the Strait of Hormuz. This event, widely reported by commodities news outlets, directly impacted oil prices and heightened safe-haven demand for gold. However, this rally proved to be short-lived. As the week progressed, a strengthening US Dollar, driven by renewed inflation fears and a 'risk-off' sentiment gripping global equity markets, began to exert significant downward pressure on the yellow metal. The Dollar Index (DXY) has been steadily climbing, currently trading around 99.91, reinforcing the inverse correlation that often dictates gold's movements. This dynamic interplay between geopolitical fear and currency strength is central to understanding gold's current predicament. The battle for control between these opposing forces will be crucial in determining gold's direction moving forward.
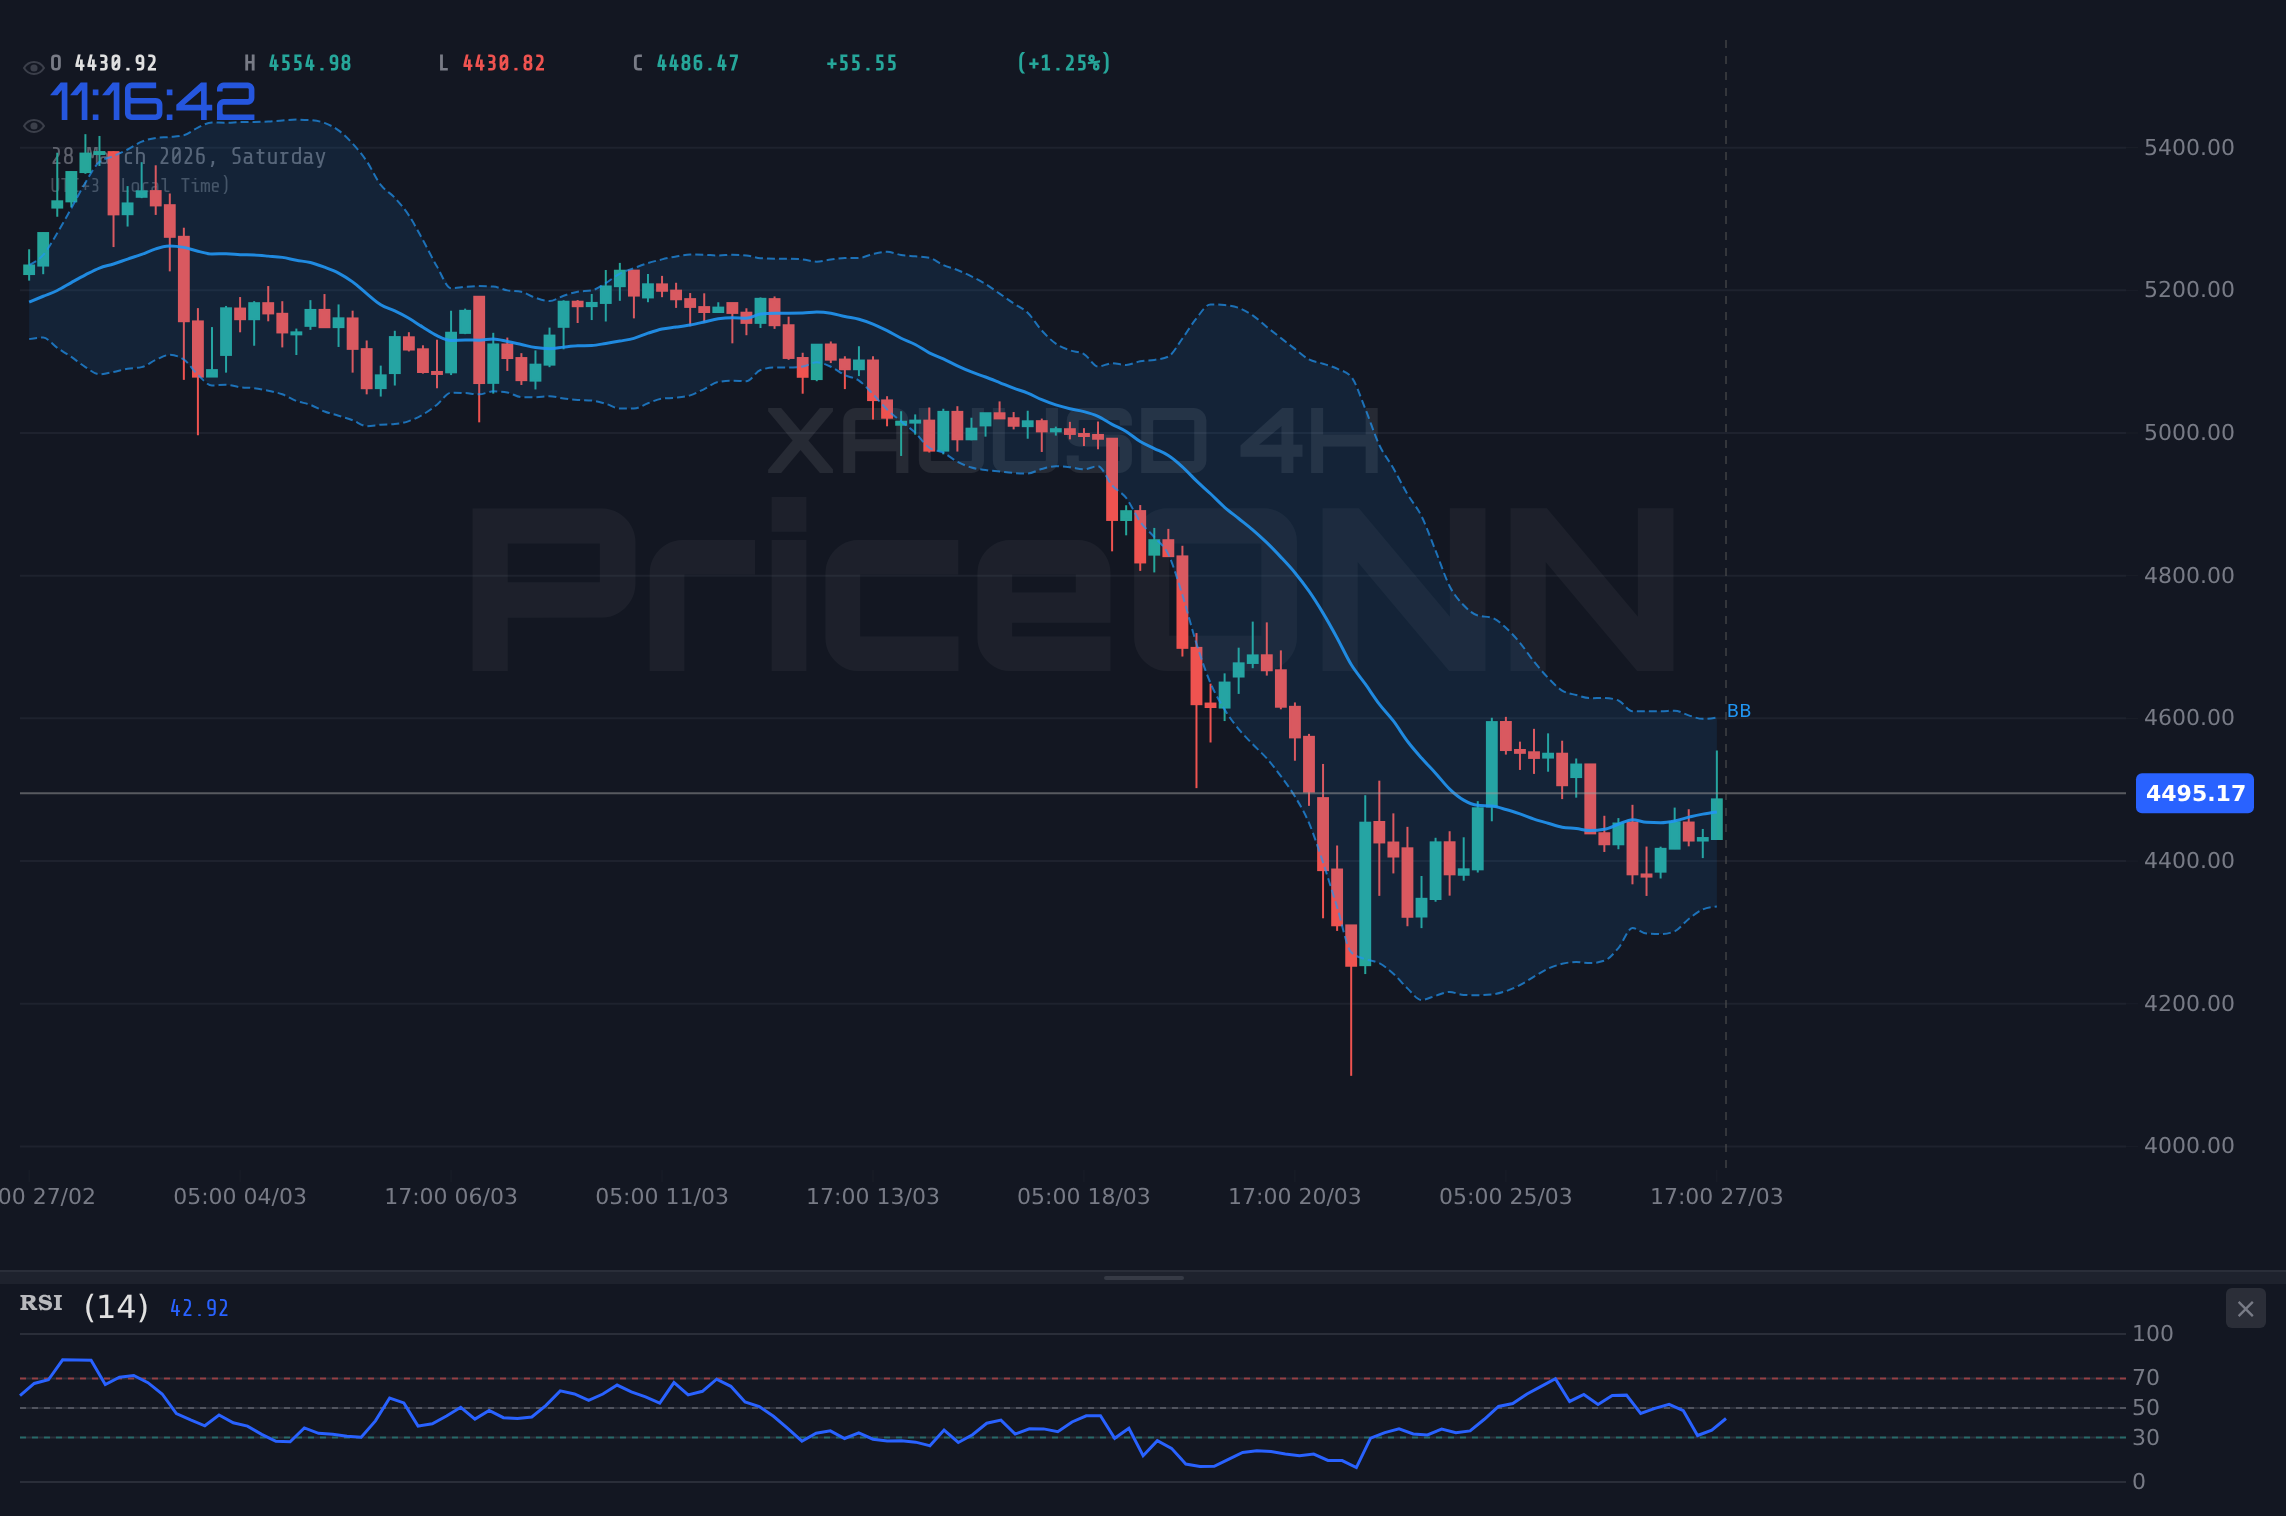
Digging into the technicals, the multi-timeframe analysis paints a mixed, yet predominantly bearish, picture for XAUUSD heading into the next trading week. On the daily chart, the trend is decisively bearish, with the ADX indicator at 30.99 signaling a strong downward trend. The RSI(14) sits at 36.34, firmly in neutral territory but with a clear downward eğilim, suggesting room for further decline before hitting oversold conditions. The MACD is below its signal line, and the Bollinger Bands are widening below the middle band, all confirming the bearish sentiment on the longest timeframe. However, the shorter timeframes offer a glimmer of hope for the bulls. The 1-hour chart, for instance, shows a neutral trend with an RSI of 56.67 and positive MACD momentum, indicating potential short-term buying interest or a pause in the selling pressure. The 4-hour chart presents a slightly more optimistic view than the daily, with an RSI of 50.56 and positive MACD momentum, though the ADX at 28.83 still points to a strong trend, albeit one that could be consolidating or nearing a reversal. This divergence across timeframes is precisely what makes gold trading so dynamic and challenging.
The recent surge in oil prices, with Brent crude closing at $110.64 and WTI at $101.19, has undoubtedly been a significant factor contributing to the inflation narrative. This rise in energy costs, directly linked to geopolitical instability in the Middle East, naturally fuels concerns about broader price pressures. Historically, gold has acted as a hedge against inflation, and this expectation is likely underpinning some of the demand we've seen. However, the market's reaction has been nuanced. While inflation fears provide a fundamental tailwind for gold, the simultaneous strengthening of the US Dollar complicates the picture. The DXY's upward trajectory, currently at 99.91, suggests that investors are favoring the dollar as a safe-haven asset, perhaps more so than gold at this particular moment. This is a critical point: the market is pricing in inflation risk, but it's also pricing in the Fed's potential response to that inflation, which often involves tighter monetary policy, thereby strengthening the dollar.
The correlation between the US Dollar Index (DXY) and gold is a cornerstone of precious metal analysis, and this week it has been particularly pronounced. As the DXY pushed higher, reaching levels near 99.91, gold struggled to maintain its gains. This inverse relationship is not merely theoretical; it's a practical reality for traders. When the dollar strengthens, it makes gold more expensive for holders of other currencies, potentially dampening demand. Furthermore, a stronger dollar can signal a 'risk-off' environment where investors liquidate assets perceived as riskier, including commodities, to seek refuge in the perceived safety of the greenback. The recent sharp decline in major US equity indices, the S&P 500 closing at 6357.55 and the Nasdaq at 23092.5, underscores this risk-averse sentiment. This broader market weakness further bolsters the dollar's safe-haven status, creating a double headwind for gold.
Navigating the Support and Resistance Landscape
Looking at the immediate price action, the $4,495.44 level for XAUUSD is not just a closing price; it's a battleground. On the 1-hour chart, immediate support is seen at $4,492.65. A break below this level could signal further downside, potentially targeting the next support at $4,468.70. The confluence of these 1-hour support levels, coupled with the broader bearish trend indicated by the daily chart, suggests that any upward retracements might be met with selling pressure. Resistance on the 1-hour chart is initially found at $4,534.50, followed by $4,552.40. Breaking and holding above these levels would be crucial for any bullish reversal narrative to gain traction. However, given the prevailing daily trend indicators, such a move appears challenging in the short term without a significant shift in market sentiment or a major geopolitical de-escalation that simultaneously weakens the dollar.
The daily chart provides a starker picture. The primary resistance level to watch is $4,497.62. A decisive move above this point, sustained by increasing volume and positive momentum indicators, would be the first sign that the bears might be losing their grip. However, the path higher is fraught with obstacles. The next significant resistance is much further up at $4,617.02, a level that seems distant given the current market conditions. On the downside, the daily support levels are $4,304.96, $4,231.70, and $4,112.30. The distance between the current price and these support levels indicates substantial room for decline should the bearish trend reassert itself with full force. It's this significant gap between immediate resistance and the entrenched daily downtrend that defines the risk for gold bulls right now.
The Role of Inflation and Central Bank Policy
The persistent narrative around inflation continues to be a double-edged sword for gold. On one hand, rising energy prices and supply chain disruptions suggest that inflationary pressures are not abating quickly, which typically supports gold as an inflation hedge. The recent surge in Brent and WTI crude prices is a prime example of this dynamic. However, this same inflation data is what drives central banks, particularly the US Federal Reserve, to maintain a hawkish stance or at least signal a reluctance to cut interest rates prematurely. The market is constantly trying to price in the Fed's next move. If inflation remains stubbornly high, the expectation of higher-for-longer interest rates will likely continue to favor the US Dollar over gold. We need to watch upcoming economic data releases very closely. For instance, the upcoming USD data on personal consumption expenditures (PCE), a key inflation gauge for the Fed, will be critical. While the forecast for PCE is currently -1.3% (following a previous 6.156%), any deviation from this could significantly impact market sentiment and, consequently, gold prices.
The divergence in monetary policy expectations between major central banks is also playing a crucial role. While the US Federal Reserve is signaling a cautious approach, the European Central Bank (ECB) might be closer to considering rate cuts, especially if economic data from the Eurozone continues to be weak. Recent economic calendar data showed a previous figure of 0.2 for a key EUR indicator, and the forecast is also 0.2. This stagnation could embolden the ECB to ease policy sooner rather than later, potentially weakening the Euro against the Dollar. A stronger dollar, as we've seen, is generally bearish for gold. This is a complex web where inflation data in the US dictates Fed policy, which impacts the DXY, which in turn influences gold. It's a chain reaction where every link matters.
Examining the broader market sentiment, the sharp sell-off in US equities this past week, with the S&P 500 dropping 2% and the Nasdaq falling 2.23%, paints a clear picture of a 'risk-off' environment. This sentiment typically benefits safe-haven assets like the US Dollar and, to some extent, gold. However, the dollar has been the primary beneficiary, suggesting that investors are prioritizing currency stability over commodity appreciation in the current climate. This 'risk-off' mood is often amplified by geopolitical uncertainty. The news regarding Iran's actions in the Strait of Hormuz is a stark reminder of the fragility of global stability and its direct impact on energy markets and, by extension, inflation expectations. Such events tend to increase volatility across all asset classes, making it difficult for gold to find a clear directional bias based on safe-haven flows alone when the dollar is simultaneously strengthening.
The energy market's reaction to these geopolitical developments has been explosive. Brent crude surged 6.77% to $110.64, and WTI crude jumped 7.69% to $101.19. This significant spike in oil prices is a major contributor to the renewed inflation fears. It directly impacts transportation costs, manufacturing, and consumer spending, creating a ripple effect throughout the global economy. For gold, this could theoretically be a bullish catalyst, as higher energy costs often correlate with higher inflation, and gold is traditionally seen as an inflation hedge. However, as noted, the market's immediate reaction has been to favor the US Dollar, suggesting that the immediate threat of inflation is being overshadowed by concerns about economic slowdown and the Fed's policy response. This is a key divergence from historical patterns where soaring oil prices almost invariably led to a gold rally.
On the cryptocurrency front, Bitcoin has been testing the $70,000 mark, while Ethereum hovers around $2,004.50. The crypto market, while often considered a risk asset, has shown a somewhat independent performance lately. Bitcoin's resilience near $70,000 amidst broader market turmoil is noteworthy. While a direct correlation with gold is not always apparent, the general risk appetite that influences equities also affects cryptocurrencies. If the 'risk-off' sentiment intensifies and the dollar continues its ascent, we could see pressure bleed into the crypto space as well, potentially adding another layer of complexity to the market environment. For now, the crypto market seems to be driven by its own set of factors, including institutional inflows and regulatory news, but a sustained equity selloff could eventually drag it down, reinforcing the bearish sentiment across risk assets.
Analyzing the Week Ahead: Key Events and Levels
As we look towards the next trading week, the focus will remain squarely on geopolitical developments and key economic data releases. The situation in the Middle East will undoubtedly continue to be a primary driver of volatility. Any further escalation or de-escalation will have immediate repercussions for oil prices and, consequently, for gold and the US Dollar. From an economic data perspective, investors will be keenly watching upcoming US employment figures. While the specific dates for the next Non-Farm Payrolls (NFP) or related labor market data are not detailed in the provided calendar for the immediate next 7 days, traders will be anticipating any hints from Fed officials regarding future monetary policy. The market's sensitivity to interest rate expectations cannot be overstated. A more hawkish tone from the Fed would likely reinforce the dollar's strength and weigh on gold, while any dovish signals could provide a much-needed reprieve for the precious metal.
Technically, the $4,495.44 closing price for XAUUSD places it precariously close to the 1-hour support at $4,492.65. A break below this level on Monday would likely trigger further selling, targeting $4,468.70. The 4-hour chart, while showing a strong trend (ADX 28.83), has an RSI at 50.56, suggesting a potential for consolidation or a short-term bounce. However, the daily chart's bearish bias (ADX 30.99, RSI 36.34) remains the dominant force. For any significant bullish move to materialize, gold needs to decisively break through the immediate 1-hour resistance at $4,534.50 and, more importantly, clear the daily resistance at $4,497.62. Until then, the path of least resistance appears to be downwards, especially if the DXY continues its upward march and geopolitical tensions remain elevated.
Bearish Scenario: The Bears Tighten Their Grip
65% ProbabilityNeutral Scenario: Consolidation Around $4,495
25% ProbabilityBullish Scenario: A Glimmer of Hope
10% ProbabilityThe current technical setup for XAUUSD, particularly the divergence between shorter and longer timeframes, suggests a period of heightened volatility is likely. The bearish signals on the daily chart are strong, reinforced by a strengthening dollar and elevated geopolitical risks. However, the potential for short-term bounces or consolidation cannot be entirely dismissed, especially if geopolitical tensions ease or key support levels hold. Traders must exercise strict risk management, paying close attention to the $4,492.65 support on the 1-hour chart. A break below this level could accelerate declines, while a failure to break through immediate resistance levels around $4,534.50 could signal a continuation of the downward trend. Patience will be key; waiting for confirmation of a clear directional move, rather than anticipating it, is the prudent approach in such a complex market environment.
Frequently Asked Questions: XAUUSD Analysis
What happens if XAUUSD breaks below the $4,492.65 support level this week?
A break below $4,492.65 on the 1-hour chart would invalidate the short-term neutral stance and likely trigger further downside momentum. This could lead to XAUUSD testing the next support at $4,468.70, aligning with the broader bearish trend indicated by the daily chart.
Should I consider buying gold at current levels around $4,495.44 given the mixed technical signals?
Buying at current levels carries significant risk due to the dominant bearish trend on the daily chart. While short-term bounces are possible, confirmation is needed. A high-probability setup for buyers would require a sustained break above $4,534.50, ideally supported by a weakening DXY and easing geopolitical tensions.
Is the RSI at 36.34 on the daily chart a strong sell signal for XAUUSD?
An RSI of 36.34 on the daily chart indicates bearish momentum but is not yet in oversold territory (typically below 30). While it supports the bearish outlook, it suggests there is still room for prices to fall before a potential oversold bounce occurs. It signals caution for bulls.
How might upcoming US employment data affect XAUUSD next week, given the current geopolitical climate?
Stronger-than-expected US employment data could reinforce the Fed's hawkish stance, strengthening the US Dollar and putting further downward pressure on gold. Conversely, weaker data might prompt rate cut expectations, potentially weakening the dollar and offering support to XAUUSD, though geopolitical factors could still dominate.
Technical Outlook Summary
| Indicator | Value | Signal | Interpretation |
|---|---|---|---|
| RSI (14) - 1H | 56.67 | Neutral | Nearing overbought; watch for reversal |
| MACD - 1H | Positive Momentum | Bullish | Above signal line; short-term strength |
| Stochastic - 1H | K=63.22, D=69.29 | Bearish | %K |
| ADX - 1H | 24.26 | Bullish | Moderate trend strength |
| RSI (14) - 1D | 36.34 | Bearish | Downside momentum; room to fall |
| MACD - 1D | Negative Momentum | Bearish | Below signal line; strong downtrend |
| ADX - 1D | 30.99 | Bearish | Strong downtrend confirmed |
Key Levels for XAUUSD
Support Levels
Resistance Levels
Track markets in real-time
AI-powered analysis, technical indicators and real-time price data.
Join Our Telegram Channel
Breaking market news, AI analysis and trading signals instantly.
Join Channel