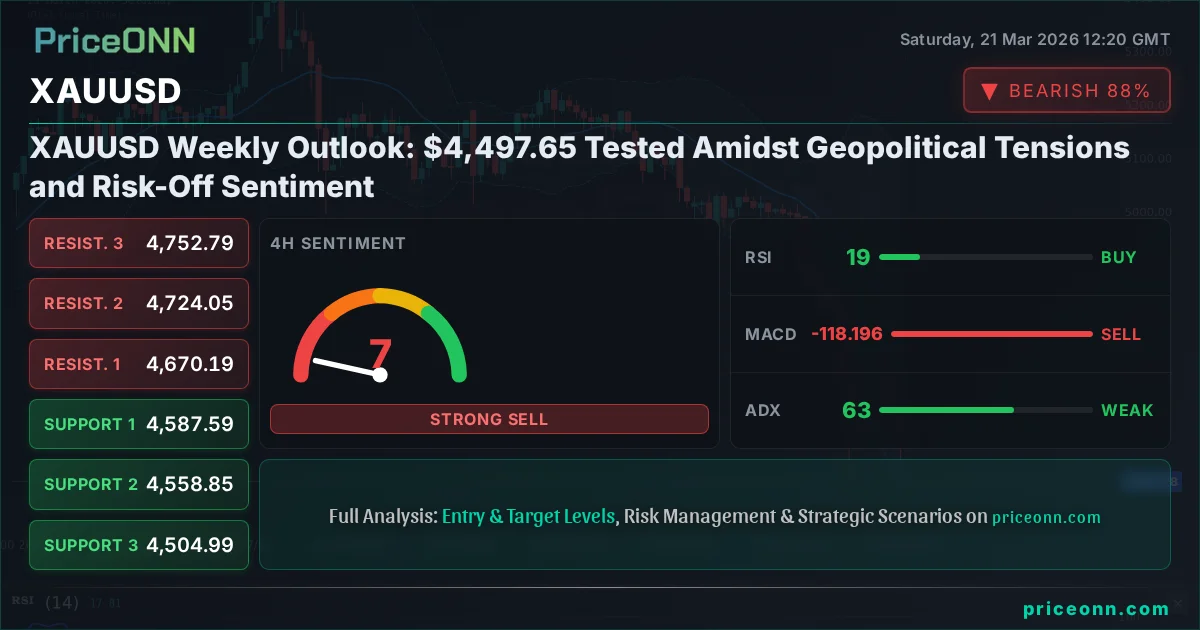
The battle lines are drawn for gold traders this week, with XAUUSD currently sitting at $4,497.65, reflecting a significant 3.28% weekly decline. This sharp downturn, occurring amidst a backdrop of escalating geopolitical tensions and a palpable shift towards risk-off sentiment across global markets, presents a critical juncture. The question on every trader's mind is whether this significant drop represents a mere pause in gold's safe-haven appeal or the beginning of a more profound correction. The current price action suggests a market grappling with conflicting forces: persistent inflation concerns and geopolitical uncertainty acting as potential tailwinds, versus a strengthening US Dollar and rising bond yields acting as headwinds. As we dissect the week's events and the technical indicators, it becomes clear that the $4,497.65 level is more than just a price point; it's a battleground where the bulls and bears are fiercely contesting control.
- With RSI at 28.95 on the 1-hour chart, gold is firmly in oversold territory, suggesting potential for a short-term bounce, but the 4-hour RSI at 19.17 and daily RSI at 29.58 indicate sustained selling pressure.
- Critical support sits at $4,458.67, tested heavily in the 1-hour timeframe; a break below this level targets $4,417.57.
- The ADX reading of 62.9 on the 4-hour chart signals a very strong downtrend, indicating that any counter-trend moves may face significant resistance.
- Fed rate expectations, currently pricing in a higher probability of fewer rate cuts due to persistent inflation, are driving the correlation with the DXY, which rose 0.48% this week to 99.39, putting pressure on gold.
Navigating the Crosscurrents: The Bull Case for Gold
Despite the steep weekly losses, a compelling argument can be made for gold's potential to rebound, rooted in both fundamental and technical factors. The primary driver for any potential recovery lies in the persistent geopolitical risks that continue to bubble beneath the surface of global markets. Escalating tensions in the Middle East, while not always directly translating into immediate gold rallies, create an underlying demand for safe-haven assets. As Reuters reported on March 21st, "Fed officials highlighted that inflation remains 'stubborn,' a sentiment echoed in market commentary suggesting that interest rate cuts might be slower than initially anticipated." This narrative, if it solidifies, could eventually cap the US Dollar's strength and, by extension, provide a much-needed reprieve for gold. Furthermore, the sheer magnitude of the recent sell-off, pushing the 1-hour RSI to 28.95 and the 4-hour RSI to an extreme 19.17, presents a classic oversold condition. Historically, such deep oversold readings on shorter timeframes have often preceded at least a temporary price stabilization or bounce. The daily chart, while showing a strong downtrend, also shows support at $4,479.29, a level that has been tested. If buyers step in here, we could see a technical bounce.
Moreover, the underlying inflationary concerns, though perhaps momentarily overshadowed by the strong dollar, have not disappeared. Central banks globally are in a delicate balancing act: fighting inflation without triggering a severe recession. This environment inherently supports gold as a hedge against currency debasement and unexpected economic shocks. The fact that oil prices, a key inflation indicator, surged 4.81% this week to $112.79 for Brent crude, underscores the persistent inflationary pressures. While the correlation between oil and gold can be complex, a sustained rise in energy prices typically fuels inflation expectations, which historically benefits gold. The recent market news highlighted this dichotomy: "Why Did Gold Tumble 8.50% This Week as Oil Prices Soared?" This headline itself points to the unusual market dynamics at play, where traditional correlations are being tested. The argument for bulls is that the market has overreacted to the dollar's strength, and the fundamental drivers for gold - geopolitical risk and inflation - remain firmly in place. A decisive break and hold above the 1-hour resistance at $4,559.54 could be the first technical signal that the bears are losing their grip, potentially targeting the $4,619.31 level.
From an institutional perspective, while short-term sentiment might be bearish, longer-term positioning could still favor gold. The recent news about institutions pouring billions into crypto despite market volatility, as reported on March 21st, also signifies a broader search for alternative assets, a category gold traditionally occupies. If traditional markets remain volatile and correlations break down, gold's role as a diversifier could see renewed interest. The 1-day ADX at 19.51, though indicating a weak trend, suggests that the current downtrend might lack conviction, opening the door for a reversal if key catalysts emerge. While the 4-hour ADX at 62.9 paints a grim picture of a strong downtrend, it’s the longer-term daily trend strength at 50% that offers a sliver of hope for a potential shift. The Stochastic indicator on the daily chart, with K at 8.5 and D at 13.09, is deeply oversold, historically a precursor to significant upside reversals. This, combined with the RSI at 29.58, presents a strong technical case for a potential bottoming process, even if it takes time to materialize.
The very fact that gold experienced an eight-day losing streak, as noted in market reports, suggests a degree of capitulation that often precedes a bottom. While the price is currently at $4,497.65, the sharp decline to $4,477.35 intraday on the 1-hour chart shows that selling pressure is intense. However, the inability to sustain moves below key support levels, such as the 1-hour support at $4,458.67, could indicate underlying resilience. The bull case hinges on the belief that geopolitical risks will continue to underpin demand for safe havens, that inflation will prove stickier than anticipated, and that the current technical oversold conditions on multiple timeframes will eventually lead to a reversal. A break above the immediate 1-hour resistance at $4,559.54, followed by a sustained push towards $4,619.31, would be the first confirmation needed for bulls to regain confidence, signaling that the recent 8.50% weekly drop might have been an overreaction.
The Bearish Tide: Why Gold Prices Are Under Pressure
On the other side of the coin, the bearish case for gold is currently painted with a broad brush of strength in the US Dollar and rising global bond yields, coupled with a clear risk-off sentiment that paradoxically favors the dollar as the ultimate safe haven. The DXY, or Dollar Index, has shown resilience, rising 0.48% this week to 99.39. This strength directly correlates with pressure on gold, as a stronger dollar makes dollar-denominated assets like gold more expensive for holders of other currencies. The market's interpretation of recent central bank rhetoric, particularly from the Federal Reserve, suggests a potential delay in interest rate cuts. As highlighted by market analysis on March 20th, "Gold Slips Below $4,500 as Central Bank Demand Battles Higher Interest Rate Expectations." This expectation of higher-for-longer interest rates increases the opportunity cost of holding non-yielding assets like gold, making interest-bearing assets more attractive. The 4-hour ADX at 62.9 is a stark indicator of a very strong downtrend, suggesting that the bears are firmly in control of the price action, and any rallies are likely to be sold into.
The technical picture on the 4-hour and daily charts strongly supports the bearish outlook. The 4-hour chart shows the price trading below the middle Bollinger Band, with the ADX at a formidable 62.9, indicating a powerful and entrenched downtrend. Similarly, the daily chart, while showing weaker trend strength at 50% (suggesting neutrality), still shows the MACD below its signal line and negative momentum, reinforcing the bearish bias. The RSI on the 4-hour chart is a deep 19.17, and on the daily chart, it's 29.58, both firmly within oversold territory, but as we know, oversold conditions can persist for extended periods in strong downtrends. The Stochastic indicator on the 4-hour is K=25.57, D=34.97, also signaling a bearish continuation. The fact that gold prices tumbled over 6% in a single day for silver (XAGUSD), and gold itself has seen an eight-day losing streak, as reported on March 21st, indicates a widespread sell-off in precious metals, driven by a flight to safety in the dollar and potentially margin calls in other assets forcing liquidation.
Furthermore, the correlation analysis reveals a concerning trend for gold. The DXY's rise to 99.39, coupled with the SP500's significant weekly drop of 1.21% to 6536.05 and Nasdaq's 1.65% fall to 23992.13, paints a picture of broad risk aversion. In such an environment, investors tend to liquidate riskier assets and seek refuge in the perceived safety of the US Dollar, rather than gold. While gold is traditionally seen as a safe haven, during periods of acute dollar strength and systemic risk aversion, the dollar itself often becomes the preferred safe haven. The news on March 21st, "Gold Tumbles Below $4,500 as Rising US Yields Dim Safe-Haven Appeal," directly addresses this dynamic. Rising bond yields increase the attractiveness of fixed-income investments, pulling capital away from non-yielding assets like gold. The immediate bearish targets are clear: if the support at $4,458.67 fails, the next level is $4,417.57, and then $4,357.80 on the 1-hour chart. The 4-hour support levels at $4,587.59 and $4,559.54 have already been breached, suggesting a clear path lower.
The fundamental drivers also lend weight to the bearish argument. While geopolitical tensions are often cited as a bullish catalyst for gold, the current market response suggests that investors are prioritizing the immediate strength of the US Dollar and the prospect of higher interest rates. The narrative around persistent inflation, while usually supportive of gold, is currently being interpreted through the lens of central bank resolve to combat it, even at the cost of higher rates. This creates a challenging environment for gold, as the opportunity cost of holding it remains elevated. The fact that oil prices, a key inflation indicator, are soaring while gold is falling highlights a potential decoupling or a market prioritizing different signals. The bearish scenario is predicated on the continuation of dollar strength, sustained or rising bond yields, and a prevailing risk-off sentiment that keeps safe-haven flows directed towards the dollar. A decisive close below the daily support at $4,479.29 would further solidify the bearish outlook, potentially paving the way for a test of the $4,308.39 level.
Technical Breakdown: Indicators and Levels Under Scrutiny
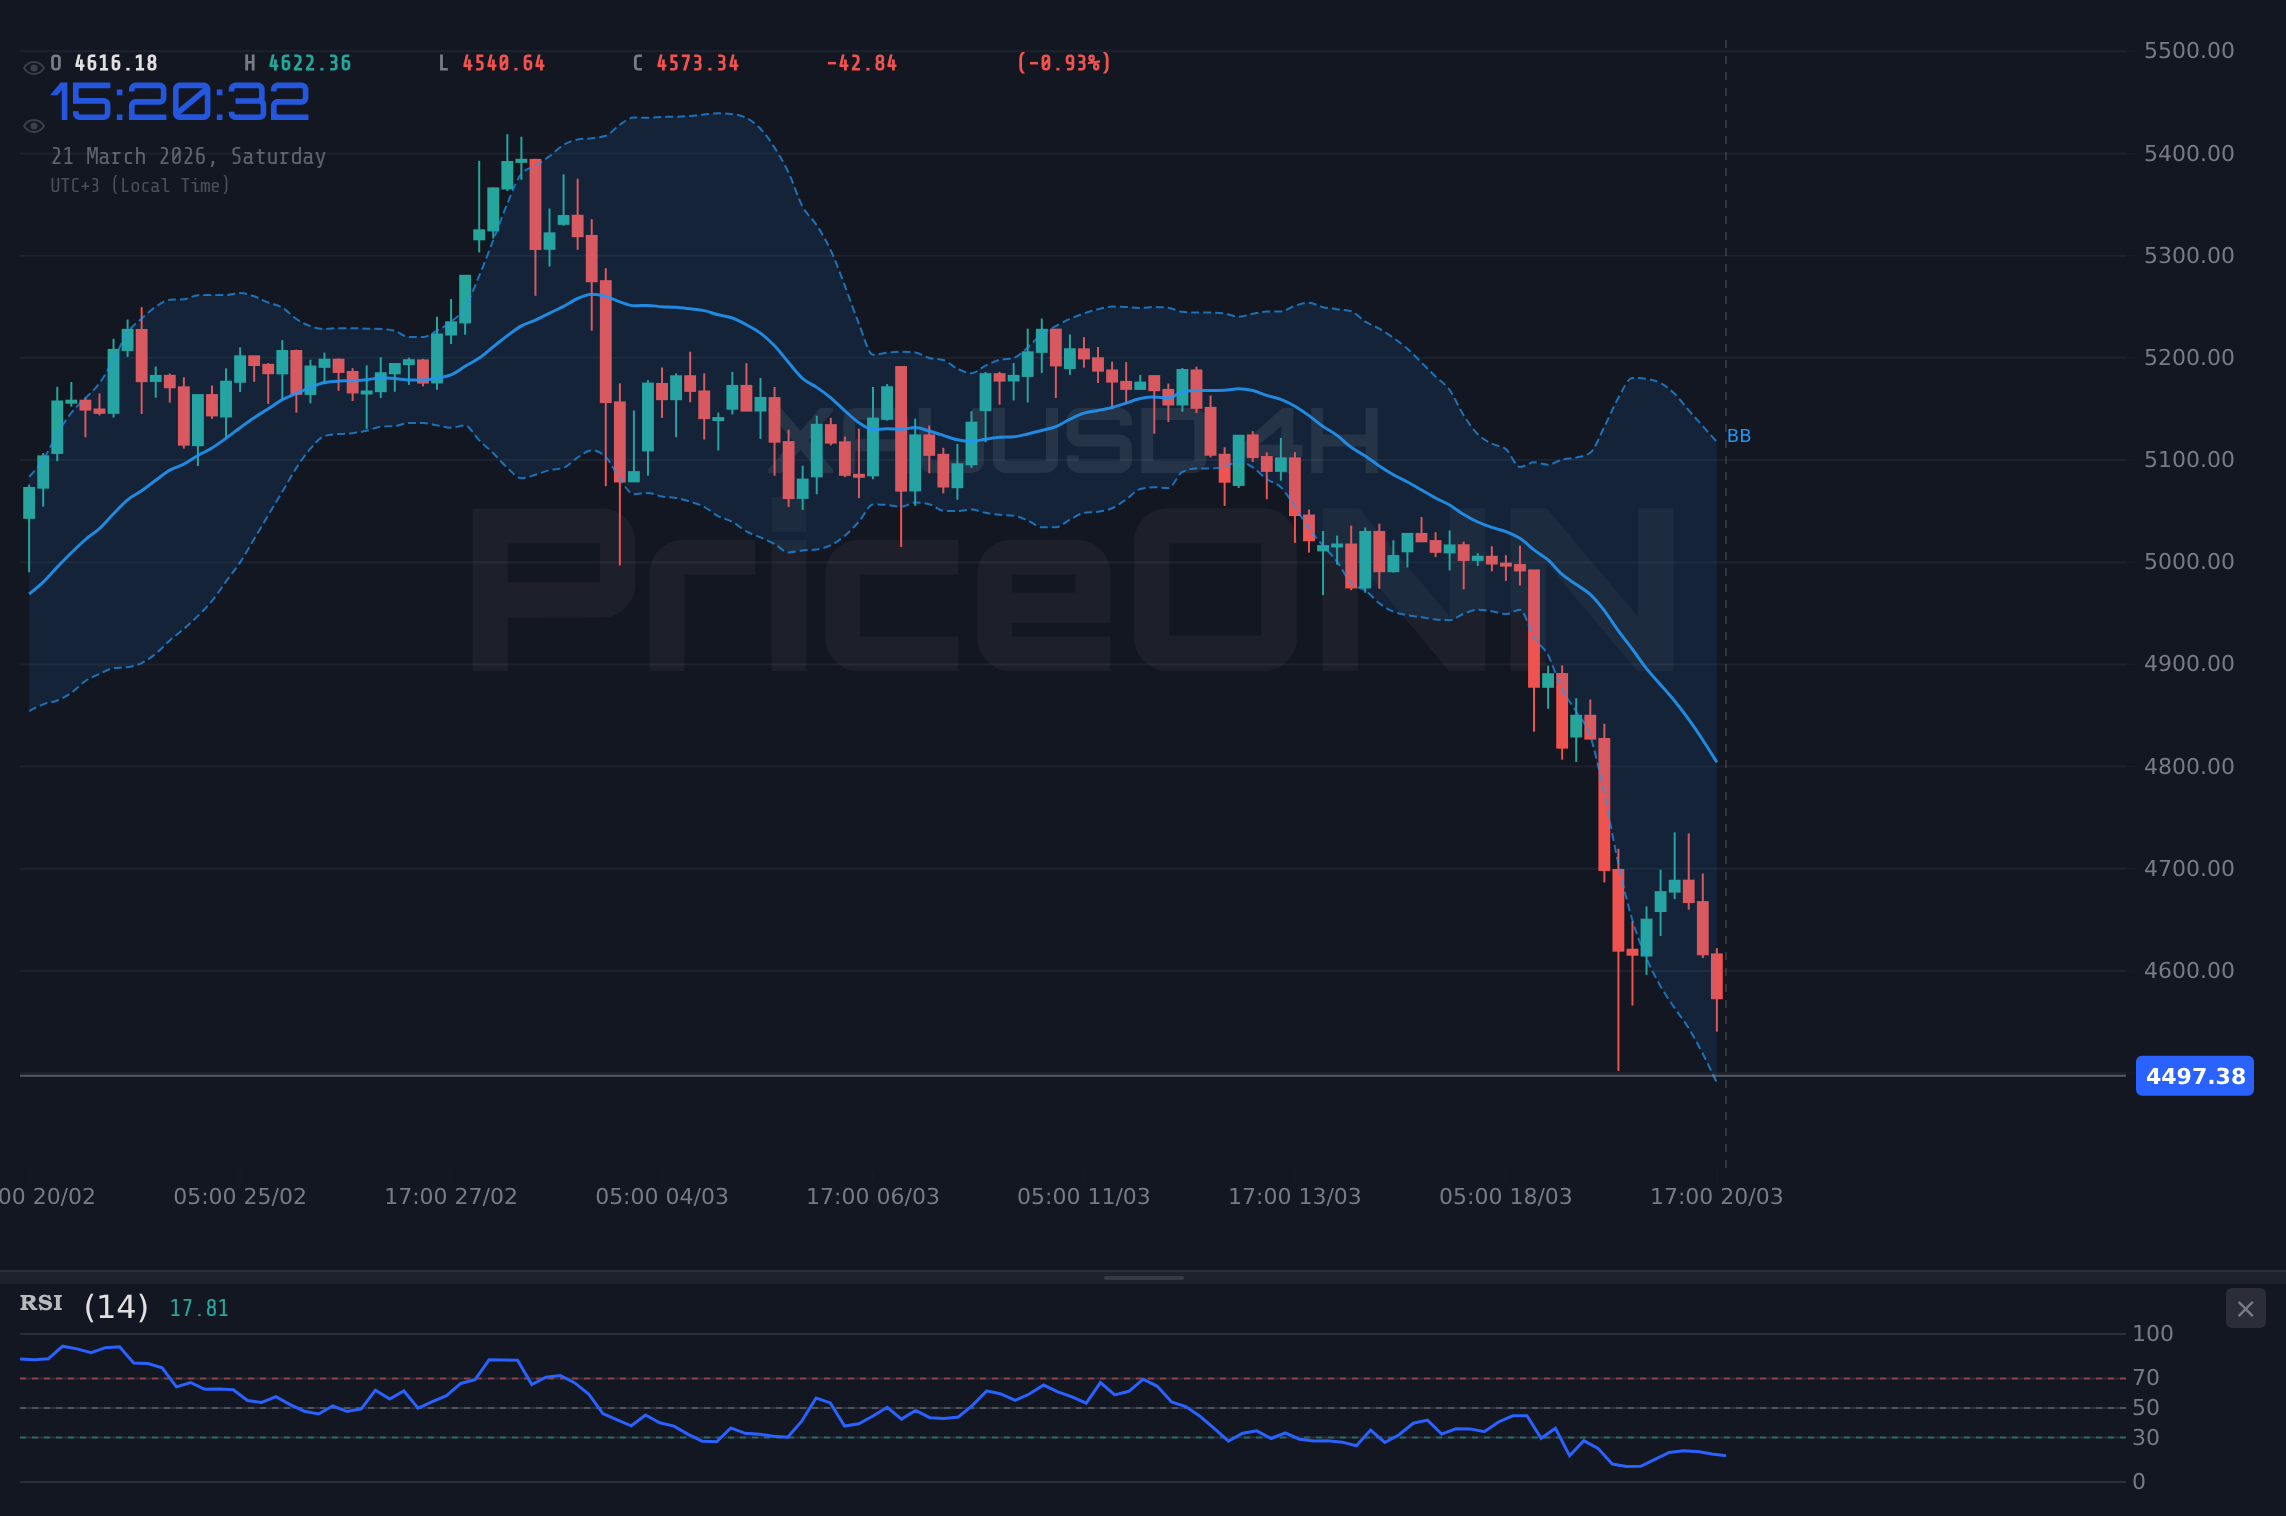
The technical landscape for XAUUSD is currently a tale of two timeframes, with shorter-term indicators flashing oversold signals while longer-term trends and momentum remain decidedly bearish. On the 1-hour chart, the RSI at 28.95 and Stochastic at K=13.36, D=13.89 are screaming 'oversold,' suggesting a potential for a short-term bounce. This is the primary argument for the bulls looking for a tactical entry. However, this is immediately contradicted by the 4-hour chart, where the RSI is an even deeper 19.17, and the daily RSI sits at 29.58. This persistent oversold condition across multiple timeframes, especially on the daily chart, indicates that while a bounce is possible, the underlying trend is overwhelmingly down. The ADX indicator offers a clearer picture of trend strength. On the 1-hour chart, it's at 31.58; on the 4-hour, it skyrockets to 62.9, signifying a very strong, established downtrend. The daily ADX at 19.51 suggests a weaker trend, but this is likely reflecting consolidation within the larger downtrend rather than a reversal signal.
The MACD indicator further supports the bearish narrative across the board. On all three timeframes (1H, 4H, 1D), the MACD histogram is negative, and the MACD line is below the signal line. This indicates bearish momentum is in play, and the selling pressure is dominant. The Bollinger Bands also tell a consistent story: on the 1-hour and 4-hour charts, the price is trading below the middle band, and on the daily chart, it's below the lower band, suggesting oversold conditions and potential for a breakdown. The fact that the 4-hour ADX is above 60 is particularly concerning for any potential bullish reversal. This level of trend strength suggests that any bounces are likely to be short-lived and met with significant selling pressure as traders attempt to short the market at better prices. The support levels on the 1-hour chart at $4,458.67 and $4,417.57 are critical immediate watchpoints. A failure to hold these could see a rapid descent towards the $4,357.80 level. Conversely, for the bulls to even consider a meaningful rally, they would need to decisively break through the 1-hour resistance at $4,559.54, followed by $4,619.31.
The interplay between different indicators and timeframes is crucial here. While the oversold Stochastic on the daily (K=8.5, D=13.09) might entice some buyers looking for a mean reversion, the overpowering trend strength indicated by the 4-hour ADX (62.9) suggests that such trades are high-risk. This is a classic scenario where short-term signals are being ignored by the dominant longer-term trend. The current market sentiment, driven by a strong dollar and geopolitical fears favoring the dollar, creates an environment where technical bounces are often quickly sold. For scalpers, looking for quick intraday moves, the 1-hour oversold indicators might offer brief opportunities, but the risk of getting caught in a sustained downtrend is substantial. Swing traders, however, would likely be looking for confirmation of a trend reversal on at least the 4-hour chart, which is currently absent. Long-term investors might see the current price of $4,497.65 as a potential accumulation zone, but only if accompanied by signs of stabilization and a shift in macro drivers.
The conflict between the soaring oil prices ($112.79 for Brent) and the falling gold price ($4,497.65) is a key technical and fundamental anomaly. Typically, rising oil prices, indicative of inflationary pressures and geopolitical risk, would correlate with higher gold prices. The fact that they are diverging suggests that the market is currently prioritizing other factors, primarily the strength of the US Dollar and rising yields, over traditional inflation hedges. This divergence warrants close observation. If oil continues to climb and gold continues to fall, it signals a significant shift in market psychology. For the bears, the immediate resistance levels to watch are $4,559.54 and $4,619.31 on the 1-hour chart. A failure to overcome these levels would reinforce the bearish sentiment and likely lead to further downside, targeting the 4-hour support levels which have already been breached.
Market Context and Correlations: A Wider Lens
To fully grasp the dynamics influencing XAUUSD at $4,497.65, we must examine its correlation with other major markets. The US Dollar Index (DXY) is a primary driver. This week, the DXY rose 0.48% to 99.39. This strengthening dollar puts direct pressure on gold, making it more expensive for holders of other currencies. The inverse relationship is typically strong: as DXY moves up, XAUUSD tends to move down, and vice versa. This week's action exemplifies this, with gold falling significantly as the dollar strengthened. The SP500, currently at 6536.05 after a 1.21% weekly decline, and the Nasdaq 100 at 23992.13, down 1.65%, reflect a broader risk-off sentiment. When major equity indices fall sharply, investors often flee to perceived safe havens. While gold is a traditional safe haven, the current environment sees the US Dollar itself acting as the primary beneficiary of this risk aversion. This suggests that while geopolitical fears are present, they are not yet translating into a flight to gold; instead, they are reinforcing the dollar's dominance.
Oil prices, specifically Brent crude at $112.79 after a 4.81% weekly surge, present a complex correlation. Historically, rising oil prices fuel inflation expectations, which should theoretically support gold prices. However, the current divergence – oil soaring while gold falls – highlights a market prioritizing immediate interest rate concerns and dollar strength over inflation hedges. This suggests that the market believes central banks, particularly the Federal Reserve, will remain hawkish to combat inflation, even if it means higher energy costs. This stance increases the opportunity cost of holding gold, thus pressuring its price despite the inflationary signal from oil. Bond yields also play a critical role. While specific yield data isn't provided, the general expectation of 'higher-for-longer' interest rates implies rising yields. Higher yields on US Treasuries make them more attractive relative to non-yielding gold, thus acting as a drag on gold prices. This confluence of a strong dollar, falling equities, and potentially rising yields creates a challenging macro environment for gold.
Examining the Forex market further illustrates these dynamics. EURUSD is trading at 1.15728, down slightly for the week, reflecting broader dollar strength. USDJPY is at 159.226, showing a strong upward trend, indicating a preference for the dollar against the yen, often seen in risk-off environments. GBPUSD at 1.33435 and AUDUSD at 0.70241 are also showing weakness, further confirming the dollar's overall strength. This consistent weakness across major currency pairs against the dollar reinforces the narrative that the current market sentiment is dollar-positive, which is inherently bearish for gold. The strength of the dollar is not just a short-term phenomenon but appears to be driven by a combination of relative interest rate differentials and safe-haven demand, both of which are headwinds for gold. The technical indicators across these pairs often mirror the dollar's strength, with many showing bearish signals against the USD.
The geopolitical news flow, while seemingly bullish for gold on the surface, is currently being filtered through a lens of dollar dominance. Reports of escalating tensions in the Gulf and concerns about potential disruptions to oil supply (driving Brent to $112.79) would typically ignite a gold rally. However, the market appears to be interpreting these risks as further justification for the Federal Reserve to maintain a hawkish stance, thereby strengthening the dollar. This complex interplay means that geopolitical events alone may not be sufficient to reverse gold's fortunes without a concurrent shift in monetary policy expectations or a clear breakdown in dollar strength. The current price of $4,497.65 reflects this complex environment, where traditional safe-haven logic is being overridden by the immediate impact of dollar strength and yield expectations.
Trade Scenarios and Strategic Outlook
Bearish Scenario: Downside Continuation
65% ProbabilityNeutral Scenario: Consolidation and Choppy Action
25% ProbabilityBullish Scenario: Oversold Bounce
10% ProbabilityKey Levels and What They Mean for Different Traders
For scalpers operating on the 1-hour timeframe, the immediate focus is on the $4,458.67 support and $4,559.54 resistance. A break below $4,458.67 could offer a quick downside target towards $4,417.57, while a move above $4,559.54 might provide a short-term scalp opportunity towards $4,619.31. However, given the high ADX reading of 62.9 on the 4-hour chart, such scalps are extremely risky and require tight stop-losses. They must be acutely aware that the dominant trend is down and that short-term bounces are often traps.
Swing traders, typically looking at 4-hour and daily charts, will find the current picture challenging. The strong downtrend indicated by the 4-hour ADX (62.9) suggests that entering long positions is ill-advised without clear signs of reversal confirmation. The oversold RSI (19.17) and Stochastic (K=25.57, D=34.97) on the 4-hour chart present a dilemma: they signal potential exhaustion, but the trend strength overrides them. A swing trader might wait for a decisive break above the 1-hour resistance at $4,559.54, followed by confirmation on the 4-hour chart (e.g., RSI moving above 30, MACD showing bullish crossover), before considering a long position targeting $4,619.31 or $4,660.41. Conversely, they might look to short rallies towards the $4,559.54 resistance level, invalidating the trade on a clear break above it, targeting the $4,417.57 support.
Long-term investors, however, might view the current price of $4,497.65 and the significant weekly drop of 8.50% as a potential opportunity to accumulate gold at a discount, especially if they believe the geopolitical risks and inflation concerns are long-term drivers. They would likely be looking at the daily chart support levels: $4,479.29, $4,308.39, and $4,114.55. A sustained move towards the lower end of these supports, combined with a stabilization in the DXY and bond yields, or a de-escalation of geopolitical tensions (though unlikely in the immediate term), could present a value opportunity. They would need to see a clear shift in the macro narrative and technical confirmation of a bottoming process, such as higher lows and higher highs on the weekly chart, before committing significant capital. The current daily ADX of 19.51, while weak, could eventually support a bottoming process if accompanied by other bullish signals.
The key levels for XAUUSD remain critical. On the downside, the immediate focus is on the 1-hour support at $4,458.67. A break here opens the door to $4,417.57. Below that, the daily support at $4,479.29 (which has already been tested) and then $4,308.39 become the next major psychological barriers. On the upside, the 1-hour resistance at $4,559.54 is the first hurdle. A sustained move above this could target $4,619.31 and then $4,660.41. However, the strong bearish signals from the 4-hour chart (ADX 62.9, RSI 19.17) suggest that overcoming these resistance levels will be a significant challenge without a fundamental shift in market sentiment or a weakening of the US Dollar.
Frequently Asked Questions: XAUUSD Analysis
What happens if XAUUSD breaks below the critical $4,458.67 support level?
A break below the 1-hour support at $4,458.67 would likely accelerate selling pressure, targeting the next significant level at $4,417.57. The strong 4-hour downtrend with an ADX of 62.9 suggests that such a breakdown could lead to further downside, potentially testing the $4,357.80 region.
Is the current RSI reading of 28.95 a buy signal for XAUUSD at $4,497.65?
While an RSI of 28.95 on the 1-hour chart indicates oversold conditions, it is not a standalone buy signal, especially with the 4-hour RSI at 19.17 and the daily RSI at 29.58. The strong downtrend indicated by the ADX (62.9 on 4H) suggests that oversold conditions can persist, and a confirmed bullish reversal signal (e.g., bullish MACD crossover on 4H, break above resistance) is needed before considering a buy.
How will the DXY's rise to 99.39 affect XAUUSD's price outlook?
The DXY's strength to 99.39 typically exerts downward pressure on XAUUSD due to the inverse relationship between the dollar and gold. This rise, driven by expectations of higher-for-longer interest rates and risk aversion, diminishes gold's appeal as a safe haven, reinforcing the bearish outlook for gold as long as the dollar remains strong.
What is the outlook for XAUUSD next week given the 8.50% weekly drop?
Next week's outlook for XAUUSD remains cautious, with the potential for further downside if key support levels like $4,458.67 fail. However, the deeply oversold daily indicators might offer some respite, potentially leading to consolidation or a short-covering bounce towards $4,559.54. A decisive catalyst, such as a shift in Fed policy expectations or a significant geopolitical de-escalation, would be needed for a sustained recovery.
Looking Ahead: What to Watch Next Week
The coming week for XAUUSD will likely be dominated by the ongoing interplay between geopolitical risks, US Dollar strength, and evolving interest rate expectations. Traders will be closely monitoring any developments in the Middle East and their potential impact on oil prices and risk sentiment. A sustained rise in oil prices, currently at $112.79 for Brent, could reignite inflation concerns, but the market's reaction will be key – will it lead to dollar strength and gold weakness, or will inflation fears eventually override dollar strength? The Federal Reserve's stance on interest rates remains paramount. Any further hints of a hawkish bias, perhaps from upcoming speeches by Fed officials, could continue to pressure gold by supporting the dollar and lifting bond yields. Conversely, any signs of softening inflation data or growing concerns about economic growth could lead to a reassessment of rate cut expectations, potentially weakening the dollar and offering relief to gold.
Technically, the levels established this week will be crucial. The $4,458.67 support on the 1-hour chart is the immediate line in the sand. A failure to hold this level could see a rapid descent towards $4,417.57 and potentially lower. On the upside, the $4,559.54 resistance on the 1-hour chart, followed by $4,619.31, represents the initial targets for any potential short-covering rally. However, the overwhelming bearish signals from the 4-hour chart, particularly the ADX at 62.9, suggest that breaking these resistance levels will be a significant challenge. For a sustained recovery, we would need to see a clear shift in the macro narrative, a weakening of the US Dollar (DXY), and confirmation of trend exhaustion on the daily charts. The deep oversold conditions on the daily RSI (29.58) and Stochastic (K=8.5, D=13.09) do offer a glimmer of hope for a potential bottoming process, but this requires patience and confirmation. Until then, the path of least resistance appears to be downwards, with the risk of further declines remaining elevated.
| Indicator | Value | Signal | Interpretation |
|---|---|---|---|
| RSI (14) | 28.95 | Oversold | Potential bounce, but trend is strong |
| MACD Histogram | - | Bearish Momentum | Selling pressure dominant |
| Stochastic (%K/%D) | 13.36 / 13.89 | Oversold | Extreme selling, potential for reversal |
| ADX | 62.9 | Very Strong Trend | Downtrend firmly in control |
| Bollinger Bands | Lower Band | Below Band | Oversold, potential breakdown risk |
Track markets in real-time
AI-powered analysis, technical indicators and real-time price data.
Join Our Telegram Channel
Breaking market news, AI analysis and trading signals instantly.
Join Channel