Bitcoin Analysis: Iran Peace Deal Sparks Hope - Is Bitcoin Ready to Bounce?
Global Tensions Ease, Risk Appetite Surges
The global stage is experiencing a surprising calm as a landmark agreement between the United States and Iran promises to reopen the vital Strait of Hormuz. This diplomatic breakthrough, emerging after months of heightened global anxieties, has sent ripples through financial markets, fostering a renewed appetite for riskier assets. While the accord appears stable for the moment, a lingering wariness persists, a sentiment amplified by past experiences with unpredictable geopolitical shifts.
This significant development has visibly shifted market sentiment from a defensive posture toward one of increased risk-taking. Assets that had languished under the weight of geopolitical pressures are now finding breathing room. Among the most immediate beneficiaries are cryptocurrencies, with Bitcoin, the sector's bellwether, standing out. Its potential to rally is further bolstered by its current position at a technically crucial support area.
Bitcoin's Technical Crossroads at $60,000
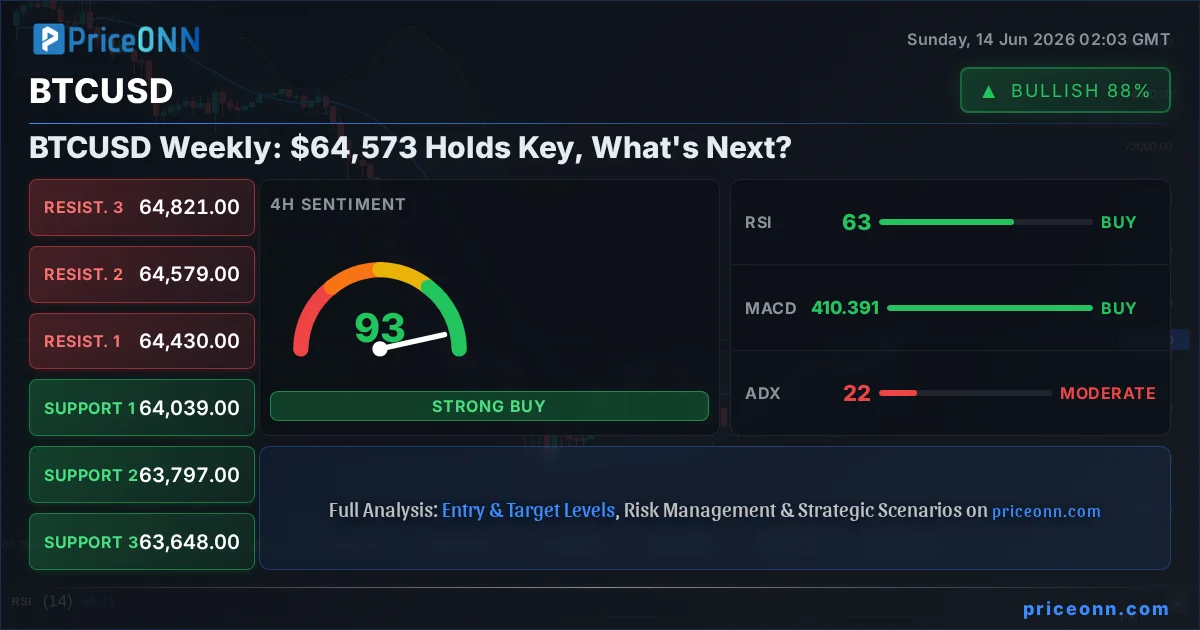
As the trading month commenced, BTC/USD tested a pivotal psychological and technical floor near the $60,000 mark. The response from this level has been far from negligible. Since hitting lows around $59,000 on June 5th, the digital currency has managed a recovery of roughly 11%. This strong bounce clearly indicates that buyers are aggressively defending this zone, stepping in to absorb selling pressure.
Simultaneously, it appears many sellers who had profited from a prolonged downturn may be liquidating positions. This asset had previously seen its value plummet by over 50% from its peak. Now, two distinct paths lie ahead for Bitcoin.
Bullish Trajectory: Breaking Key Resistance
On the optimistic side, the currency's successful defense of the $60,000 support zone sets the stage for potential upside. A decisive breach and sustained hold above the $74,000 to $75,000 corridor could signal a substantial technical turning point. This resistance area is particularly formidable, acting as a confluence of critical technical indicators.
It aligns with the 0.618 Fibonacci retracement level of the most recent significant downward price movement. Furthermore, a descending trendline, originating from the all-time high and extending through the May 2026 peaks, converges here. Adding to its significance, this zone is also approaching the 200-period Exponential Moving Average (EMA), a level that has historically acted as a strong price indicator for Bitcoin. A confirmed breakout above this dense cluster of technical resistance could pave the way for a more enduring upward trend in the near to intermediate term.
Bearish Contingency: Retreat Below $59,000
Conversely, any resurgence of uncertainty surrounding the Iran peace deal, or a deterioration in the situation at the Strait of Hormuz, could quickly dampen positive market sentiment. Should this occur, a fall below the recent low of $59,000 would represent a significant structural breakdown for Bitcoin. In such a pessimistic scenario, the next level of substantial support is anticipated to be found between $54,000 and $52,000, an area that previously fueled the last major upward price surge.
The Bigger Picture
Bitcoin, mirroring the behavior of most global financial instruments, is inextricably linked to geopolitical developments. The question now is whether this newfound diplomatic stability will be sufficient to propel the leading cryptocurrency into a sustained rally, or if underlying market anxieties will reassert themselves. The current price action around the $60,000 level represents a critical test, with both bulls and bears closely watching for directional confirmation.
Track markets in real-time
Empower your investment decisions with AI-powered analysis, technical indicators and real-time price data.
Join Our Telegram Channel
Get breaking market news, AI analysis and trading signals delivered instantly to your Telegram.
Join ChannelAs the chart shows, the US Dollar Index (DXY) has gained more than 4% from its January lows, with the move accelerating from February 2026 onwards. Today, the dollar finds itself at a technically and fundamentally critical point, one that could define the near-term direction not only of the greenback itself, but of equity indices, […] The post US Dollar Index Analysis: Dollar at a Crucial Point, What’s Next? appeared first on ActionForex.
• Rumours of an imminent peace deal in the Middle East sent the USD index tumbling. • The ECB raised interest rates but did not signal that the cycle would continue. The US dollar recorded its worst daily fall in over a month amid de-escalation in the Middle East, the ECB’s tightening of monetary policy […] The post Dollar: De-Escalation Sends Bulls Fleeing appeared first on ActionForex.
Oil prices extended their sharp decline on today as markets grew increasingly confident that a breakthrough in US-Iran negotiations could eventually restore normal energy flows through the Strait of Hormuz. Brent crude slipped back into the $86-87 region, with the break below the psychologically important $90 level reinforcing the view that traders are beginning to […] The post Oil Collapses on Hormuz Optimism, EUR/CAD Rally May Be Just Getting Started appeared first on ActionForex.
Financial markets staged a powerful relief rally after US President Donald Trump abruptly called off planned military strikes against Iran and declared that diplomatic discussions had reached the “highest level of Iranian leadership.” Trump later suggested that a peace agreement could be finalized as soon as this weekend, potentially leading to the reopening of the […] The post Gold and Silver Hold Make-or-Break Zones After Trump’s Iran Pivot, but Bullish Reversal Remains a Work in Progress...
• The Bank of Japan is ready to raise the overnight rate. • Speculators are closing out their long positions on the US dollar. The US dollar opened with a downside gap, which is unlikely to be closed any time soon. Donald Trump announced a deal with Iran and the reopening of the Strait of […] The post The Yen: Time for a Hike! appeared first on ActionForex.
The Eurozone recorded a EUR 1.0bn deficit in goods trade with the rest of the world in April, a sharp deterioration from the EUR 8.7bn surplus recorded a year earlier. While exports continued to grow, stronger import demand more than offset the gains, highlighting the impact of rising external purchases on the region’s trade position. […] The post EU and Eurozone Trade Balances Slip Into Deficit Amid Strong Import Growth appeared first on ActionForex.
Will the Fed Blink? Markets Enter High-Stakes Week of Global Rate Decisions Markets are entering a week where almost every major central bank is expected to stand still. Yet it could still become one of the most volatile policy weeks of the year. Decisions from the Federal Reserve, Bank of Japan, Reserve Bank of Australia, […] The post Will the Fed Blink? Markets Enter High-Stakes Week of Global Rate Decisions appeared first on ActionForex.
Hello traders. In this technical article we’re going to take a quick look at the Elliott Wave charts of Dow Jones Futures published in members area of the website. As our members know, we have had many high-probability trading setups recently. YM_F is one of them.Dow Jones futures made a pullback that unfolded as an […] The post Dow Jones Futures ($Ym_F) Elliott Wave: Trading Setup Explained appeared first on ActionForex.
Hello fellow traders. In this technical article we’re going to take a quick look at the Elliott Wave charts of OIL Futures CL_F published in members area of the website. As our members know, understanding how to identify incomplete sequences in Elliott Wave analysis is crucial as they are a key driver of market direction. […] The post Crude Oil (Cl_F): High-Probability Sell Setup at the Blue Box Area appeared first on ActionForex.
April’s manufacturing and wholesale reports on Monday and retail sales on Friday should support the Bank of Canada’s (and our) outlook of Canada’s growth resuming in Q2 after Q1’s contraction. Statistics Canada’s advanced estimate is a 4.6% rise in manufacturing sales, and a 0.6% increase in retail sales. Part of these reflect higher petroleum prices. […] The post April’s Manufacturing, Wholesale and Retail Data to Point to Canada’s Growth Rebound appeared first on ActionForex.
At its policy meeting on 11 June, the ECB raised its deposit rate by 25 basis points to 2.25%. This automatically raises the refinancing rate to 2.40% and the marginal lending rate to 2.65%. This decision was unanimous, based entirely on the forecasts of the Eurosystem’s economists and advocated by ECB Chief Economist Lane. The […] The post The ECB’s Interest Rate Hike Is More Than an Insurance Hike, but No Signal for a Start of a Tightening Cycle appeared first on ActionForex.
The US natural gas market (XNG/USD) is entering the summer season under the influence of two opposing forces. Domestically, the picture remains bearish. According to the EIA, working gas in underground storage stood at 2,688 billion cubic feet as of 5 June 2026, which is 151 billion cubic feet above the five-year average. At the […] The post US Natural Gas: Inventory Surplus Continues to Weigh on Prices appeared first on ActionForex.