
Brent Oil Price Falls After Recovery Failed to Clear Important $90 Barrier
 PriceONN Editorial Desk
Multi-source verification
PriceONN Editorial Desk
Multi-source verification
Oil Prices Experience Whiplash on Geopolitical Shocks
The price of Brent crude experienced a dramatic swing on Tuesday, initially climbing to its highest level in more than seven days. This advance extended Monday's impressive nearly 5% gain, fueled by a sudden shift in market sentiment. The catalyst appeared to be fresh verbal salvos from President Trump, which swiftly overshadowed diplomatic overtures from Iran and Oman aimed at reopening the crucial Strait of Hormuz.
These latest pronouncements from the White House reportedly prompted a strong reaction from Tehran. Reports suggest Iran has halted discussions with the current US administration, vowing to resume engagement only after President Trump's term concludes in 2029. Yet, seasoned market observers note that participants have grown adept at navigating the daily deluge of often contradictory geopolitical news, effectively utilizing what's been dubbed the "Trump indicator" to their advantage.
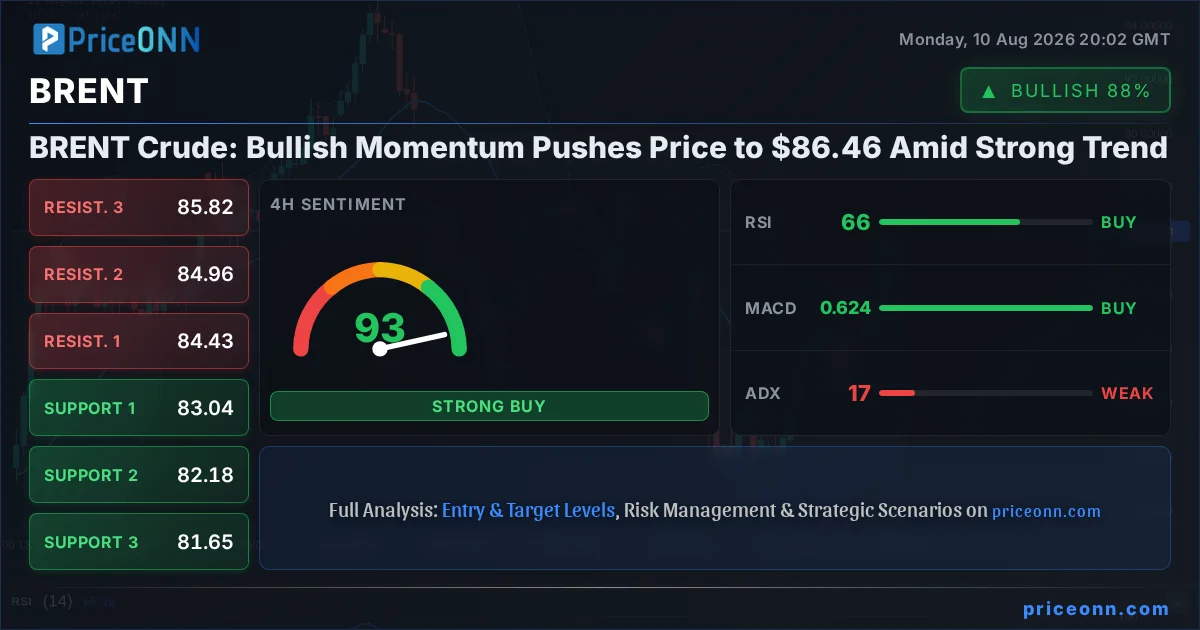
Despite the initial upward momentum, the daily chart presented a mixed technical picture. While key moving averages were aligning in a predominantly bullish configuration, the 14-day momentum indicator remained mired in negative territory. This divergence offered a cautionary note, even as the price action itself seemed to defy it, momentarily cracking the significant psychological level of $90. This level also coincided with the 50% Fibonacci retracement of the move from $101.97 down to $78.10.
However, the recovery's momentum faltered rapidly. A swift reversal followed the push above $90, signaling that the rally might be losing steam. By mid-European and early US trading on Tuesday, the commodity had shed over $3 from its highs. This renewed weakness saw the price decisively breach a critical support level at $87.22, a confluence of the broken 38.2% Fibonacci retracement and the 20-day moving average.
A firm break below $87.22 now opens the door for a more substantial pullback. Such a move would heighten the risk of a complete reversal of the recent recovery leg, particularly if President Trump's rhetoric softens or shifts unexpectedly. Conversely, if the pullback remains contained, ideally holding above the $87.22 mark, or finds solid footing near the $85.00 zone – just above a bullish 10 and 55-day moving average cross – hopes for a renewed assault on the $90 resistance could persist. Upside targets would then be eyed at $92.85 and $93.28, representing the daily cloud top, a 61.8% Fibonacci level, and the 100-day moving average.
Reading Between the Lines
The recent volatility in Brent crude underscores the potent influence of geopolitical developments on energy markets. While diplomatic channels were reportedly being explored, the market's immediate reaction was to Trump's assertive rhetoric, demonstrating how quickly sentiment can pivot based on headline risk. The failure to sustain the push above $90, a level that previously acted as both a psychological and technical barrier, suggests that underlying bullish conviction may be fragile.
This price action has direct implications for energy stocks and economies heavily reliant on oil exports. Traders will be closely monitoring any further statements from the US or Iran, as well as Omani diplomatic efforts. The technical breakdown below $87.22 is a significant warning sign for bulls, potentially signaling a deeper correction. Key levels to watch are the aforementioned $87.22 and $85.00 for support, and $90, $92.85, and $93.28 for resistance. The market's ability to digest these opposing forces will determine the next directional move.
Related market connections include the US Dollar Index (DXY), which often moves inversely to commodity prices, and potentially the performance of emerging market currencies sensitive to global risk appetite. Additionally, the trajectory of inflation expectations, a key concern for central banks, is closely tied to oil price stability.
Track markets in real-time
Empower your investment decisions with AI-powered analysis, technical indicators and real-time price data.
Join Our Telegram Channel
Get breaking market news, AI analysis and trading signals delivered instantly to your Telegram.
Join Channel PriceONN News
A deal to reopen the Strait of Hormuz is not inevitable. Oil prices are rising amid growing risks of an escalation of the conflict in the Middle East. The US dollar continued to recover from losses caused by the jobs report, against a backdrop of rising geopolitical tensions in the Middle East with traders squaring […] The post Brent Is Following a Path of Demands Rather Than Commitments appeared first on ActionForex.
PriceONN News
The Consumer Price Index (CPI) rose by 0.1% month-on-month (m/m) in July – in line with expectations. On a twelve-month basis, CPI edged down to 3.4% (from 3.5% in June). Energy costs fell by 1.5% m/m, led by a 2.9% m/m decline in prices at the pump. Food prices rose 0.1% m/m – its softest […] The post US: Inflationary Pressures Remain Subdued in July appeared first on ActionForex.
PriceONN News
US inflation eased as expected in July, reinforcing case for Fed to stay on hold while it waits for clearer evidence on both prices and labor market. Headline CPI rose from -0.4% to 0.1% m/m, while annual rate slowed from 3.5% y/y to 3.4%. Core CPI increased from 0.0% to 0.2% m/m, with annual core […] The post US CPI Slows to 3.4% as Core Inflation Eases to 2.5% appeared first on ActionForex.
PriceONN News
Whatever the inflation figures may be, the precious metal will come out on top. Japan and the US don’t want to give the yen’s fate to speculators. The US dollar continues to recover from the blow dealt by the labour market statistics. A rally in Treasury bond yields is driving the rise in the USD […] The post Gold as a Sure-Fire Bet appeared first on ActionForex.
PriceONN News
Germany’s benchmark index just made history, breaking above 26,500 for the first time ever, extending a rally that has already delivered close to 10% over the past twelve months. The move came on fresh optimism around a potential resolution to the Iran conflict, though that optimism proved short-lived: President Trump’s latest demands, that Tehran compensate […] The post DAX 40: Record Highs, Real Fundamentals, One Channel Left to Test appeared first on ActionForex.
PriceONN News
Hello fellow traders. In this technical article we’re going to take a look at the Elliott Wave charts charts of Copper (HG_F) commodity published in members’ area of the website. As our members know, Copper Futures recently completed a pullback that provided a high-probability trading setup. The decline unfolded as a clear Elliott Wave Zig […] The post Copper (Hg_F) Elliott Wave: Targeting a Buy at the Blue Box appeared first on ActionForex.
PriceONN News
The NFIB’s Small Business Optimism Index rose 2.4 points to 99.8 in July, soundly beating expectations for a roughly flat reading of 97.5. Eight out of the ten index subcomponents improved during the month and two deteriorated. The largest improvement came from the net share of firms planning to increase employment (up 9 points to […] The post US: Small Business Optimism Spiked in July appeared first on ActionForex.
PriceONN News
Overnight, the RBA held its cash rate steady at 4.35%, as widely expected after June’s inflation data came in softer than forecast at 3.8% headline. Yet the accompanying statement struck a notably cautious tone, warning that trimmed mean inflation remains elevated and largely unchanged from the March quarter, with oil and related commodities still trading […] The post EUR/AUD: Two Central Banks on Hold, One Triangle About to Break appeared first on ActionForex.
PriceONN News
Gold rose to 4,400 USD per ounce on Tuesday, reaching a two-month high. Demand for the precious metal is growing rapidly, even amid heightened inflation risks and expectations of higher interest rates driven by elevated oil prices. Chinese institutional investors continue to build positions in gold as a defensive asset amid heightened volatility in other […] The post Gold Rallies: Long-Awaited Rise and Growing Safe-Haven Demand appeared first on ActionForex.
PriceONN News
RBA on hold as expected, recognising the data has broken against its hawkish narrative. Base case clearly an extended period on hold, but RBA will hike if upside risks to inflation materialise. As widely expected, the RBA Monetary Policy Board (MPB) kept the cash rate on hold at 4.35% at its August meeting. The accompanying […] The post RBA Holds at 4.35%, Narrows Risk of Hikes appeared first on ActionForex.
PriceONN News
Easing concerns over the situation in the Strait of Hormuz provided support for risk-sensitive assets. On 8 August, the Iranian side reported progress in talks with Oman over a possible new route through the strait, although the implementation of any agreement remains dependent on additional conditions. Reduced concerns over potential disruptions to energy supplies helped […] The post Ethereum Analysis: Attempted Breakout from the Sideways Structure appeared first on ActionForex.
PriceONN News
Markets Core bonds sold off yesterday with the belly of the curve slightly underperforming in the US while European curves showed more of a bear flattening. Daily changes on the US curve varied between +4.7 bps (2-yr) and +6.4 bps (7-yr). The US 30-yr yield is again within reach of the multi-annual high reached end […] The post Sunrise Market Commentary appeared first on ActionForex.