

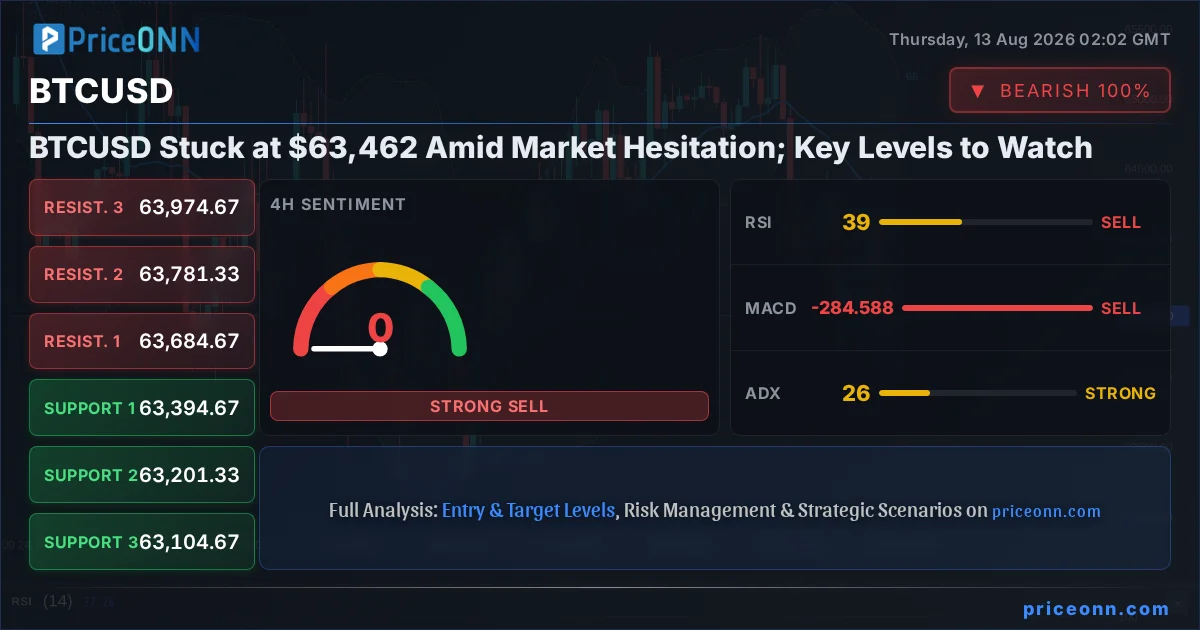
BTCUSD is currently navigating choppy waters, consolidating around the critical $63,462 level. After a recent push that saw Bitcoin flirting with higher prices, momentum appears to have stalled, reflecting a broader market hesitation driven by mixed economic signals and cautious sentiment. This indecision period is crucial for traders, as the next significant move will likely depend on whether key support levels hold or if resistance can be decisively broken. The current price action suggests a market on edge, awaiting a catalyst to break the stalemate.
- BTCUSD is consolidating around $63,462, showing a neutral trend on the 1-hour chart (ADX 15.22) but a strong downward trend on the 1-day chart (ADX 12.28).
- Critical support for BTCUSD sits at $63,104.67 (4H S3), while resistance is noted at $63,974.67 (4H R3).
- RSI(14) at 43.35 on the 1H chart signals bearish momentum, while the 1D RSI at 45.32 indicates a downward bias.
- The correlation with the DXY, currently at 100, is influencing BTCUSD as the dollar strengthens, potentially pressuring crypto assets.
Navigating the $63K Stalemate: A Technical Crossroads
The $63,462 price point for Bitcoin (BTCUSD) has become a battleground, a zone where short-term traders are testing the waters while longer-term investors assess the bigger picture. The 1-hour chart paints a picture of indecision, with a neutral trend indicated by an ADX of 15.22 and a mixed bag of signals from other indicators. However, looking at the daily timeframe, the ADX at 12.28 suggests a weak trend, which can often precede a significant directional move. This divergence across timeframes highlights the current uncertainty. The price is currently caught between the 4-hour support at $63,201.33 and resistance at $63,974.67, a range that has seen considerable back-and-forth action in recent trading sessions. For any sustainable move, either upwards or downwards, a decisive break and hold above or below these levels will be crucial.
The overall market sentiment, as reflected in broader indices, adds another layer of complexity. The S&P 500, despite a recent uptick to 6572.87, shows a bearish trend on the daily chart (ADX 47.51), suggesting underlying weakness in risk appetite. Similarly, the Nasdaq 100, trading at 29756.43, also presents a neutral daily trend. This cautious backdrop in traditional markets often spills over into the cryptocurrency space, with Bitcoin, despite its increasing institutional adoption, still susceptible to broader risk-off sentiment. The DXY (Dollar Index) currently stands at 100, and its upward movement on the 1-hour chart suggests a strengthening dollar, which historically can put pressure on riskier assets like BTCUSD.
Indicator Signals: A Mixed Bag Across Timeframes
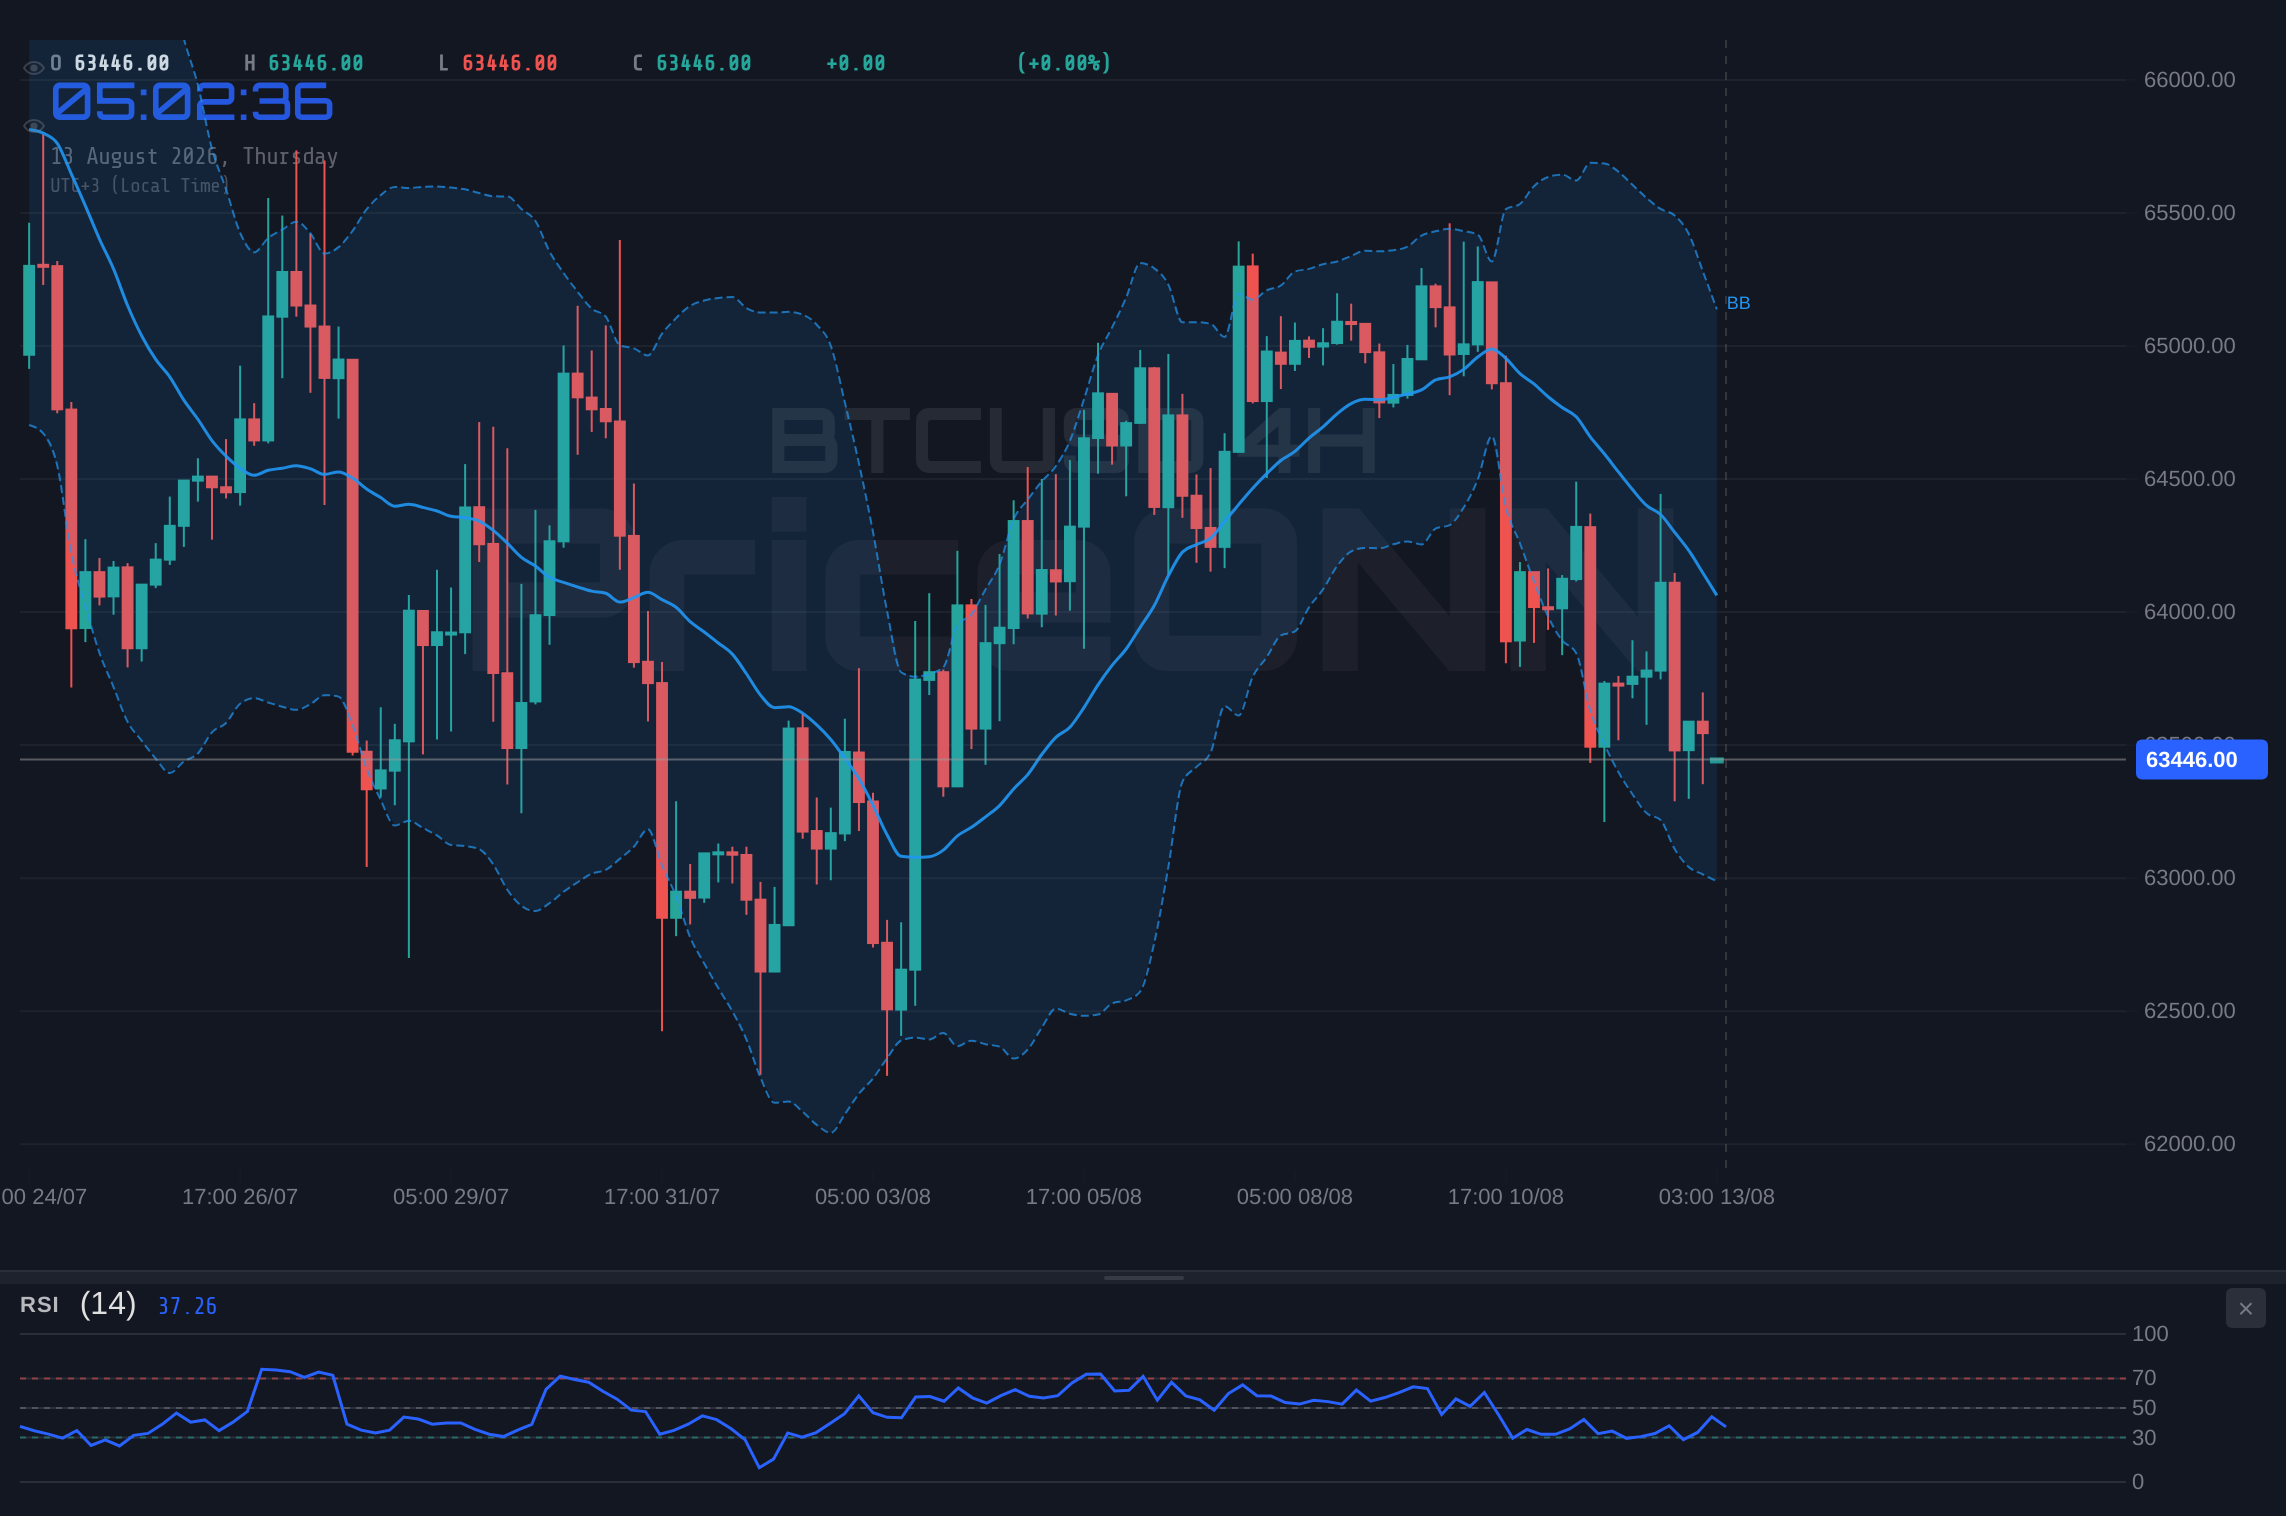
Delving into the technical indicators, BTCUSD presents a conflicting narrative depending on the timeframe analyzed. On the 1-hour chart, the Relative Strength Index (RSI) at 43.35 indicates bearish momentum, suggesting that selling pressure might be building. This is further supported by the MACD, which is below its signal line, confirming negative momentum in the short term. However, the Stochastic Oscillator on the same timeframe shows a K value of 51.01 and a D value of 30.24, presenting a potential bullish signal as %K crosses above %D, hinting at a possible short-term bounce. This immediate conflict underscores the choppy nature of the current price action.
The 4-hour timeframe offers a more bearish outlook. The RSI stands at 38.81, firmly in the neutral-to-bearish territory and trending downwards, signaling weakening buying interest. The MACD is also below its signal line, reinforcing the negative momentum. The Stochastic Oscillator here provides a clear bearish signal with K=23.62 and D=38.87, indicating a potential continuation of the downward move. The ADX at 25.67 on this timeframe confirms a strong downward trend, adding weight to the bearish short-to-medium term outlook. This suggests that any short-term upward fluctuations might be met with selling pressure.
Looking at the daily chart, the picture becomes even more complex. While the RSI at 45.32 still leans towards bearish momentum, the MACD is showing positive momentum, crossing above its signal line. This presents a divergence, where shorter-term bearish signals on lower timeframes contrast with a potentially emerging bullish undertone on the daily. The Stochastic Oscillator on the daily chart (K=38.75, D=72.62) is giving a bearish signal, indicating a potential downturn even as the MACD suggests otherwise. The ADX at 12.28 here signifies a weak trend, meaning that whatever direction Bitcoin eventually takes, it might lack strong conviction initially. This confluence of conflicting signals across different timeframes makes a strong directional bet challenging at present.
The Role of Macroeconomics and Correlation
The broader macroeconomic environment is undeniably playing a significant role in shaping BTCUSD's price action. The recent July CPI report, showing inflation at 0.1% month-on-month and 3.4% year-on-year, has been interpreted as subdued inflationary pressures. This data point, meeting expectations, has led to a weakening of the US Dollar, with the Dollar Index (DXY) showing a bearish trend on the daily chart, falling to 43.77 RSI. Historically, a weaker dollar can be a tailwind for risk assets like Bitcoin, as it reduces the purchasing power of the dollar, making dollar-denominated assets more attractive. However, the immediate 1-hour DXY chart shows a bullish trend, indicating short-term dollar strength. This immediate conflict means that the correlation might be more nuanced, with the market weighing the implications of both the subdued inflation data and the short-term dollar strength.
Gold's recent performance, edging higher towards $4,400 an ounce, also provides a useful correlation. Gold, often seen as a safe-haven asset, has benefited from expectations that subdued inflation might prevent the Federal Reserve from aggressively tightening monetary policy. This narrative could potentially extend to Bitcoin, especially if institutional investors view it as a digital gold or an inflation hedge. However, the divergence between gold's rally and Bitcoin's current consolidation suggests that either the market is not fully pricing in this narrative for Bitcoin, or that Bitcoin's price is more sensitive to immediate technical factors and short-term shifts in risk appetite rather than just macro inflation trends.
Key Levels and Price Action Dynamics
The immediate price action for BTCUSD revolves around key support and resistance levels derived from the provided data. On the 4-hour chart, which shows a strong downward trend signal (ADX 25.67), the first support level (S1) is at $63,394.67, followed by S2 at $63,201.33, and a more significant S3 at $63,104.67. A break below these levels, particularly a decisive close below $63,104.67, would likely trigger further selling pressure, potentially targeting lower levels. This is a crucial zone for bulls to defend if they aim to prevent a steeper decline.
Conversely, resistance levels need to be overcome for any sustained bullish momentum to build. The 4-hour resistance levels are R1 at $63,684.67, R2 at $63,781.33, and R3 at $63,974.67. A break and hold above $63,974.67 would signal a potential shift in short-term sentiment and could open the door for a move towards the $64,000 mark and beyond. The daily resistance levels, starting at $64,410.33, R2 at $65,089.67, and R3 at $65,689.33, represent the next major hurdles if the price can clear the immediate overhead supply. Watching how price reacts around these levels will be key to understanding the immediate direction.
Bearish Scenario: The Downward Grind
65% ProbabilityConsolidation Phase: Range-Bound Volatility
25% ProbabilityBullish Scenario: The Breakout Attempt
10% ProbabilityThe Path Forward: What to Watch Next
The current technical setup for BTCUSD is at a critical juncture. The conflicting signals across different timeframes, coupled with a hesitant macroeconomic backdrop and a strengthening dollar on the hourly chart, suggest that the market is in a precarious balance. The daily chart's weak ADX (12.28) indicates that the prevailing trend lacks conviction, meaning that a breakout, when it occurs, could be sharp but potentially unsustainable without further confirmation. Traders should be closely monitoring the key support at $63,104.67 and resistance at $63,974.67. A confirmed break below support could signal a move towards the $61,852 region, while a decisive push above resistance might target the $65,000 area.
The upcoming economic calendar will be crucial. While the July CPI data showed subdued inflationary pressures, which could theoretically benefit risk assets, the market's reaction is complex. The DXY's short-term strength and gold's rally suggest that safe-haven demand is present, but its impact on Bitcoin remains to be seen. Investors and traders should pay close attention to any further developments in central bank policy expectations, particularly regarding interest rates. Any hints of a more hawkish stance from the Fed could quickly negate the bullish implications of subdued inflation and put downward pressure on BTCUSD.
For those looking to trade this environment, patience and risk management are paramount. The 'WATCH_ZONE' designation is appropriate here, as the market has not yet provided a clear directional signal. A daily close above the $63,974.67 resistance level would be a significant bullish development, potentially opening the door for a move towards the $65,000s. Conversely, a daily close below the $63,104.67 support would invalidate any immediate bullish hopes and could lead to a retest of lower price points. Until then, expect continued volatility within the established range, with potential for sharp, short-lived moves as liquidity is tested.
The interplay between technical patterns and fundamental drivers will dictate Bitcoin's next major move. While the daily chart shows some underlying bullish potential, the immediate bearish signals on lower timeframes and the broader economic uncertainty cannot be ignored. The market is currently in a 'wait-and-see' mode, and it would be prudent for traders to do the same, focusing on clear trade setups that emerge from decisive breaks of key levels rather than trying to anticipate the market's next move. The $63,462 level remains a pivotal point, and its resolution will set the tone for the coming trading sessions.
| Indicator | Value | Signal | Interpretation |
|---|---|---|---|
| RSI (14) | 45.32 | Bearish | Daily chart shows downward bias. |
| MACD Histogram | -98.99 | Bearish | Negative momentum on daily. |
| Stochastic | K=38.75, D=72.62 | Bearish | Daily Stochastic shows bearish cross. |
| ADX | 12.28 | Neutral | Weak trend strength on daily. |
| Bollinger Bands | Middle Band Break | Bearish | Price below middle band on daily. |
Frequently Asked Questions: BTCUSD Analysis
What happens if BTCUSD breaks below the $63,104.67 support level?
A break below $63,104.67 on the 4-hour chart would invalidate immediate bullish hopes and could trigger further selling pressure. This scenario could lead to a retest of lower price points, potentially targeting the daily support levels around $62,531.67.
Should I consider buying BTCUSD at current levels around $63,462 given the mixed signals?
Caution is advised at current levels. While some short-term indicators hint at a potential bounce, the overall daily trend and bearish signals on lower timeframes suggest risk. Waiting for a confirmed break above $63,974.67 or a clear bounce from support around $63,104.67 would offer a more defined setup.
Is the RSI at 45.32 on the daily chart a sell signal for BTCUSD right now?
An RSI of 45.32 on the daily chart indicates bearish momentum but is not yet in oversold territory. Combined with the MACD showing negative momentum, it reinforces the bearish bias on the daily timeframe, suggesting that upside potential might be limited until this reading improves.
How might the subdued July CPI data affect BTCUSD this week, given the DXY's strength?
Subdued CPI data theoretically supports risk assets like BTCUSD by easing Fed tightening fears. However, the current short-term strength in the DXY (at 100) creates a conflicting signal. If the dollar's strength persists despite low inflation, it could overshadow any positive impact on Bitcoin, leading to continued consolidation or downside pressure.
Track markets in real-time
AI-powered analysis, technical indicators and real-time price data.
Join Our Telegram Channel
Breaking market news, AI analysis and trading signals instantly.
Join Channel