

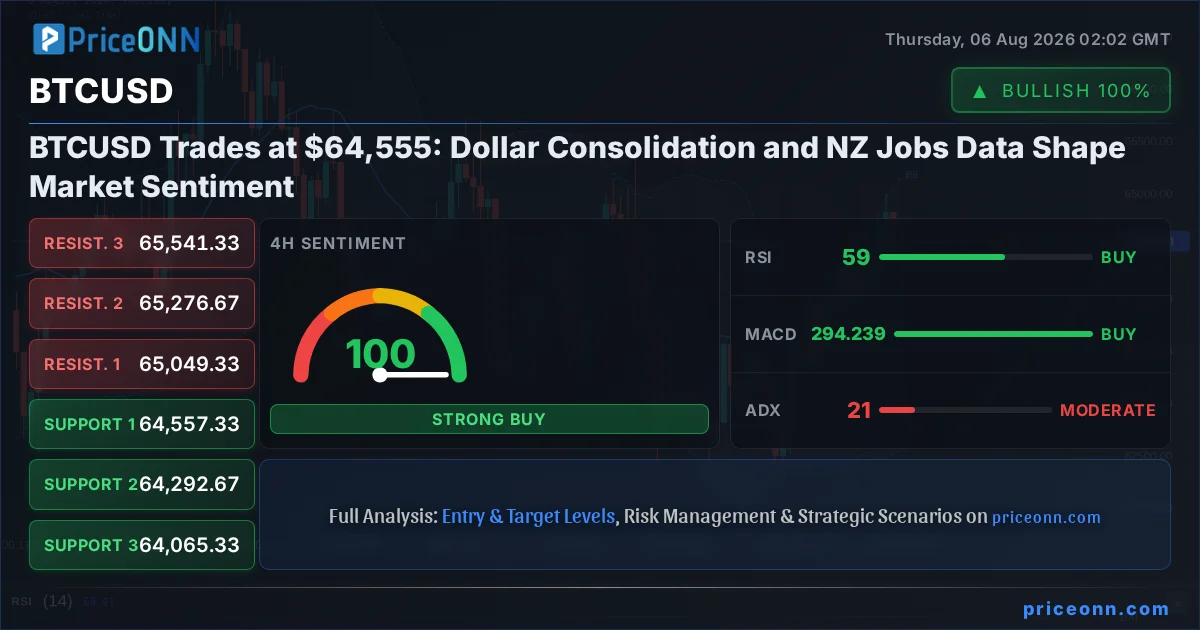
The narrative around Bitcoin often focuses on its internal dynamics, but today, the story is being written by external forces. With the US dollar entering a consolidation phase after recent volatility, and a surprising jobs report out of New Zealand, the broader market sentiment is shifting. This macro environment is crucial for understanding where BTCUSD, currently trading at $64,555.00, might be heading next. We've seen significant moves in metals and forex pairs, and it's time to see how these ripples are affecting the king of cryptocurrencies.
The immediate driver for this shift appears to be the consolidation observed in the US Dollar Index (DXY). After a period of strength, the DXY is now hovering around 99.69. This pause in the dollar's ascent is significant. Historically, a strengthening dollar often puts pressure on risk assets like Bitcoin, as it increases the cost of dollar-denominated assets for holders of other currencies and can signal a 'risk-off' sentiment. Conversely, a stable or slightly weakening dollar can provide breathing room for assets like BTCUSD, allowing them to potentially attract more capital. The fact that the DXY is showing negative daily momentum, with its 1-hour trend neutral and 4-hour trend clearly in a downtrend, suggests that the immediate pressure on risk assets might be easing.
- BTCUSD is trading at $64,555.00, with RSI at 55.36 on the 1-hour chart indicating neutral momentum with a slight upward bias.
- The US Dollar Index (DXY) is showing a 4-hour downtrend, currently at 99.69, potentially easing pressure on risk assets.
- New Zealand's Q2 employment data surprised markets with strong hiring, despite a rise in unemployment, creating nuanced market conditions.
- Key support for BTCUSD sits at $64,396.67, while resistance is forming around $64,858.67, defining the immediate trading range.
Adding another layer to the market's complexity is the surprising New Zealand jobs data. While unemployment ticked up slightly, the actual hiring figures significantly beat expectations. This suggests underlying strength in the NZ economy, which could influence the Reserve Bank of New Zealand's (RBNZ) monetary policy decisions. For forex traders, this means increased attention on the AUD/NZD pair, which has been under pressure. The strong employment report could reinforce expectations of further tightening by the RBNZ, potentially offering support to the New Zealand Dollar. While direct correlation to BTCUSD is less pronounced, a stronger global economic outlook, signaled by robust labor markets in developed economies, generally supports a risk-on environment beneficial for cryptocurrencies.
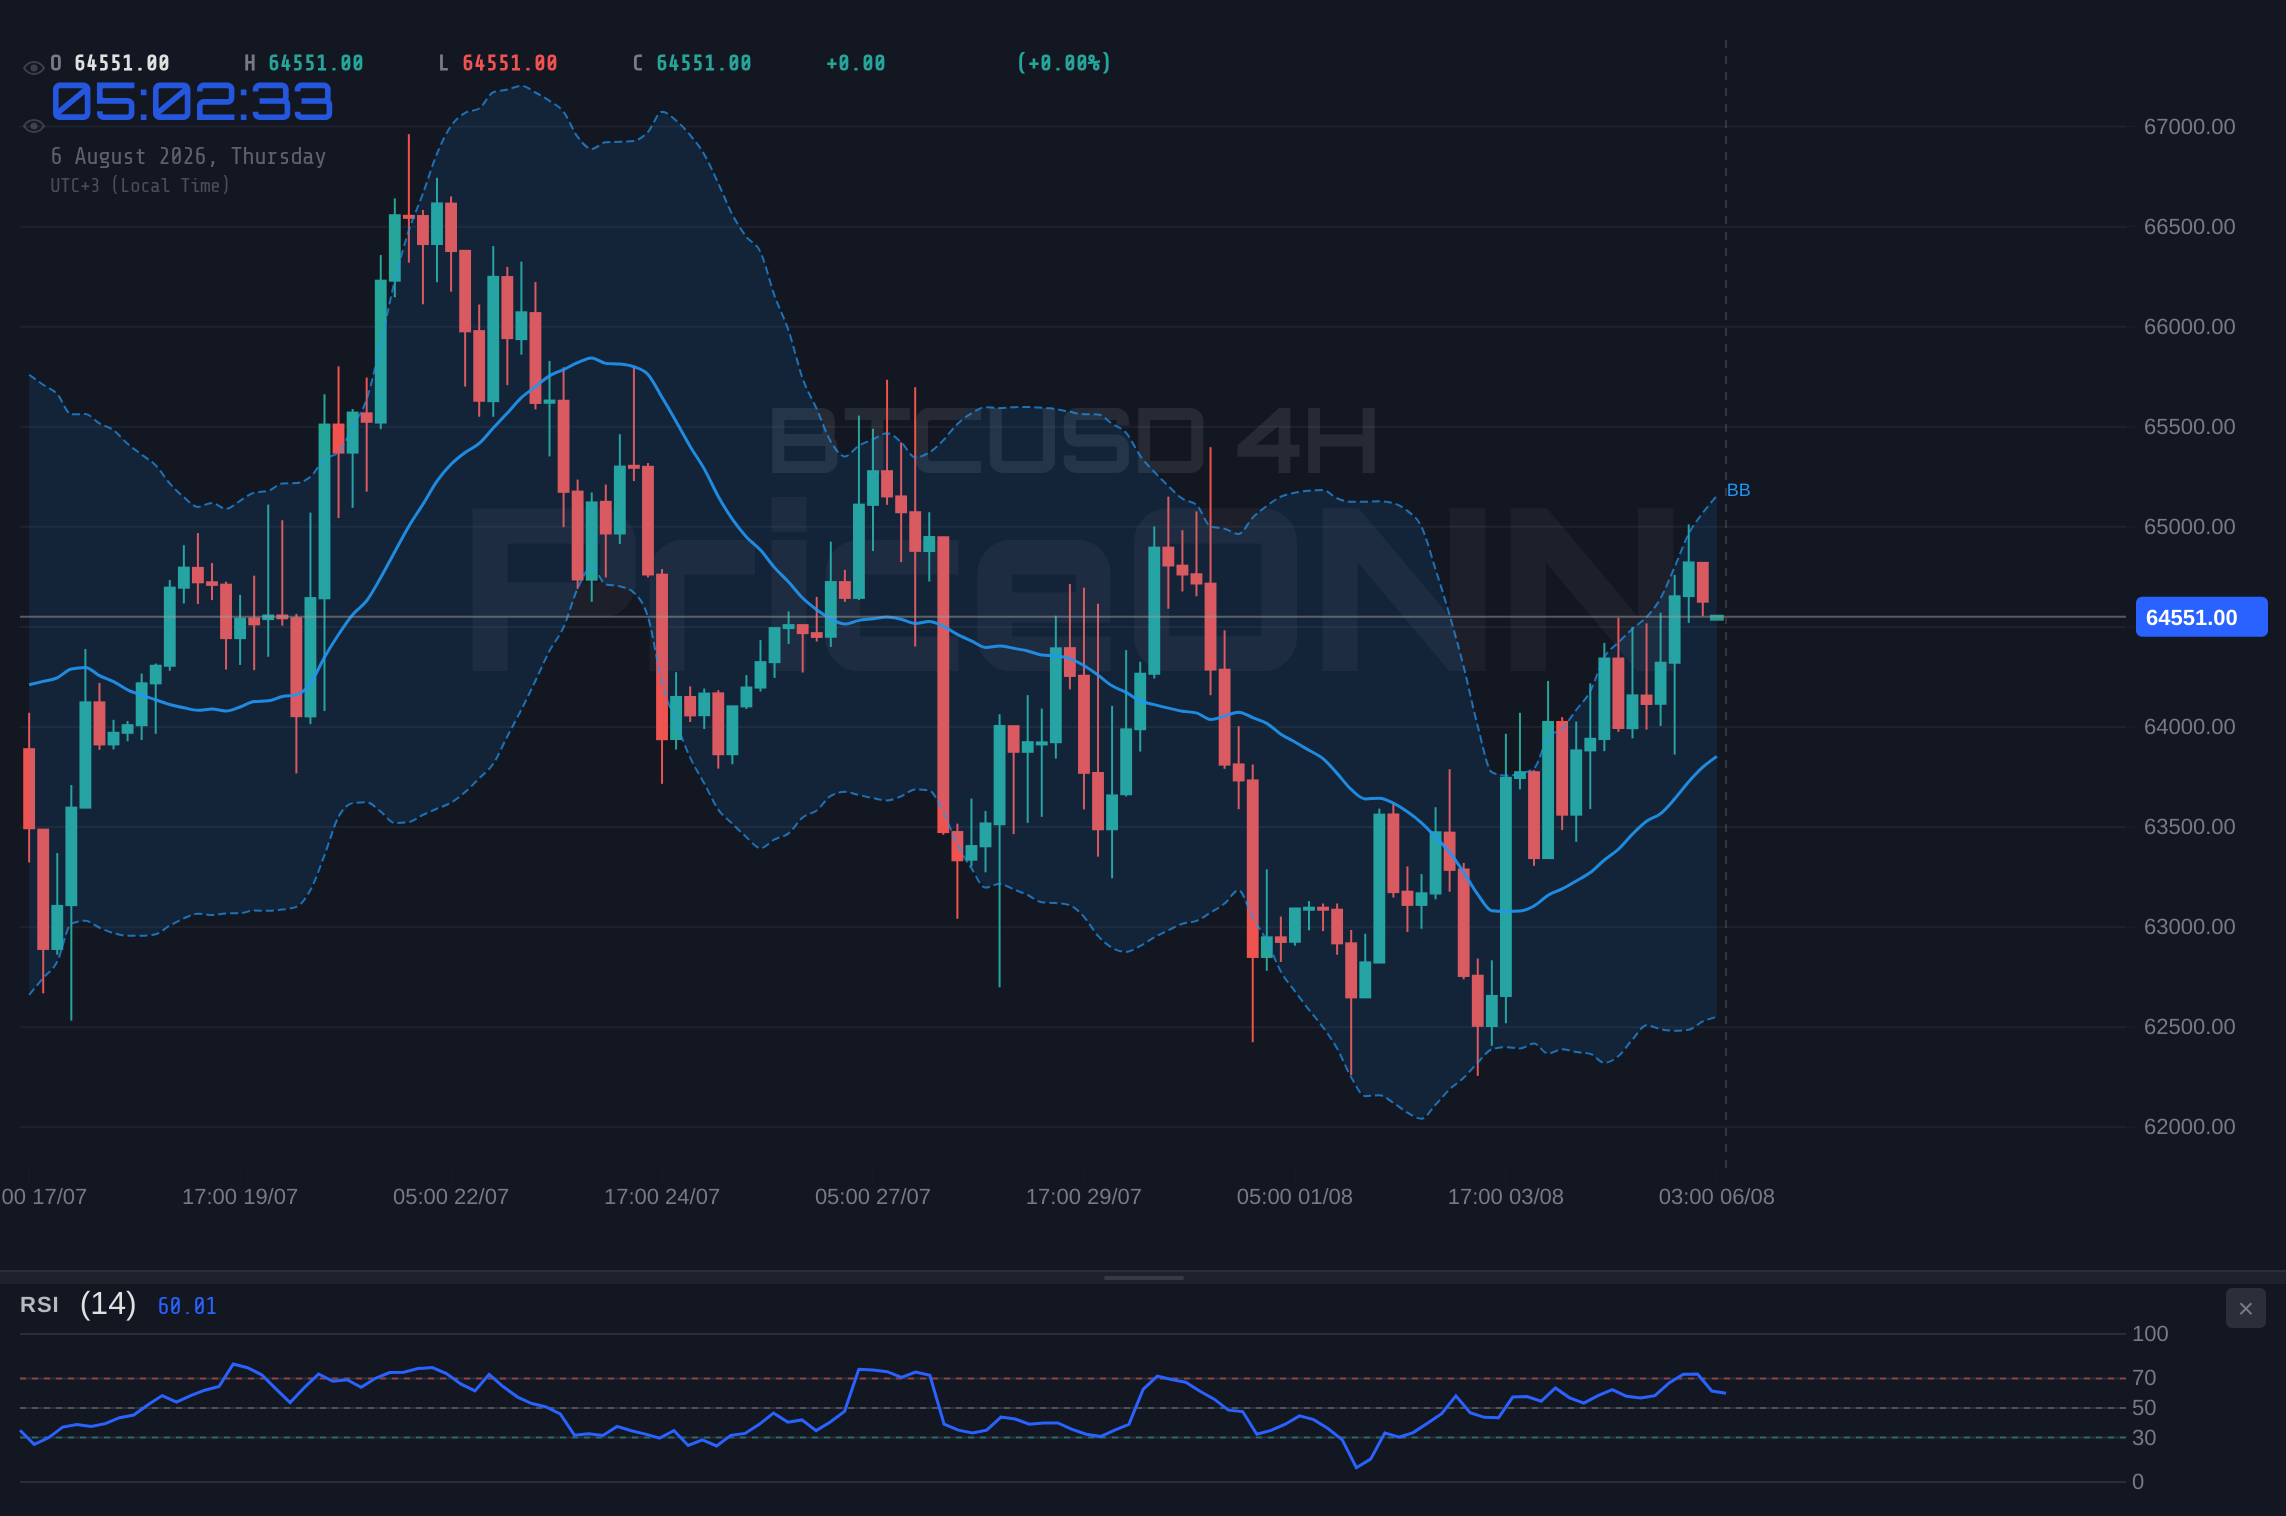
The interplay between these macro factors is creating a fascinating technical picture for BTCUSD. Currently trading at $64,555.00, Bitcoin exhibits a neutral trend on the 1-hour and 1-day charts, with a strong bullish trend on the 4-hour timeframe. This divergence suggests a market in flux, with short-term momentum building while longer-term consolidation persists. The RSI at 55.36 on the 1-hour chart confirms this neutral-to-slightly-bullish bias, indicating room for upward movement before hitting overbought territory. However, the MACD on the 1-hour chart showing negative momentum and the Stochastic %K falling below %D are caution flags, suggesting that the immediate upward push might be losing steam. This is where careful observation of key levels becomes paramount.
Navigating the Immediate BTCUSD Landscape
Looking at the immediate price action, BTCUSD is consolidating within a defined range. The 1-hour support levels are identified at $64,550.67, $64,475.33, and $64,396.67. These levels are critical for bulls to defend if they wish to maintain upward momentum. A decisive break below the $64,396.67 support, especially on increased volume, could signal a shift towards a more bearish short-term outlook, potentially triggering stop-loss orders and leading to further downside. The ADX at 24.57 on the 1-hour chart indicates a moderate upward trend, but this is not yet a strong commitment, leaving room for sharp reversals.
On the resistance side, the 1-hour levels to watch are $64,704.67, $64,783.33, and $64,858.67. A sustained push above $64,858.67, confirmed by rising volume and a positive MACD crossover, could open the door for a move towards the $65,000 psychological level and beyond. The 4-hour chart paints a more bullish picture, with a strong uptrend (100% power) and a bullish signal from Stochastic (%K above %D). The RSI at 58.89 on this timeframe suggests there's still room for upward expansion before hitting the overbought zone. This confluence of a stronger 4-hour trend with immediate short-term caution highlights the choppiness traders are currently navigating.
The daily chart presents a more balanced view, with a neutral trend (50% power) and RSI hovering around 52.65. This suggests that while short-term and medium-term trends show some bullish inclination, the longer-term picture is still undecided. The ADX at 14.13 on the daily chart is notably weak, indicating a lack of sustained directional conviction. This aligns with the current market environment where macro factors are creating cross-currents. The positive momentum on the daily MACD, however, keeps the possibility of a longer-term uptrend alive, provided key resistance levels can be decisively broken.
Correlation Analysis: DXY, Equities, and the Crypto Nexus
The relationship between BTCUSD and traditional markets, particularly the US dollar and major equity indices, remains a critical factor. The current consolidation in the DXY at 99.69, with its 4-hour downtrend and 1-hour neutral stance, is providing a backdrop that is not overtly hostile to risk assets. This is a welcome change from periods where a rapidly strengthening dollar has coincided with sharp sell-offs in Bitcoin. The fact that the DXY's 1-hour Stochastic is showing a potential buy signal (K=43.93, D=33.86) while the ADX at 37.06 suggests a strong downtrend is still in play, indicates potential for further dollar weakness, which could be a tailwind for BTCUSD.
Equity markets are also playing a role. The S&P 500 is trading at 6572.87, showing a strong 1-hour bullish trend but a neutral 4-hour and bearish 1-day trend. The Nasdaq 100, meanwhile, is showing a bearish 1-hour trend at 29378.87, but a bullish 4-hour and neutral 1-day trend. This mixed picture in equities mirrors the uncertainty in Bitcoin. A strong risk-on sentiment in stocks, particularly a breakout above key resistance levels like the S&P 500's 6570.63 or Nasdaq's 29639.67, would likely spill over positively into BTCUSD. Conversely, a sustained sell-off in equities, especially a break below S&P 500's 6514.53 support, could drag Bitcoin lower, regardless of its own technical setup.
The energy market, specifically Brent crude oil at $79.14, is also a factor to consider, particularly concerning inflation expectations. While Brent shows a bearish trend on the 1-hour and 4-hour charts, its daily trend is neutral. The recent 1.38% daily gain suggests some upward pressure, which, if sustained, could reignite inflation concerns. Higher inflation typically leads to expectations of tighter monetary policy, which can be a headwind for risk assets. However, the current weak ADX readings across timeframes for Brent suggest that the trend is not strongly committed, making its immediate impact on BTCUSD less predictable. For now, the focus remains on the dollar and equity market movements.
On-Chain Metrics and Crypto Ecosystem Health
Shifting focus to the blockchain itself, on-chain data provides crucial insights into Bitcoin's underlying health. While specific metrics like active addresses, whale movements, and exchange flows are not provided in the live data feed, their general trends are vital. A sustained increase in active addresses typically signals growing network utility and user adoption, a bullish sign. Conversely, a decline might indicate cooling interest. Whale movements - large holders accumulating or distributing - can preempt market moves. A significant increase in exchange inflows often precedes selling pressure, while outflows suggest accumulation.
The health of the broader crypto ecosystem, including DeFi and NFTs, also influences Bitcoin's trajectory. A vibrant DeFi sector, characterized by increasing Total Value Locked (TVL) and healthy staking yields, can attract capital back into crypto, benefiting Bitcoin. Similarly, strong NFT market activity, even if seemingly unrelated, can indicate overall risk appetite within the crypto space. Regulatory news, a constant factor in crypto, also plays a pivotal role. Any positive developments, such as clearer regulatory frameworks or institutional adoption announcements (like increased ETF inflows, though not provided here), can provide significant tailwinds. Negative regulatory news, conversely, can trigger sharp sell-offs, irrespective of technical indicators.
Bitcoin dominance, a measure of its market share against altcoins, is another key metric. When Bitcoin dominance rises, it often signifies a 'flight to safety' within crypto, where investors prefer the perceived stability of BTC over more volatile altcoins. A falling dominance, conversely, can indicate a 'risk-on' period within crypto, where capital flows into altcoins in search of higher returns. Currently, without specific dominance data, we infer from the general market sentiment that a neutral-to-slightly-bullish BTCUSD environment might see stable or slightly declining dominance as capital seeks higher yields in altcoins, but a strong BTCUSD rally could see dominance increase.
Trade Scenarios: Navigating Uncertainty
Given the mixed signals from macroeconomics and the nuanced technical picture, it's essential to map out potential scenarios for BTCUSD. The current price of $64,555.00 sits within a range defined by immediate support and resistance levels. Patience and a clear strategy are key.
Bearish Scenario: Consolidation Breakdown
45% ProbabilityNeutral Scenario: Range-Bound Action
35% ProbabilityBullish Scenario: Upside Breakout
20% ProbabilityThe Path Forward: What to Watch Next
The coming hours and days will be critical for BTCUSD. Traders will be closely monitoring the DXY for any clear directional move – a sustained drop could embolden buyers, while a rebound might signal renewed risk aversion. Equity market performance, particularly the S&P 500 and Nasdaq 100, will also be a key barometer of risk appetite. A decisive breakout or breakdown in these indices could provide a strong directional clue for Bitcoin.
On the crypto-specific front, keeping an eye on exchange flows and on-chain metrics, even if not directly provided here, is essential for confirming the underlying strength of any price move. Any significant accumulation or distribution patterns would add weight to the technical signals. Furthermore, news regarding regulatory developments or institutional adoption remains a wildcard that could dramatically alter the short-term outlook. For now, the $64,396.67 support level and the $64,858.67 resistance level on the 1-hour chart are the immediate battlegrounds to watch.
Frequently Asked Questions: BTCUSD Analysis
What happens if BTCUSD breaks below the $64,396.67 support level?
A break below the $64,396.67 support on the 1-hour chart would invalidate the immediate bullish bias and could trigger a move towards the daily low of $63,862.00. This scenario is heightened if risk assets like the S&P 500 also experience selling pressure.
Should I buy BTCUSD at current levels of $64,555.00 given the neutral 1-hour RSI at 55.36?
Buying at current levels carries risk due to the neutral RSI and the proximity to resistance at $64,858.67. A more prudent approach would be to wait for a confirmed break above this resistance with rising volume, or for price to retest and hold the $64,396.67 support, indicating better risk-reward.
Is the neutral 1-hour MACD signal at $64,555.00 a sell signal for BTCUSD?
The negative momentum on the 1-hour MACD suggests that immediate upward pressure is waning, but it is not a definitive sell signal on its own. Confirmation would be needed, such as a bearish crossover below the signal line or a price break below key support levels, especially if correlated with dollar strength.
How will the consolidation in the DXY at 99.69 affect BTCUSD this week?
The consolidation in the DXY, especially its 4-hour downtrend, provides a potentially supportive backdrop for BTCUSD. If the dollar continues to weaken, it could alleviate pressure on risk assets and allow Bitcoin to test higher resistance levels, potentially breaking above $64,858.67.
Track markets in real-time
AI-powered analysis, technical indicators and real-time price data.
Join Our Telegram Channel
Breaking market news, AI analysis and trading signals instantly.
Join Channel