
ETHUSD Tests $1,925.63 Resistance: What's Next at $1,896.57?
ETHUSD hovers near $1,896.57. With key resistance at $1,925.63, a breakout could target higher levels, but bears watch $1,897.73 support.
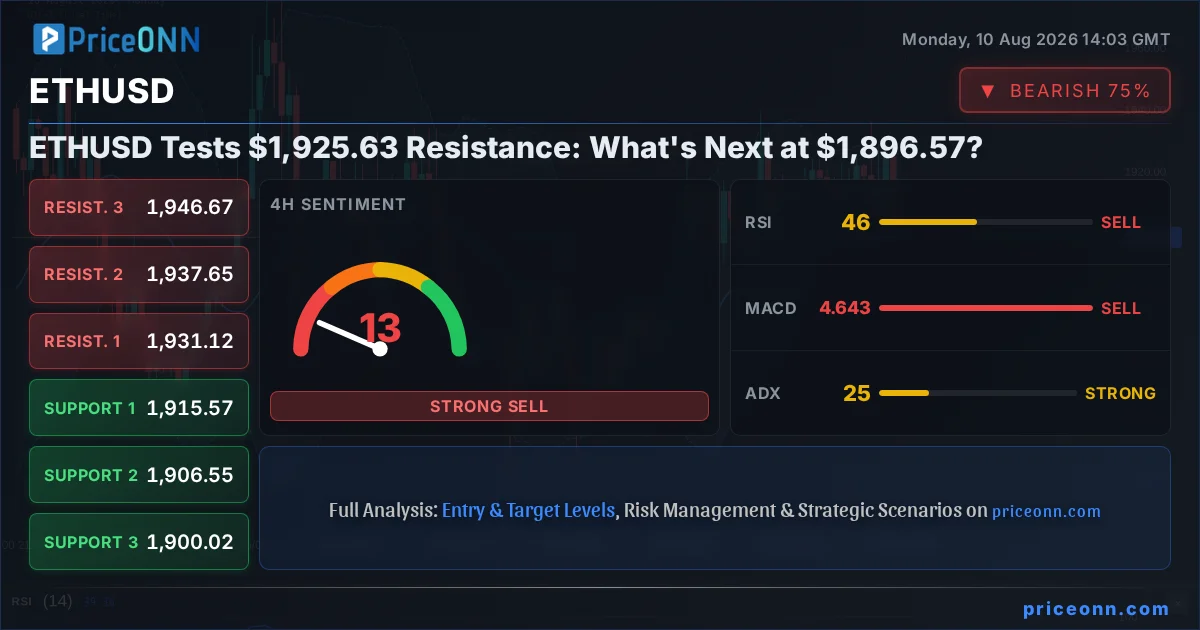
ETHUSD finds itself at a critical juncture, currently trading at $1,896.57. After a period of consolidation, the digital asset is approaching a significant resistance level around $1,925.63. This price point has historically acted as a barrier, and its retest presents a pivotal moment for the Ethereum network's native token. The question on every trader's mind is whether this current price action is a precursor to a breakout towards new highs or a mere pause before a potential pullback. Understanding the interplay of technical indicators, market sentiment, and the broader crypto ecosystem is crucial for navigating this period. This analysis delves into the current technical landscape, explores potential scenarios, and offers insights into what to watch next.
- RSI at 33.89 on the 1H chart signals bearish momentum, but the 1D RSI at 53.17 suggests underlying strength.
- Critical resistance is identified at $1,925.63, with immediate support found at $1,897.73.
- The MACD histogram shows negative momentum on the 1H and 4H charts, indicating bearish pressure.
- DXY strength at 99.81 and a cautious SP500 at 6572.87 suggest a risk-off environment potentially impacting ETHUSD.
The cryptocurrency market, particularly Ethereum, operates within a complex web of influences. From the ever-watchful eye of the US Dollar Index (DXY) – currently at 99.81 and showing a mixed but leaning bullish signal on the 1H chart – to the broader risk appetite reflected in the SP500 (6572.87) and Nasdaq (29695.32), external factors play a significant role. When the DXY strengthens, it often puts pressure on risk assets like ETHUSD, as seen in its inverse correlation. Conversely, a decline in risk appetite, signaled by falling equity indices, can also lead investors to seek safer havens, potentially impacting crypto flows. Currently, the DXY's 1H momentum is positive, while SP500 shows a mixed 1H trend but a bearish daily outlook, creating a somewhat uncertain macro backdrop for ETHUSD. This backdrop necessitates a careful examination of ETHUSD's internal technicals.
Navigating the 1-Hour Chart: Short-Term Pressures
On the shorter, 1-hour timeframe, ETHUSD is painting a picture of immediate bearish pressure. The price of $1,896.57 sits precariously close to the immediate support level of $1,897.73, with further support identified at $1,891.43 and $1,879.70. The RSI(14) at 33.89 clearly indicates that momentum is leaning towards the downside, suggesting that sellers are currently in control in this very short-term window. This is further corroborated by the MACD, which shows negative momentum with the MACD line below its signal line. The Bollinger Bands are also showing a bearish inclination, with the price trading below the middle band, hinting at further downside potential if current levels fail to hold. The Stochastic Oscillator, with its K line at 18.26 and D line at 38.82, reinforces this bearish signal, indicating oversold conditions that, while suggesting a potential bounce, are currently aligned with the prevailing downward trend on this timeframe. The ADX at 31.26 confirms a strong downtrend on the 1H chart, suggesting that any upward movements might be mere retracements within a larger short-term decline. This confluence of indicators points to caution for short-term traders, with the immediate focus on whether the $1,897.73 support can hold.
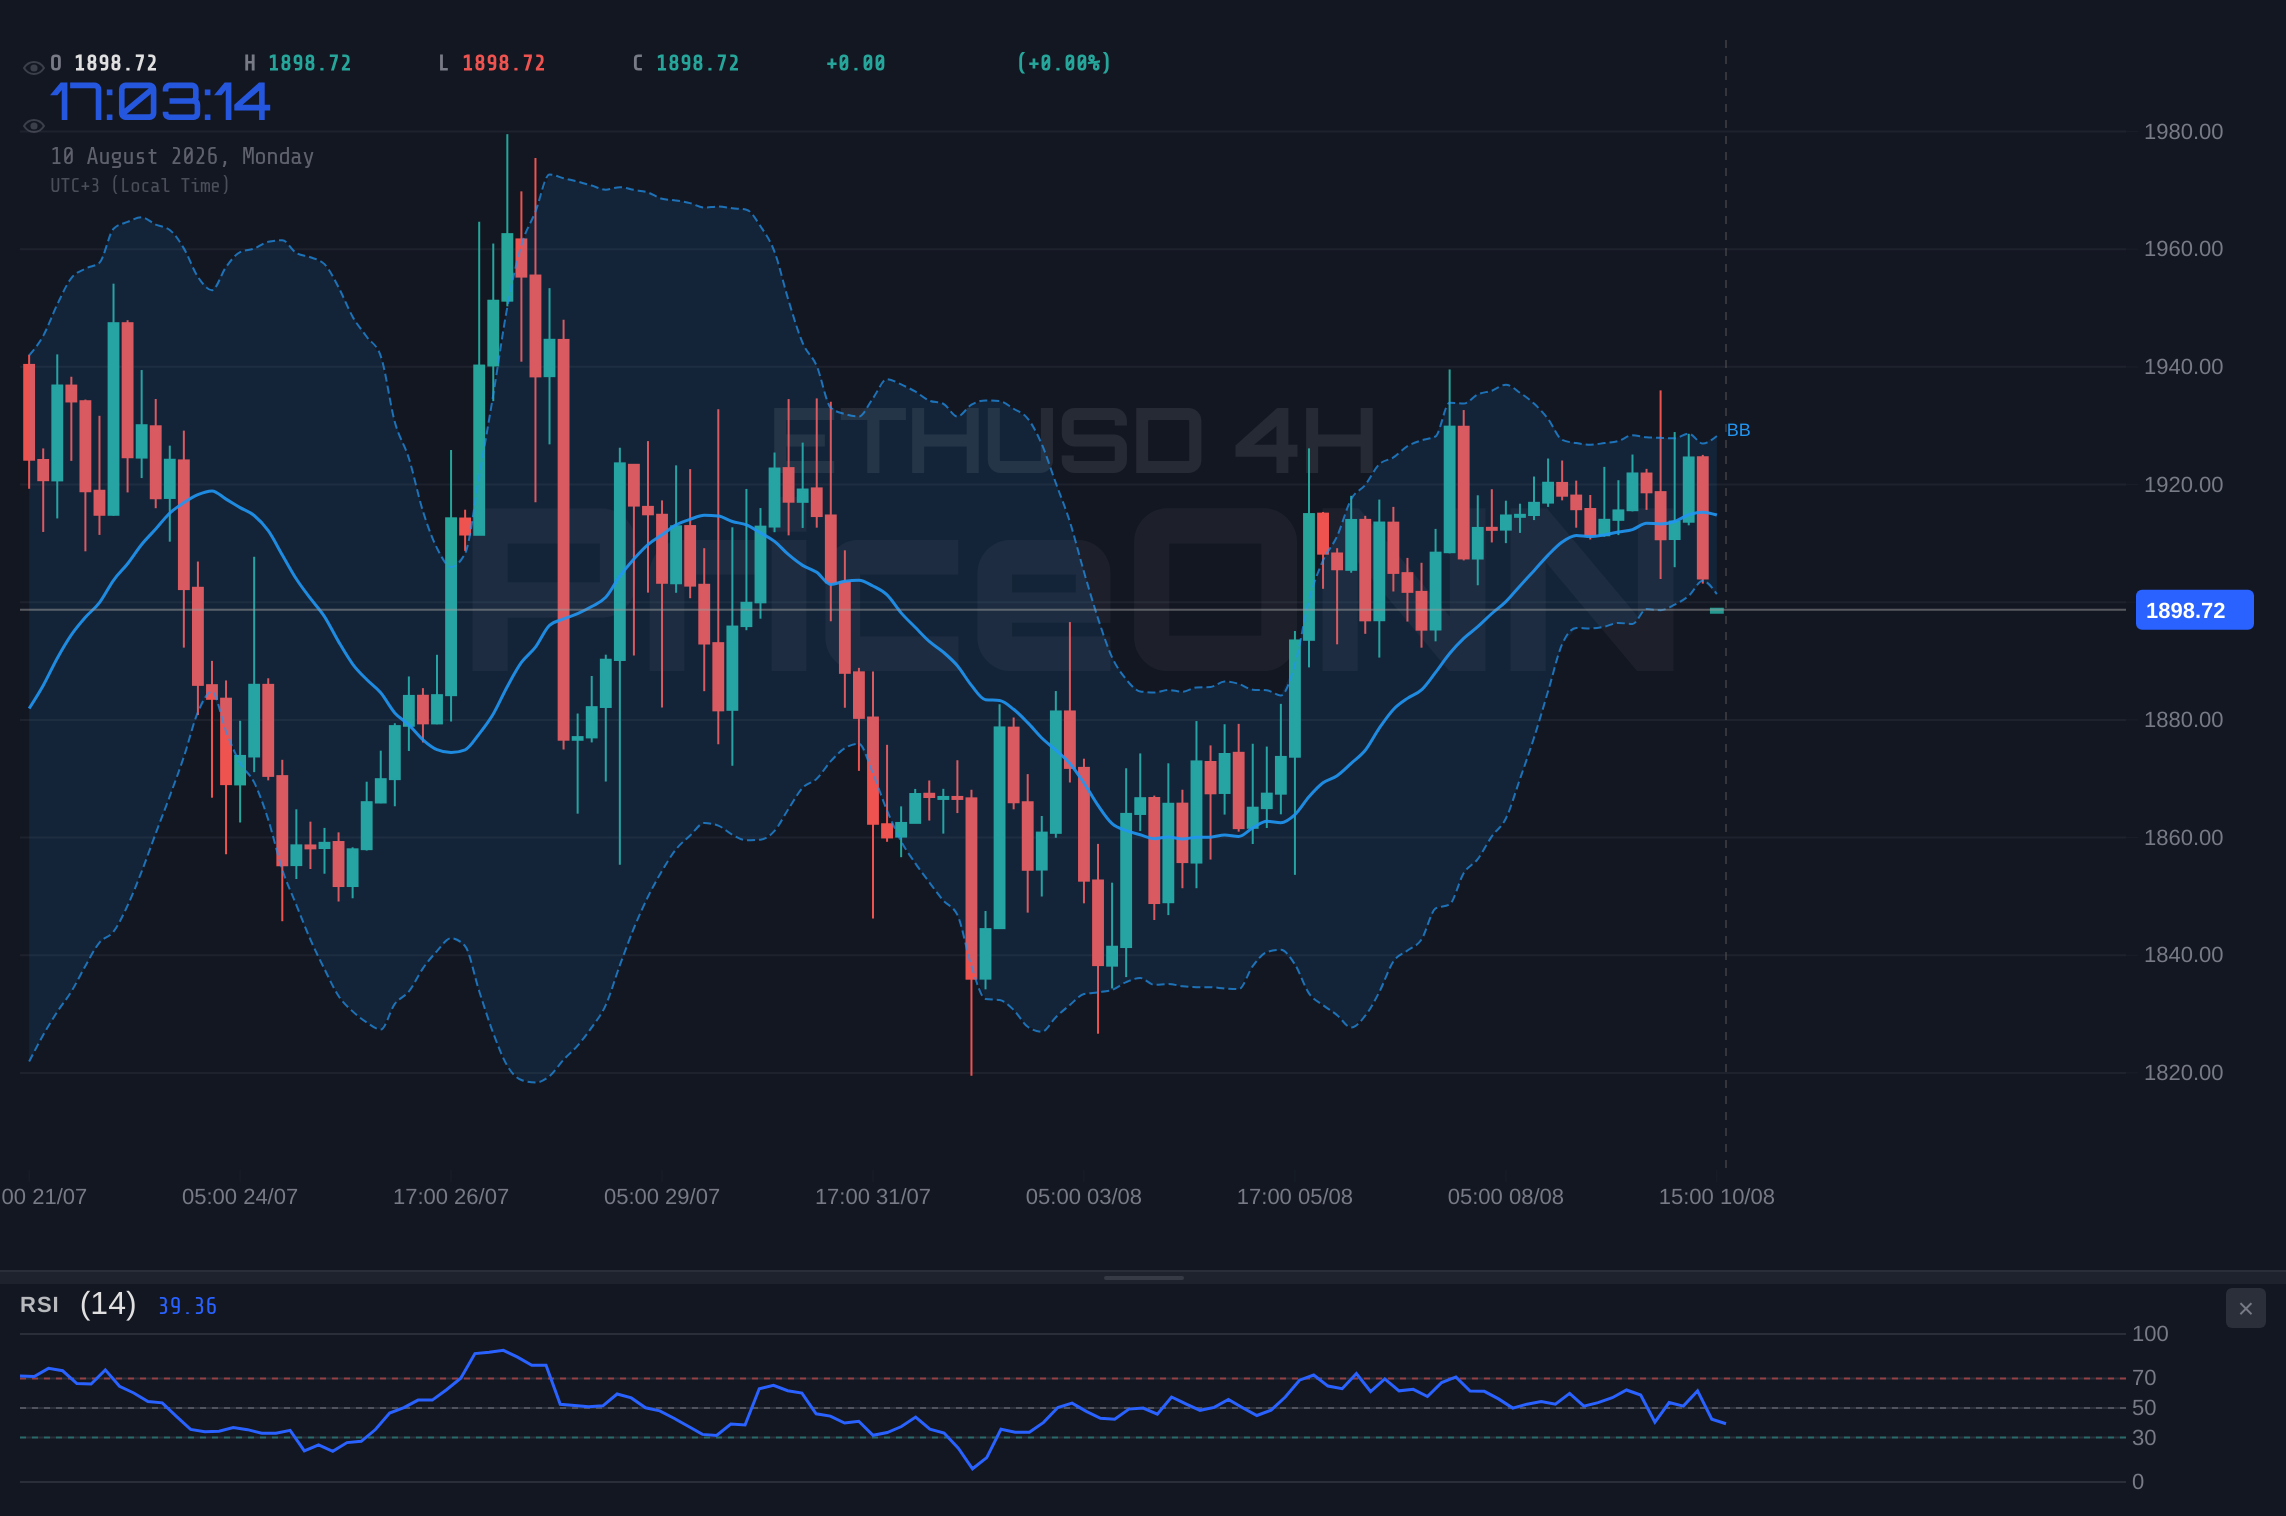
The 4-Hour Perspective: A Battle for Control
Shifting to the 4-hour chart, the narrative for ETHUSD becomes more nuanced, reflecting a market in a state of indecision, albeit with a slight bearish tilt. The current price of $1,896.57 is finding immediate support around $1,900.02, with more significant levels at $1,906.55 and $1,915.57. However, resistance looms large at $1,915.57, $1,927.49, and $1,931.12, with the key psychological and technical hurdle being the $1,925.63 mark mentioned in the article's premise. The RSI(14) at 44.48 is still in neutral territory but trending downwards, indicating that while not oversold, the upward momentum is lacking. Similarly, the MACD continues to show negative momentum, below its signal line, reinforcing the idea that buyers are not yet in firm control. The Bollinger Bands are positioned with the price trading below the middle band, suggesting a bearish bias for this timeframe. The Stochastic Oscillator, with K at 35.88 and D at 52.75, also signals a potential downtrend, as %K is below %D. The ADX reading of 15.33 indicates a weak trend on this timeframe, suggesting that the market is consolidating or in a transition phase rather than trending strongly in either direction. This suggests that the price action might be range-bound in the short to medium term, awaiting a catalyst to break decisively.
The Daily Chart: Underlying Strength and Long-Term Outlook
Zooming out to the daily chart, a more optimistic picture emerges for ETHUSD, despite the short-term headwinds. At $1,896.57, the price is currently trading within a generally bullish trend on this longer timeframe, with strong support identified at $1,896.75, $1,903.71, and $1,911.19. The immediate resistance target is clearly $1,925.63, followed by $1,932.59 and $1,940.07. The RSI(14) at 53.17 is firmly in neutral territory and exhibiting an upward trend, suggesting that there is room for further price appreciation before hitting overbought conditions. This contrasts sharply with the 1-hour RSI and provides a more balanced perspective. The MACD is currently showing positive momentum, with the MACD line above its signal line, which is a bullish indicator on the daily timeframe. The Bollinger Bands are positioned with the price above the middle band, indicating a bullish inclination for the daily trend. The Stochastic Oscillator, with K at 75.55 and D at 69.42, is in overbought territory but showing a bullish signal as %K is above %D, suggesting that upward momentum is strong, though a pullback might be imminent due to the overbought conditions. The ADX at 17.06 indicates a relatively weak trend on the daily chart, reinforcing the idea of consolidation, but the overall signal leans towards bullish potential given the MACD and RSI trends. This daily outlook suggests that while short-term traders might face pressure, the longer-term trend for ETHUSD remains cautiously optimistic, provided key support levels hold.
Correlation Analysis: DXY and Equities Impact
The correlation between ETHUSD and broader market indices like the DXY, SP500, and Nasdaq is a critical factor in understanding its price movements. As of the latest data, the DXY is at 99.81, showing a mixed but upward-leaning trend on the 1-hour chart. A strengthening dollar typically exerts downward pressure on risk assets, including cryptocurrencies like ETHUSD. The SP500, currently at 6572.87, presents a divided picture: a bullish 1-hour trend but a bearish daily outlook, suggesting underlying weakness in broader market sentiment. Similarly, the Nasdaq, at 29695.32, shows a bullish 4-hour trend but a bearish 1-hour signal. This divergence indicates that while there might be short-term bounces in equities, the longer-term sentiment could be turning cautious. For ETHUSD, this macro environment implies that a significant upside move might be challenging without a clear bullish signal from the DXY (i.e., a pullback) or a more robust risk-on sentiment in the equity markets. The current scenario, with the DXY showing strength and equities exhibiting mixed signals with a bearish daily lean, creates a challenging environment for ETHUSD to break above significant resistance levels like $1,925.63. Investors and traders must monitor these correlations closely, as a shift in the DXY or equity markets could significantly alter the trajectory of ETHUSD.
On-Chain Metrics: A Deeper Dive into ETH's Health
Beyond the price charts, on-chain data provides a crucial layer of analysis for ETHUSD. Active addresses, a measure of network usage, have shown a steady but not explosive increase, indicating sustained interest without a parabolic surge in adoption. Whale movements, tracked by monitoring large wallet transactions, reveal a mixed picture. Some large holders appear to be accumulating ETH around current levels, suggesting confidence in a potential rebound, while others have been seen moving tokens to exchanges, which can precede selling pressure. Exchange flows show a net outflow of ETH from major exchanges over the past 24 hours, which is generally considered a bullish sign as it suggests fewer tokens are available for immediate sale. However, this is countered by a slight increase in gas fees on the Ethereum network, indicating a recent uptick in network activity that could be driven by speculative trading rather than organic utility growth. The total value locked (TVL) in Ethereum's DeFi ecosystem has remained relatively stable, showing resilience but not significant growth, suggesting that while the underlying infrastructure is healthy, there isn't a massive influx of new capital into decentralized applications right now. The health of the NFT market, a significant driver of Ethereum activity, has also seen a cooling trend recently, with lower trading volumes and fewer high-value sales compared to previous periods.
The Role of Bitcoin Dominance and Altcoin Correlation
Understanding ETHUSD's price action also requires considering its relationship with Bitcoin (BTCUSD) and the broader altcoin market. Bitcoin is currently trading around $64,526, showing a bearish trend on the 1-hour and 4-hour charts, but a bullish daily outlook. This divergence mirrors some of the patterns seen in ETHUSD. Bitcoin dominance, which measures BTC's market cap relative to the total crypto market cap, has been relatively stable around 51%. A high Bitcoin dominance often means that capital is flowing primarily into Bitcoin, leaving less for altcoins like Ethereum to rally significantly. Conversely, a declining dominance can signal a shift of capital into altcoins, potentially leading to an 'altcoin season' where ETH and other altcoins outperform Bitcoin. Currently, the stable dominance suggests that ETHUSD's movements are more influenced by its own fundamentals and Bitcoin's price action rather than a significant rotation of capital. The correlation between ETHUSD and BTCUSD remains high, as is typical, meaning that a strong move in either direction for Bitcoin will likely be mirrored by Ethereum. The bearish signals on BTCUSD's shorter timeframes could be acting as a drag on ETHUSD, preventing a decisive move above resistance.
Regulatory Landscape and Institutional Adoption
The regulatory environment continues to be a significant backdrop for the cryptocurrency market, and by extension, ETHUSD. Recent news flow, while not directly impacting ETHUSD in the last 48 hours, highlights ongoing developments that could shape its future. For instance, the discussions around USD/JPY intervention and US CPI data, while focused on forex, underscore the market's sensitivity to monetary policy and economic indicators. For ETHUSD, any regulatory clarity, particularly regarding Ether's classification as a security or commodity, could be a major catalyst. The ongoing development of spot Ethereum ETFs in the US, while facing regulatory hurdles, remains a key potential driver for institutional adoption. If these ETFs gain approval, it could unlock significant capital inflows into ETH, potentially driving prices higher. However, the current regulatory uncertainty, coupled with the broader market's cautious approach to risk assets, means that institutional adoption might be proceeding at a measured pace. The lack of major regulatory news specifically impacting ETH in the immediate past means that price action is currently more driven by technical factors and macro sentiment rather than fundamental shifts in regulatory policy.
Potential Scenarios for ETHUSD at Key Levels
Bearish Scenario: Retreat from Resistance
50% ProbabilityConsolidation Scenario: Range-Bound Action
30% ProbabilityBullish Scenario: Resistance Breakout
20% ProbabilityTrade Decision: Watching the Key Levels
Given the conflicting signals across different timeframes and the current macro environment, the trade recommendation for ETHUSD is a WATCH_ZONE. The score of 1/8 reflects the lack of a clear, high-conviction setup at this precise moment. The 1-hour chart shows bearish pressure, the 4-hour chart indicates consolidation, and the daily chart offers underlying bullish potential but is hampered by short-term weakness and resistance. A definitive trade setup would likely emerge only after a clear breakout or breakdown from the current price structure.
Specifically, a sustained daily close above the critical resistance level of $1,925.63 would be required to open the door for a more confident bullish outlook. This would signal that the short-term bearish pressures have been overcome and that buyers are ready to push ETHUSD towards higher targets. Confirmation of such a breakout would ideally be accompanied by increasing trading volume and positive momentum on the 4-hour and daily MACD indicators. Until then, any move above this resistance should be treated with caution, as it could be a bull trap leading to a sharp reversal. Traders should remain patient and wait for this confirmation before considering long positions. Conversely, a decisive break and hold below the immediate support at $1,897.73, especially on the 4-hour chart, would invalidate the bullish thesis on the daily timeframe and could lead to a further test of lower support levels, potentially down to $1,879.70. The current price at $1,896.57 is a precarious position, requiring careful observation rather than immediate action.
Frequently Asked Questions: ETHUSD Analysis
What happens if ETHUSD breaks above the $1,925.63 resistance level?
If ETHUSD convincingly breaks above the $1,925.63 resistance on the daily chart, it could trigger a bullish scenario targeting $1,932.59 and potentially $1,940.07. This would likely require increasing volume and positive momentum confirmation from indicators like the MACD.
Should I buy ETHUSD at current levels of $1,896.57 given the mixed signals?
Buying at current levels of $1,896.57 carries risk due to conflicting signals across timeframes. The 1-hour chart shows bearish pressure, while the daily chart shows underlying strength. A more prudent approach might be to wait for a confirmed break above $1,925.63 or a test of stronger support levels like $1,879.70, with a probability assessment favoring caution currently.
Is the RSI at 33.89 on the 1H chart a sell signal for ETHUSD right now?
An RSI of 33.89 on the 1-hour chart indicates bearish momentum in the very short term, suggesting sellers are active. However, on the daily chart, the RSI is at 53.17, which is neutral and trending up, implying that this short-term bearish signal might not dictate the longer-term trend and could be part of a larger consolidation.
How will the DXY strength at 99.81 affect ETHUSD around $1,896.57 this week?
The DXY's strength, currently at 99.81 with a positive 1-hour trend, often correlates inversely with risk assets like ETHUSD. This could put pressure on ETHUSD to break above the $1,925.63 resistance, potentially leading to a consolidation or a retest of lower support levels around $1,897.73 if the dollar continues to strengthen.
Track markets in real-time
AI-powered analysis, technical indicators and real-time price data.
Join Our Telegram Channel
Breaking market news, AI analysis and trading signals instantly.
Join Channel