
BTCUSD Flat at $63,817: Traders Watch CPI and Gold's Rally
BTCUSD hovers around $63,817 amid anticipation for CPI data and a strong gold rally nearing $4,400. Technicals show mixed signals as traders eye key levels.
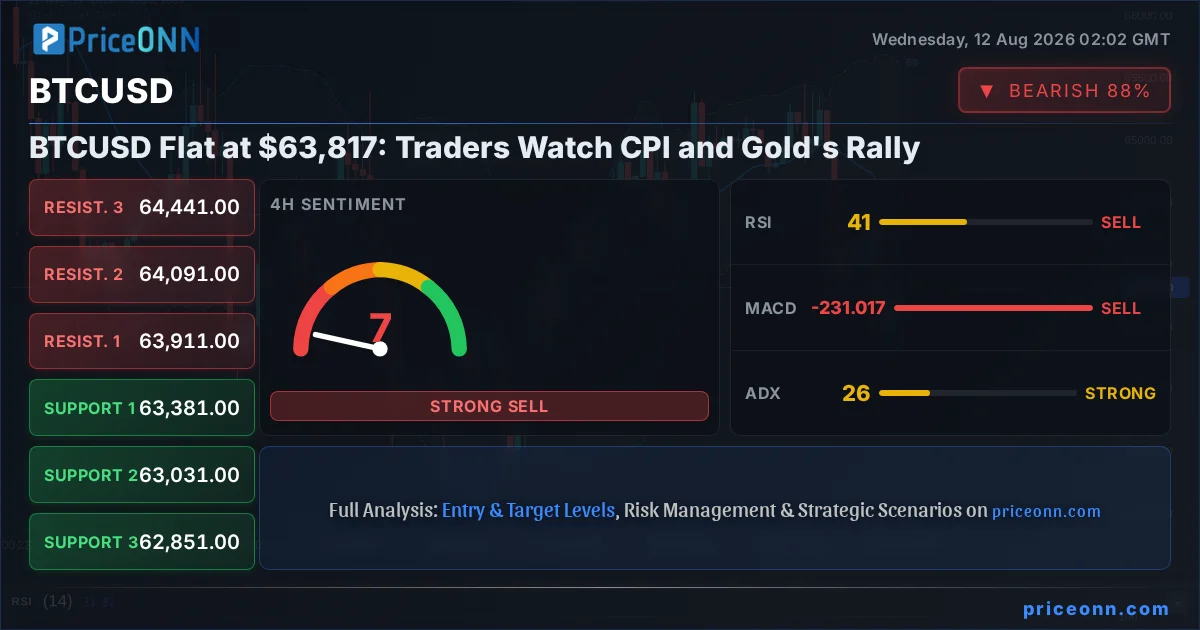
The cryptocurrency market, led by Bitcoin (BTCUSD), is currently navigating a period of consolidation around the critical $63,817 mark. This price point, a significant level for traders and investors alike, has become the focal point as market participants digest a confluence of macroeconomic data and shifting risk appetites. Gold's impressive surge towards $4,400, nearing two-month highs, underscores a broader trend of safe-haven demand, which often has correlative effects on riskier assets like Bitcoin. With the much-anticipated CPI report on the horizon, the market is poised for potential volatility, making a deep dive into the current technical and fundamental landscape of BTCUSD not just prudent, but essential.
- Bitcoin (BTCUSD) is trading flat around $63,817, consolidating after recent moves.
- Gold (XAUUSD) is rallying strongly, nearing $4,400, signaling increased safe-haven demand.
- Key BTCUSD support is observed at $63,587, with resistance at $63,804 on the 1-hour chart.
- The 1-hour RSI at 47.32 indicates bearish momentum, while the 1-hour MACD shows positive momentum.
- Traders are closely monitoring the upcoming CPI report for potential market-moving insights.
The current trading environment for Bitcoin presents a classic 'watch and wait' scenario. Hovering around $63,817, BTCUSD is exhibiting a degree of indecision. This flat price action is occurring against a backdrop of significant global economic events, most notably the impending release of the Consumer Price Index (CPI) data. Historically, CPI figures have a profound impact on market sentiment, influencing central bank policy expectations and, consequently, the appetite for risk assets. The fact that gold is simultaneously making significant gains, pushing towards $4,400, suggests that caution is the prevailing mood. This inverse correlation often sees capital flow away from riskier assets like cryptocurrencies into perceived safe havens when economic uncertainty rises. For Bitcoin, this means that while underlying demand might be present, the immediate catalyst for a decisive move is likely to come from the macro data rather than purely internal crypto market dynamics.
On the technical front, the 1-hour chart for BTCUSD reveals a delicate balance. The price is currently finding itself between immediate support at $63,587 and resistance at $63,804. This tight range suggests that neither bulls nor bears have a clear upper hand in the short term. The RSI(14) reading of 47.32 on this timeframe leans towards bearish momentum, indicating that selling pressure might be slightly outweighing buying interest in intraday trading. However, the MACD is showing positive momentum, with its histogram above the signal line, which can sometimes precede a bullish move. This conflict in signals – bearish RSI versus bullish MACD – is characteristic of a market in consolidation, where short-term traders are likely being squeezed. The ADX at 28.53 on the 1-hour chart, while indicating a strong trend, doesn't specify direction, further complicating the immediate outlook. This necessitates a closer look at higher timeframes to gauge the broader trend.
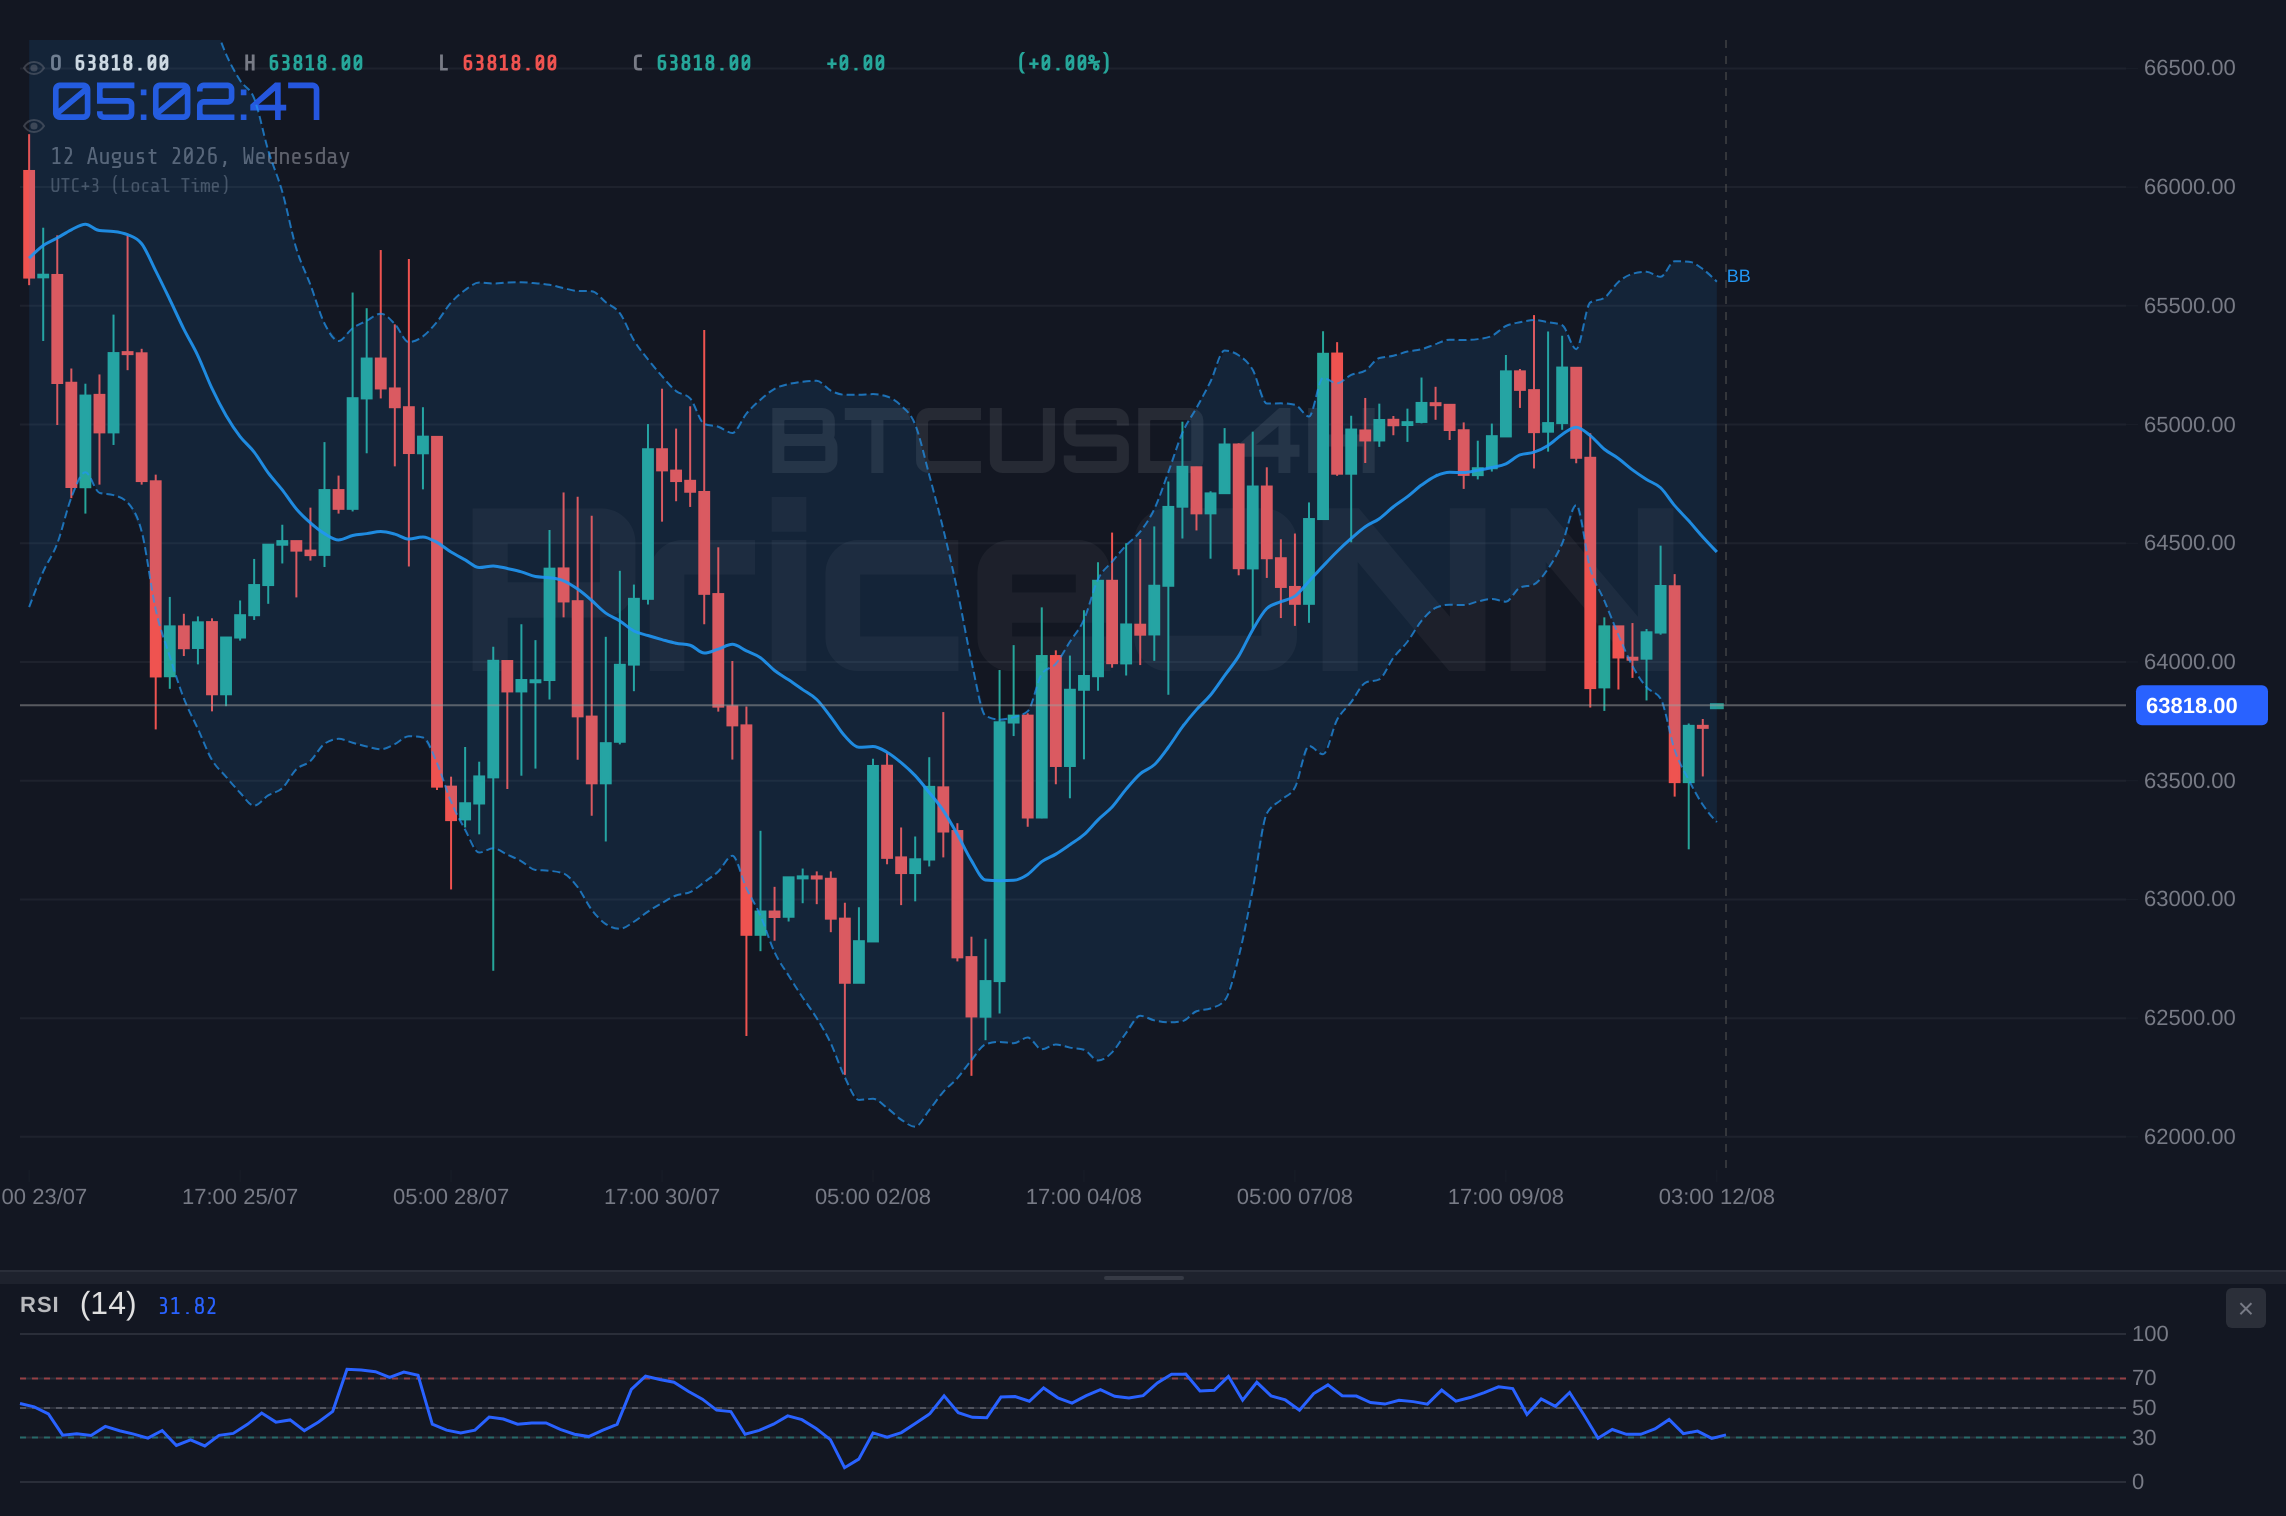
Looking at the 4-hour timeframe, the picture for BTCUSD becomes more bearish. Here, the price is navigating below the middle Bollinger Band, a sign that downward pressure is building. The immediate support levels are situated at $63,381, $63,031, and $63,851. Resistance remains a hurdle at $63,911, $64,091, and $64,441. The RSI(14) dips to 41.05, reinforcing the notion of bearish sentiment in the medium term. The MACD on this timeframe also shows negative momentum, with the MACD line firmly below its signal line. This suggests that the recent upward momentum seen on the hourly chart might be a temporary retracement within a larger downtrend or consolidation phase. The ADX at 26.16 still points to a strong trend, but the overall indicator signals lean towards selling, with a general signal of 'SAT' (Sell) from the 4-hour analysis. This divergence between the 1-hour and 4-hour charts highlights the importance of multi-timeframe analysis to understand the prevailing market forces.
The Gold Factor: A Safe Haven's Shine
The rally in gold, pushing towards $4,400, is a significant development that cannot be ignored when analyzing Bitcoin. Gold's ascent is often interpreted as a barometer of global economic anxiety and inflation concerns. The precious metal benefits when investors seek refuge from market volatility and fear of rising prices. The fact that gold is reaching two-month highs suggests a heightened level of risk aversion in the broader financial markets. This sentiment can directly impact Bitcoin, which, despite its growing adoption, is still largely viewed as a risk-on asset. When safe-haven assets like gold are in demand, capital tends to flow out of speculative assets. This dynamic implies that any significant upward movement in Bitcoin might face headwinds as long as gold continues its strong upward trajectory. The news citing gold reclaiming bullish momentum and a rally resuming above $4,250, surpassing a major contracting triangle, underscores the strength of this move. Traders are looking at gold's performance as a potential indicator of broader market risk sentiment, which will inevitably influence Bitcoin's path.
Macroeconomic Crosscurrents: CPI and Fed Watch
The upcoming Consumer Price Index (CPI) report is the most significant macroeconomic event on the immediate horizon. This report will provide crucial insights into the trajectory of inflation in the United States. If the CPI data comes in hotter than expected, it could reignite fears of persistent inflation, potentially prompting the Federal Reserve to reconsider its monetary policy stance. Such a development would likely strengthen the US Dollar (DXY), which is currently trading around 99.87 and showing a daily upward move, and put further pressure on risk assets like Bitcoin. Conversely, a cooler-than-expected inflation reading could bolster expectations for an imminent Fed rate cut, which would typically be a bullish catalyst for cryptocurrencies. The market's reaction to the recent US jobs data, which saw the USD index plummet and gold benefiting from the Fed’s reluctance to raise interest rates, already hints at the sensitivity of these markets to employment and inflation figures. The news suggesting that a weak jobs report already made the case for a Fed hold, but only Wednesday's CPI can confirm inflation is cooling, highlights the critical nature of this upcoming data release.
The correlation between the US Dollar Index (DXY) and Bitcoin is also a key area of focus. Currently, the DXY is showing a daily increase, trading around 99.87. A strengthening dollar often correlates with a weaker Bitcoin, as it becomes more expensive for holders of other currencies to purchase dollar-denominated assets like BTC. However, the relationship isn't always direct, especially when market sentiment shifts dramatically. On the 1-hour chart, the DXY shows a neutral trend with some upward momentum. The 4-hour chart also indicates a neutral trend, but the daily chart paints a clearer picture of a downtrend with strong bearish momentum (ADX at 28.85). This mixed signal from the DXY warrants close observation; a decisive move either up or down could provide further clarity on its impact on BTCUSD.
On-Chain Metrics: A Mixed Bag for Bitcoin
Delving into Bitcoin's on-chain metrics offers a nuanced perspective. While the price action has been relatively flat, activity on the network can provide deeper insights. Active addresses, a measure of network engagement, have shown some resilience, indicating that despite the sideways price movement, the underlying user base remains active. This suggests that accumulation might be occurring at these levels, potentially laying the groundwork for a future rally. However, exchange flows need careful monitoring. If we see a significant increase in Bitcoin moving onto exchanges, it could signal an increased willingness among holders to sell, potentially leading to downward pressure. Conversely, a sustained outflow of Bitcoin from exchanges would be a bullish signal, indicating that investors are moving their assets into cold storage, anticipating a price increase. Whale movements, tracked by large wallet accumulations or distributions, also play a crucial role. Any notable shifts in whale holdings could precede significant price action. The hash rate, a measure of Bitcoin's network security and mining power, has been robust, indicating strong network health, which is a fundamental positive for the ecosystem.
The Altcoin Correlation and Dominance Play
Bitcoin's dominance, the percentage of the total cryptocurrency market capitalization held by Bitcoin, is another critical metric to watch. When Bitcoin dominance rises, it often signifies a flight to safety within the crypto market itself, potentially at the expense of altcoins. Conversely, a falling Bitcoin dominance can indicate a period of altcoin outperformance, often referred to as an 'altcoin season.' Currently, the dominance chart needs to be assessed in conjunction with BTCUSD's price action. If BTCUSD consolidates or declines, and its dominance simultaneously rises, it suggests that capital is rotating from altcoins into Bitcoin. If Bitcoin dominance falls while BTCUSD remains flat or slightly declines, it could signal a rotation into specific altcoins that are showing stronger technical setups or fundamental catalysts. The performance of major altcoins like Ethereum (ETHUSD), currently trading around $1,884.72, provides a good proxy for the broader altcoin market sentiment. ETHUSD's technicals on the 1-hour chart show a neutral trend with bullish signals, but the 4-hour and daily charts lean bearish, reflecting the overall choppiness in the crypto space.
The correlation between Bitcoin and major altcoins like Ethereum is also important. While historically high, these correlations can shift, particularly during periods of significant market events or sector-specific news. For instance, developments in Ethereum's ecosystem, such as upgrades to the network or shifts in staking yields, can influence its price independently of Bitcoin. However, in the absence of such specific catalysts, Bitcoin's price action often dictates the direction for the broader altcoin market. The current technical signals for ETHUSD are mixed, with the 1-hour chart showing bullish leanings while higher timeframes suggest caution. This mirrors the broader market sentiment where uncertainty prevails ahead of key economic data.
Institutional Adoption and Regulatory Landscape
The long-term outlook for Bitcoin and the broader crypto market remains intrinsically linked to institutional adoption and regulatory clarity. Recent reports suggest continued interest from institutional players, albeit tempered by the current macroeconomic uncertainty. Developments like the approval of Bitcoin ETFs in various jurisdictions have been significant drivers, increasing accessibility and legitimacy for traditional investors. However, regulatory scrutiny remains a persistent factor. Any news regarding new regulations, enforcement actions, or policy shifts can trigger significant price movements. For example, news related to 'US-Japan Intervention' or 'USDjpy & Gold Trading Strategies' in the forex markets, while not directly about crypto, highlights the interconnectedness of global financial markets and how regulatory actions in one sphere can influence sentiment across others. The crypto space is particularly sensitive to regulatory news, and a clear, favorable regulatory framework would undoubtedly provide a substantial boost to institutional adoption and, consequently, to Bitcoin's price.
Scenario Analysis: Navigating the Uncertainty
Bearish Scenario: The Consolidation Break
65% ProbabilityNeutral Scenario: Range-Bound Trading Continues
25% ProbabilityBullish Scenario: CPI Boost
10% ProbabilityThe current technical setup, particularly the mixed signals across different timeframes and the proximity to key support and resistance levels, suggests that the bearish scenario carries the highest probability in the short term. The RSI readings on the 1-hour and 4-hour charts lean bearish, and the overall market sentiment, influenced by gold's rally and ongoing CPI anticipation, favors caution. A break below the $63,587 support level would likely confirm this bearish bias, opening the door for further downside towards the $63,000 psychological level and potentially lower. The neutral scenario remains a strong possibility if the CPI data provides no clear direction or if market participants decide to wait for further confirmation before committing to a significant trade. A bullish outcome hinges heavily on a surprisingly dovish CPI report, which could trigger a sharp risk-on rally, but this appears to be the least probable outcome given the current macro environment.
What I'm Watching This Week
My immediate focus remains on the $63,587 support level. A confirmed break and hold below this level on the 4-hour chart would be a strong signal for a bearish continuation. Conversely, a sustained push and close above the $63,804 resistance, particularly on increased volume, could signal a short-term bullish reversal, although significant upside may be capped until the CPI data is digested. The performance of gold and the DXY will be crucial correlating indicators. If gold continues its ascent and the DXY strengthens, it would further validate the bearish outlook for BTCUSD. Traders should remain disciplined, manage risk tightly, and await clear directional signals rather than attempting to anticipate the market's next move prematurely.
Frequently Asked Questions: BTCUSD Analysis
What happens if BTCUSD breaks below $63,587 support?
A break below the $63,587 support level on the 4-hour chart would invalidate the current consolidation and likely trigger further selling pressure. This could lead to price targets of $63,444 and potentially $63,031 as the market reacts to the bearish signal.
Should I buy BTCUSD at current levels of $63,817 given the mixed signals?
Given the mixed signals and the upcoming CPI data, entering aggressively at current levels is not recommended. A clearer setup would emerge from a confirmed break above $63,804 resistance for a bullish bias or a decisive move below $63,587 support for a bearish outlook. Patience is key.
Is the RSI at 47.32 a sell signal for BTCUSD right now?
An RSI of 47.32 on the 1-hour chart indicates bearish momentum but is not yet in oversold territory. While it leans towards selling pressure, it's crucial to consider it alongside other indicators like the MACD, which shows positive momentum, suggesting caution before acting solely on the RSI.
How will the upcoming CPI report affect BTCUSD this week?
A hotter-than-expected CPI could increase inflation fears, strengthen the DXY, and pressure BTCUSD downwards. Conversely, a cooler-than-expected report might boost risk appetite, potentially leading to a rally in BTCUSD as traders anticipate looser monetary policy.
Track markets in real-time
AI-powered analysis, technical indicators and real-time price data.
Join Our Telegram Channel
Breaking market news, AI analysis and trading signals instantly.
Join Channel