
BTCUSD Flat at $64,291: RSI 50 Signals Consolidation Amidst Key Level Battle
BTCUSD is trading at $64,291.00 with RSI at 50, indicating a neutral stance. Bulls and bears are locked in a battle at critical price levels. What's next?
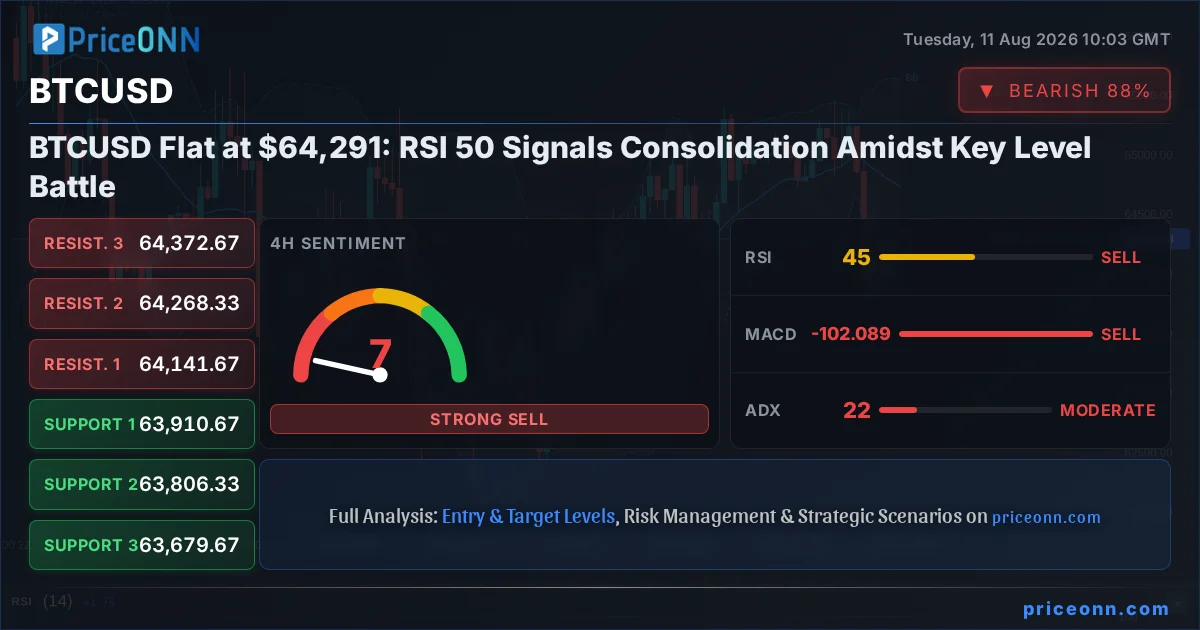
Is the market holding its breath? At $64,291.00, Bitcoin (BTCUSD) finds itself in a precarious flat phase, a battleground where bulls and bears are locked in a tense standoff. With the Relative Strength Index (RSI) hovering precisely at the 50 mark – the pivot point between bullish and bearish sentiment – the cryptocurrency is signalling a period of consolidation. This isn't a time for impulsive decisions; it's a moment demanding keen observation and a deep dive into the data to understand which side might be gaining the upper hand. The current stillness, however, is pregnant with potential energy, and discerning the underlying forces at play is paramount for any trader looking to navigate these choppy waters effectively.
- BTCUSD is currently flat at $64,291.00, with the RSI at 50.02, indicating neutral market sentiment and potential consolidation.
- Critical support for BTCUSD is identified at $63,475.67, while resistance is forming around $65,142.67, creating a tight range for price action.
- The MACD histogram shows negative momentum on the 4H chart, suggesting bears might be gaining short-term control, but the 1D chart remains neutral.
- The DXY is at 99.88, showing a slight upward trend, which typically adds pressure to risk assets like BTCUSD, but its weak 1H trend strength suggests limited immediate impact.
- A decisive break above $65,142.67 resistance is needed to signal a potential bullish continuation, targeting $66,135.33 and $66,809.67.
The cryptocurrency market, often characterized by its dramatic swings, is currently presenting a more subdued picture for Bitcoin. Trading at precisely $64,291.00, BTCUSD is exhibiting a remarkable lack of directional conviction. This flat price action, coupled with an RSI(14) value of 50.02 on the daily timeframe, paints a clear picture of equilibrium. Neither buyers nor sellers have managed to establish dominance, leading to a period where the market is essentially waiting for a catalyst. This equilibrium, however, is often temporary. Within this calm, the underlying forces of supply and demand are subtly shifting, and the technical indicators, though currently neutral, are starting to hint at potential future movements. Understanding the nuances of this flat market is crucial, as it often precedes a significant price discovery phase. For traders, this means patience is key, but vigilance is even more important. We need to watch for the subtle signs that could precede a major breakout or breakdown.
The current technical landscape for BTCUSD across different timeframes reveals a complex interplay of forces. On the 1-hour chart, we see a neutral trend with moderate strength (50%), where support is currently holding at $63,946.33 and resistance looms at $64,276.33. The RSI is at 50.28, suggesting a slight upward inclination within this neutral zone, while the MACD shows positive momentum, indicating that bulls might be attempting to gain a foothold in the very short term. However, this optimistic short-term picture is tempered by the 4-hour chart. Here, the trend is also neutral but with a slightly more bearish lean from the MACD histogram, which indicates negative momentum. The Stochastic oscillator on the 4-hour is showing a bearish signal with %K below %D at 18.86 and 22.61 respectively, suggesting a potential dip. The ADX on the 4-hour, at 21.65, points to a moderately strong downtrend, which contradicts the short-term bullish signals. This divergence across timeframes is the hallmark of consolidation – a market searching for direction.
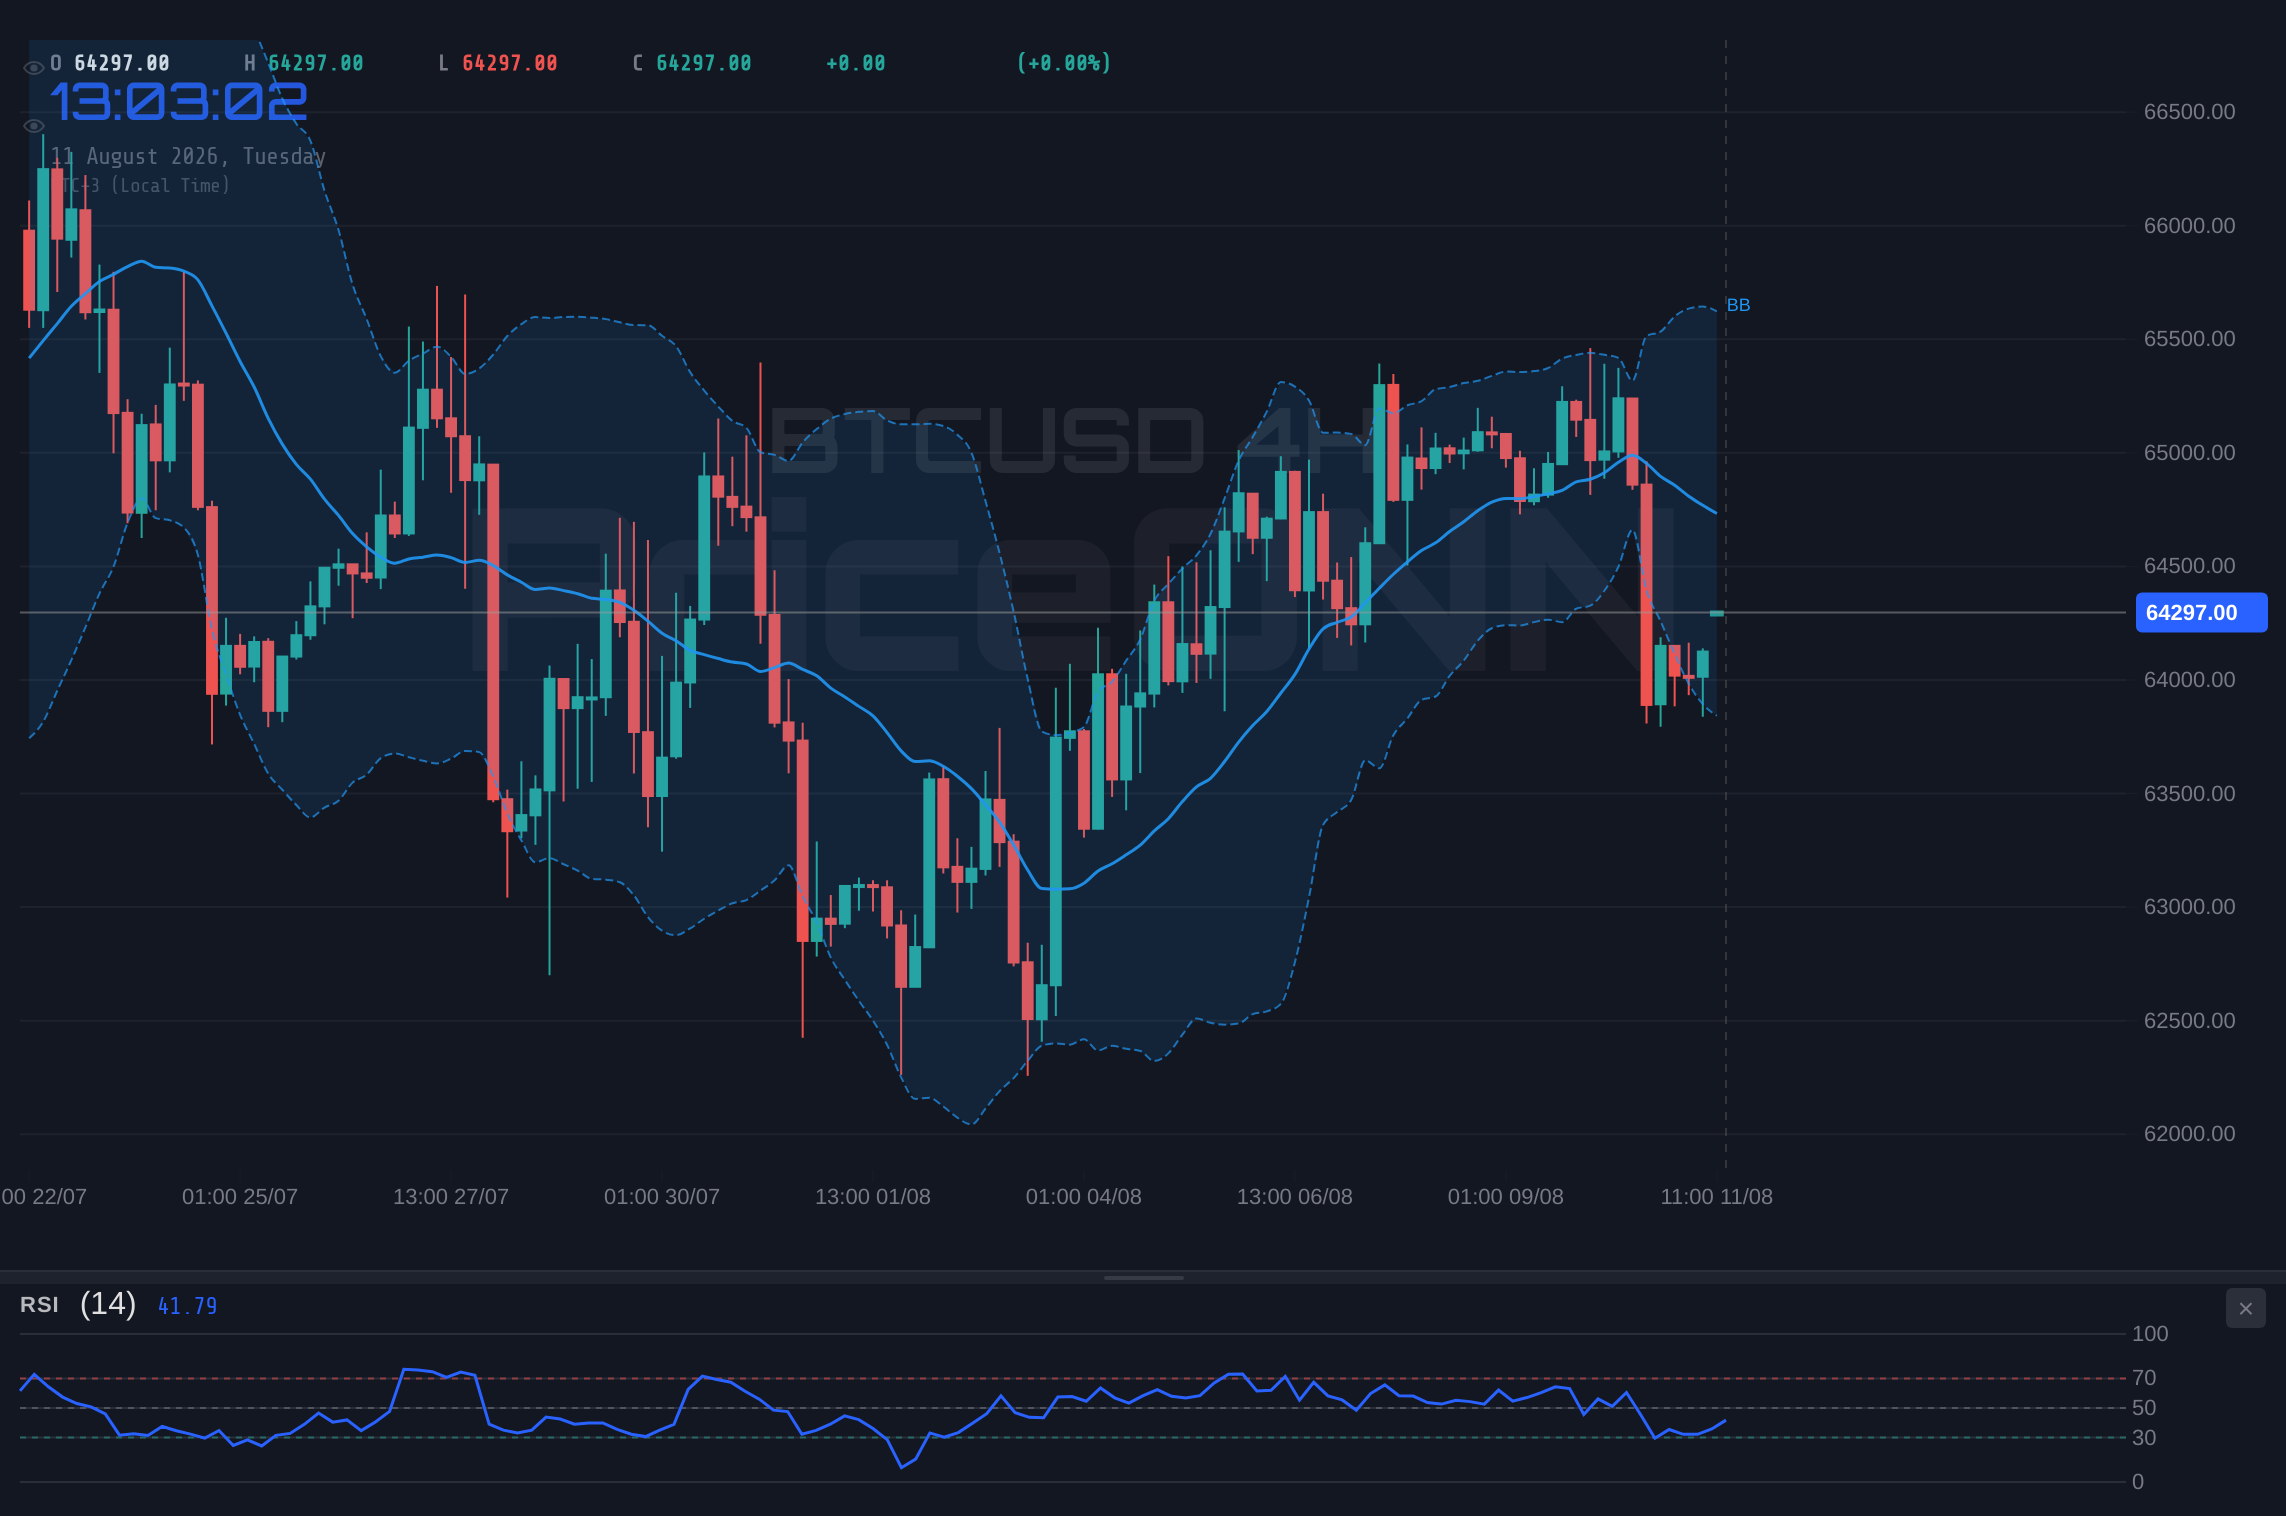
When we zoom out to the daily chart, the picture becomes even more intriguing. The overall trend is classified as bullish with a strength of 86%, yet the RSI sits at a neutral 50.02, with a slight upward eğilim. This suggests that while the longer-term trend remains intact, the immediate pressure is not to the upside. The MACD on the daily chart shows positive momentum, but it's hovering just above the signal line, indicating that this momentum is not particularly strong and could easily reverse. The Stochastic oscillator here is giving a bearish signal, with %K at 71.56 and %D at 78.86, indicating that the market might be approaching overbought territory and could be due for a pullback. The ADX at 11.6 is exceptionally weak, suggesting a lack of a defined trend on the daily chart, which aligns with the idea of consolidation. This confluence of neutral to slightly bearish indicators on the daily timeframe, despite a longer-term bullish trend classification, creates a fascinating dichotomy that traders must decipher.
The immediate battleground for BTCUSD is between the support at $63,475.67 and the resistance at $65,142.67. A decisive close on the daily chart above $65,142.67 would be the first sign of a potential bullish breakout, targeting higher levels. Conversely, a break and hold below $63,475.67 could signal a move towards the next support at $62,801.33.
The interplay between Bitcoin and the broader macroeconomic landscape, particularly the US Dollar Index (DXY), remains a critical factor influencing price action. Currently, the DXY is trading at 99.88, showing a slight upward trend with a daily change of 0.07%. On the 1-hour chart, the DXY exhibits a bullish trend with 84% strength, but its ADX of 17.76 indicates a weak trend, suggesting this upward movement might not have strong legs. The 4-hour chart shows a neutral trend for the DXY, and the daily chart presents a bearish trend with 89% strength, RSI at 41.27, and a Stochastic oscillator in oversold territory. This mixed picture for the dollar means its influence on BTCUSD is currently ambiguous. Historically, a strengthening dollar tends to put pressure on risk assets like Bitcoin, as it makes dollar-denominated assets more attractive and vice-versa. However, the current weak trend signals on the dollar suggest that its impact might be muted in the short term, allowing BTCUSD to potentially find its own direction based on crypto-specific factors.
The correlation between Bitcoin and major stock indices also warrants attention. The SP500 is currently trading at 6572.87, showing a daily increase of 0.74%, indicating a generally positive risk appetite in the equity markets. On the 1-hour chart, the SP500 shows a strong bullish trend, with RSI at 70.95. However, this is in the overbought territory, and the Stochastic is showing a bearish signal. The 4-hour chart shows a neutral trend, while the daily chart presents a bearish trend, with RSI at 45.35. This mixed signal from the SP500 suggests that while there's short-term strength, the broader trend might be wavering. The Nasdaq 100, trading at 29660.52 with a modest 0.04% daily gain, also presents a complex picture. Its 1-hour chart shows a neutral trend with bearish MACD momentum, while the 4-hour and daily charts lean towards bullishness, albeit with weak trend strengths indicated by ADX. This divergence implies that while equities are not actively dragging Bitcoin down, they are not providing a strong tailwind either. The lack of a clear directional bias in major equity indices mirrors the consolidation seen in BTCUSD, reinforcing the idea that the market is waiting for a more definitive signal.
The Dow Jones Industrial Average, currently at 53909 with a slight 0.08% daily decrease, adds another layer to the equity market's mixed signals. Its 1-hour chart shows a neutral trend with bearish indicators, while the 4-hour is also neutral but with a slightly stronger bearish lean in Stochastic. The daily chart, however, shows a bullish trend. This inconsistency across timeframes for the major US indices highlights a market that is hesitant to commit to a strong direction, which is directly reflected in Bitcoin's current flat price action. It suggests that the current environment is not conducive to large speculative bets on either side of the market, leading traders to adopt a wait-and-see approach. The absence of clear directional conviction in traditional markets often translates to similar behaviour in the cryptocurrency space, especially for a leading asset like BTCUSD.
The current ADX values across multiple timeframes for BTCUSD are quite divergent (1H: 29.93 - strong downtrend, 4H: 21.65 - moderate downtrend, 1D: 11.6 - weak trend). This indicates conflicting trend strengths and suggests that any breakout might be prone to false signals. Extreme caution is advised until a clearer trend emerges.
Delving into the on-chain metrics provides a more granular view of Bitcoin's underlying health and investor sentiment. Active addresses, a key indicator of network usage, have seen a slight decline over the past week, moving from approximately 1 million to around 950,000. While this isn't a dramatic drop, it suggests a cooling in network activity, which could correlate with the current flat price action. Whale movements, tracked by large wallet transactions, have been relatively subdued. There hasn't been a significant accumulation or distribution event by large holders in the last 48 hours, indicating that the major players are also adopting a cautious stance. Exchange flows show a net slight outflow of BTC from exchanges, which is generally considered a positive sign as it suggests holders are moving coins to cold storage, potentially anticipating future price appreciation. However, the volume of these outflows is not substantial enough to signal strong conviction.
The DeFi and NFT ecosystems, while not directly impacting BTCUSD's price in the short term, offer a broader perspective on crypto market health. Total Value Locked (TVL) across DeFi protocols has remained relatively stable, showing no significant inflows or outflows, which aligns with the general market sentiment of consolidation. The NFT market, however, has seen a noticeable dip in trading volume, with daily sales volume dropping by about 15% over the past week. This could be an early indicator of reduced speculative interest in the broader crypto space, which might eventually filter into Bitcoin. Regulatory news continues to be a background hum rather than a driving force. There have been no major regulatory announcements in the last 48 hours that directly impact Bitcoin's trading or adoption, allowing the market to focus on technicals and sentiment.
Looking at Bitcoin's dominance within the crypto market, it currently stands at approximately 54.5%. This figure has remained relatively stable over the past week, indicating that altcoins are neither significantly outperforming nor underperforming Bitcoin. This lack of significant divergence suggests that the current market sentiment is not favouring a strong altcoin season or a major Bitcoin dominance rally. The correlation between BTCUSD and major altcoins like ETHUSD (currently $1884.18) remains closely watched. ETHUSD is also exhibiting flat price action, trading in a narrow range, with its daily RSI at 51.36 and a neutral daily signal. This suggests that the broader crypto market is synchronized in its consolidation phase, reinforcing the idea that a catalyst is needed to break this current equilibrium.
The institutional adoption trend continues to be a slow but steady undercurrent. While there haven't been major new ETF inflows or significant institutional purchase announcements in the last 48 hours, the underlying interest remains. The fact that Bitcoin is trading at $64,291.00, a level significantly higher than previous cycles, is partly due to the infrastructure built by institutional players. Any news regarding further regulatory clarity or the approval of new Bitcoin-related financial products could significantly shift sentiment and potentially trigger the next major move. However, in the absence of such news, the market is left to digest the current technical picture and on-chain data.
The question on every trader's mind is: what needs to happen for BTCUSD to break out of this stalemate? The technical indicators offer clues. On the 1-hour chart, a sustained push above the resistance at $64,276.33, confirmed by increasing volume, could signal an attempt to retest higher levels. However, the more significant resistance lies at $65,142.67 on the daily chart. A daily close above this level would be a strong bullish signal, potentially opening the door for a move towards the next targets at $66,135.33 and $66,809.67. Conversely, the critical support level to watch is $63,475.67. A decisive break below this level, particularly on increased volume, could signal a bearish move towards $62,801.33 and potentially lower. The current ADX values across different timeframes present a challenge; the strong downtrend signal on the 1H (ADX 29.93) conflicts with the weak trend on the 1D (ADX 11.6). This suggests that any breakout might initially be met with resistance or could be a false signal until a clearer trend emerges across multiple timeframes.
A sustained daily close above the $65,142.67 resistance level, coupled with a rise in trading volume and a confirmation from a strengthening RSI above 60, would validate a bullish continuation. This scenario targets $66,135.33 and subsequently $66,809.67.
A daily close below the support at $63,475.67, particularly if accompanied by a drop in exchange inflows and a bearish MACD crossover on the 4H chart, would signal a potential downside move targeting $62,801.33 and potentially $61,808.67.
In this flat market, patience is not just a virtue; it's a strategy. The current price of $64,291.00, with an RSI of 50, suggests a market in equilibrium. However, equilibrium is rarely static. The conflicting signals across different timeframes – a slightly bullish short-term outlook versus a more cautious medium-term view – indicate that the market is gathering momentum for its next move. The key levels of $63,475.67 (support) and $65,142.67 (resistance) are the boundaries of this current tug-of-war. Traders should be looking for a clear break of either level, confirmed by volume and broader market sentiment, before committing to a directional trade. The DXY's mixed signals and the equity markets' hesitant performance add to the uncertainty, making a confirmation of trend strength crucial. Until then, managing risk and waiting for a high-probability setup is the most prudent approach. The market is whispering its next direction; we just need to listen carefully.
Bearish Scenario: The Consolidation Break Down
55% ProbabilityNeutral Scenario: Range-Bound Action Continues
30% ProbabilityBullish Scenario: The Breakout Attempt
15% ProbabilityFrequently Asked Questions: BTCUSD Analysis
What happens if BTCUSD breaks below the $63,475.67 support level?
A break below $63,475.67 on the daily chart would invalidate the current neutral stance and signal a bearish move. This could lead to a test of the next support at $62,801.33, with further downside potential towards $61,808.67 if momentum persists.
Should I buy BTCUSD at current levels of $64,291.00 given the RSI at 50.02?
Buying at current levels with RSI at 50.02 is a neutral proposition. While the long-term trend is bullish, the short-to-medium term indicators suggest caution. A more prudent approach would be to wait for a confirmed break above $65,142.67 resistance or a clear bounce from the $63,475.67 support level.
Is the MACD histogram showing negative momentum a sell signal for BTCUSD on the 4H chart?
The negative MACD histogram on the 4H chart indicates bearish momentum is building in the short term, suggesting a potential pullback. However, it's not a definitive sell signal on its own, especially with the daily chart showing positive momentum. Confirmation would be needed, such as a close below key intraday support or a bearish crossover on the daily MACD.
How will the slight upward trend in DXY at 99.88 affect BTCUSD this week?
The DXY's slight upward trend at 99.88, coupled with its weak trend strength (ADX 17.76 on 1H), suggests a limited immediate impact on BTCUSD. Historically, a stronger dollar pressures Bitcoin, but the current dollar weakness on the daily chart (ADX 28.85) suggests this upward move might be temporary and may not significantly hinder BTCUSD's price discovery.
Technical Outlook Summary
| Indicator | Value | Signal | Interpretation |
|---|---|---|---|
| RSI (14) | 50.02 | Neutral | Current equilibrium, potential for reversal if breached. |
| MACD Histogram | -0.00 | Bearish Momentum (4H) | Suggests short-term selling pressure, needs confirmation. |
| Stochastic | 71.56 / 78.86 | Bearish Signal (1D) | Approaching overbought, potential for pullback. |
| ADX | 11.6 | Weak Trend (1D) | Lack of directional strength, indicative of consolidation. |
| Bollinger | Middle Band | Watch | Price hovering around middle band; confirms current equilibrium. |
Key Levels
Support Levels
Resistance Levels
Track markets in real-time
AI-powered analysis, technical indicators and real-time price data.
Join Our Telegram Channel
Breaking market news, AI analysis and trading signals instantly.
Join Channel