
ETHUSD Trades Near $1,877: Bulls Face Resistance at $1,925
ETHUSD hovers around $1,877.97 as traders weigh key resistance at $1,925 against support at $1,911. Technicals show mixed signals amid broader market uncertainty.
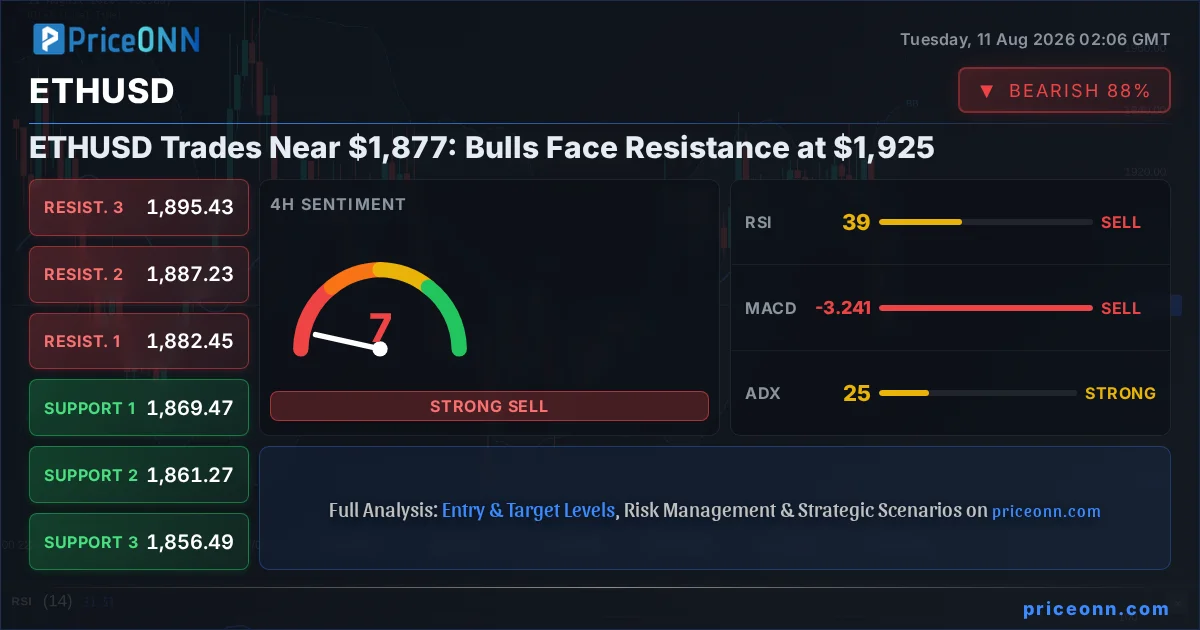
The cryptocurrency market is at a critical juncture, with ETHUSD currently trading near the $1,877.97 mark. This level represents a significant battleground where bulls and bears are locked in a tense standoff. With key resistance looming at $1,925 and support holding firm at $1,911, the immediate future of Ethereum hangs in the balance. This analysis delves into the technical indicators, market sentiment, and macro-economic factors influencing ETHUSD's price action, aiming to provide a clear picture of the potential scenarios ahead.
- ETHUSD is trading near $1,877.97, with significant technical levels at $1,911 (support) and $1,925 (resistance).
- On the 1H chart, RSI at 37.69 and ADX at 38.07 suggest a strong downtrend is in play, despite a Stochastic crossover.
- The 1D trend shows a strong 88% bullish power, yet MACD is negative and Bollinger bands are below the middle band, indicating potential downside pressure.
- Correlation with DXY (99.8) and SP500 (6572.87) suggests a risk-off environment might weigh on ETHUSD, though strong equity performance could offer support.
The Bullish Case: Can ETHUSD Break Higher?
Navigating the $1,911 Support
For Ethereum to even consider a sustained upward move, holding the immediate support at $1,911 is paramount. Looking at the 1D time frame data, the support levels are clearly defined: $1,911.19, $1,903.71, and $1,911.19. A bounce from this $1,911.19 area would be the first sign that the bears might be losing their grip. The 1D trend strength is reported at a robust 88%, indicating an underlying bullish momentum that has been building. However, this bullish sentiment needs to translate into price action above the immediate resistance. The Stochastic indicator on the 1D chart, with %K at 70.06 and %D at 68.51, is showing a bullish signal with %K above %D, suggesting that buyers might be stepping in. This could set the stage for a test of the higher resistance levels.
Momentum and Divergence Signals
While the 1H and 4H time frames present a bearish picture with strong downtrend signals (ADX at 38.07 and 25.28 respectively), the 1D chart offers a glimmer of hope for the bulls. The MACD on the 1D chart, though showing negative momentum on lower timeframes, is still technically above its signal line, hinting at a potential shift. This subtle divergence between the shorter-term bearish signals and the longer-term bullish trend strength is where traders often look for opportunities. If ETHUSD can manage to consolidate above $1,911.19 and then push through the initial resistance at $1,925.63, the next target would be $1,932.59. A decisive break above $1,940.07 could signal a more significant trend reversal, attracting further buying pressure.
Institutional Interest and Ecosystem Growth
Beyond the immediate price action, the underlying fundamentals of the Ethereum ecosystem continue to develop. Developments in Layer 2 scaling solutions, increased Total Value Locked (TVL) in DeFi protocols, and ongoing NFT market activity all contribute to Ethereum's long-term value proposition. While not directly reflected in the real-time technical indicators, this fundamental strength provides a backdrop against which price fluctuations occur. Institutional adoption, often signaled by increased exchange inflows or outflows and the performance of crypto-related ETFs, can also play a crucial role. If positive news regarding regulatory clarity or significant institutional investment emerges, it could provide the catalyst needed for ETHUSD to overcome its current resistance levels and resume its upward trajectory.
The Bearish Case: Why $1,877 Could Be a Slippery Slope
1H and 4H Bearish Dominance
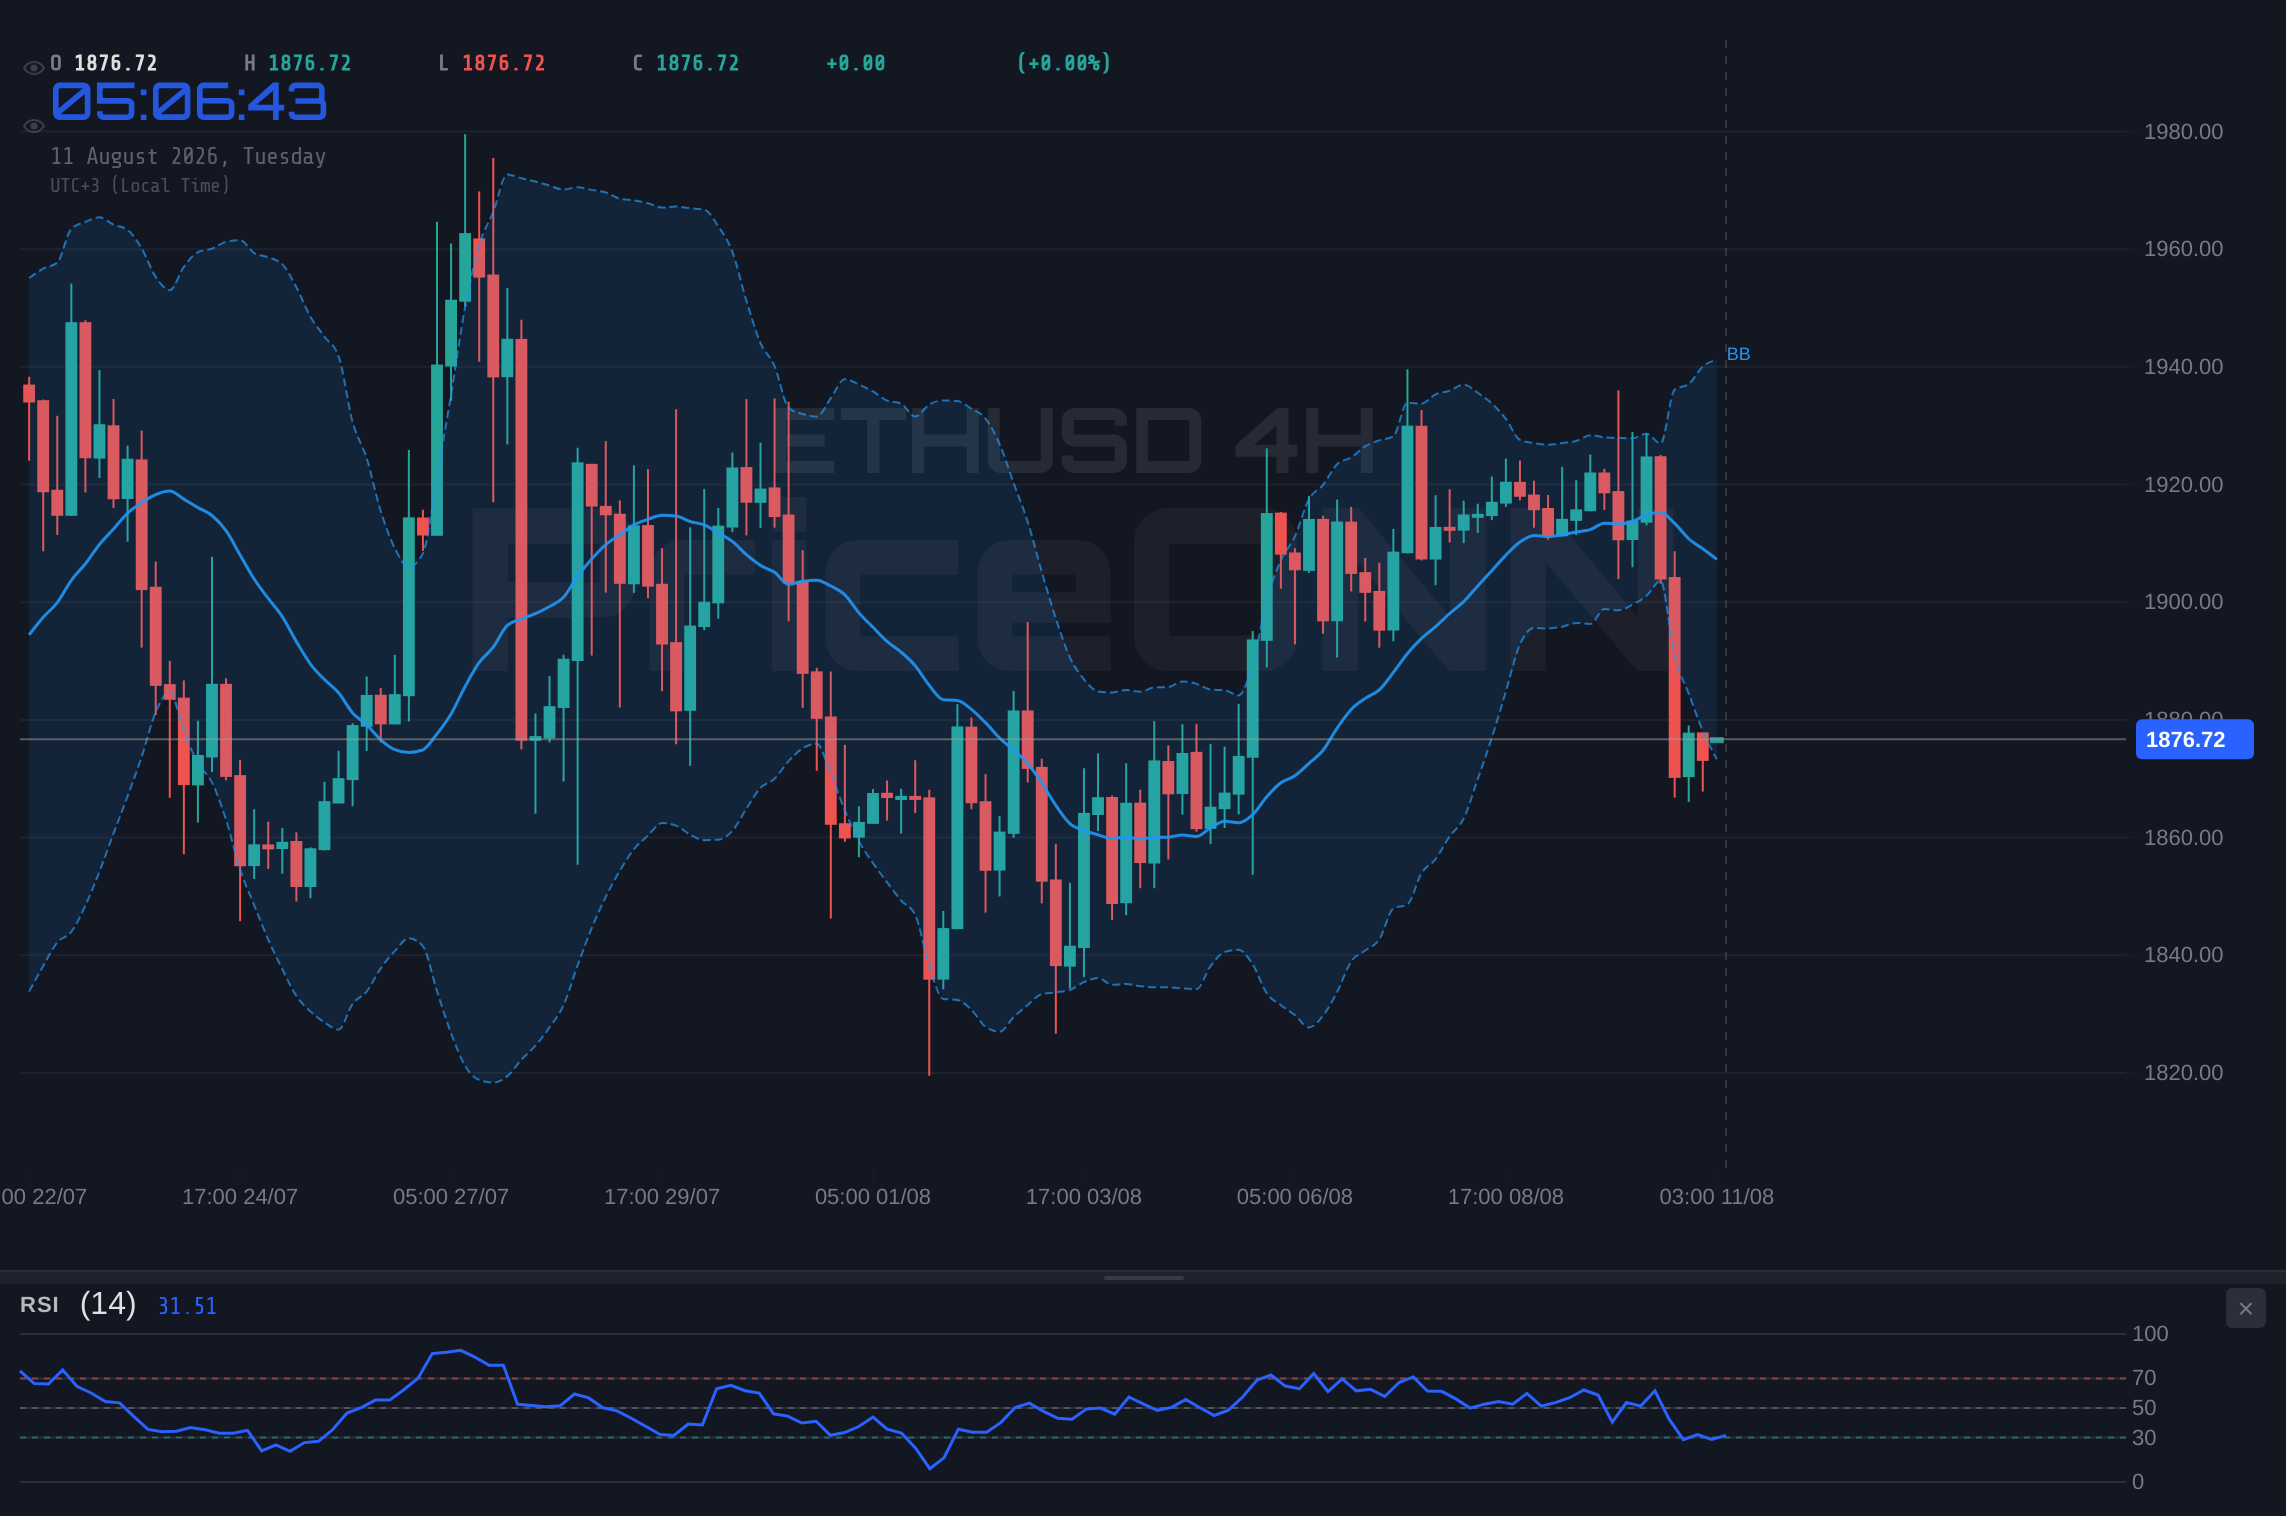
The immediate technical picture for ETHUSD is decidedly bearish. On the 1H timeframe, the RSI is sitting at 37.69, firmly in neutral territory but trending downwards, indicating a lack of buying enthusiasm. The MACD is below its signal line, and the ADX at 38.07 signals a strong downtrend. This is further corroborated by the Bollinger Bands, which are below the middle band, suggesting downward pressure. Similarly, the 4H timeframe paints a grim picture: RSI at 39.28, MACD negative, and Stochastic %K (12.9) below %D (25.32), confirming a bearish signal. The ADX here is 25.28, still indicating a strong trend. These short-to-medium term indicators suggest that the path of least resistance is currently to the downside, making the $1,877.97 price point potentially vulnerable.
Key Resistance Levels and Breakdown Risk
The resistance levels are clearly defined: $1,875.23 and $1,877.25 on the 1H chart, and $1,882.45 on the 4H chart. While the current price of $1,877.97 is hovering near these immediate resistance points, the prevailing bearish momentum on lower timeframes suggests that breaking through them might be challenging. If ETHUSD fails to hold above the crucial support at $1,911.19 and instead breaks below it, the next logical downside targets would be $1,903.71 and then $1,896.75. A decisive break below $1,866.06, the day's low, would solidify the bearish outlook and could trigger further liquidations, pushing the price towards lower psychological levels.
Macroeconomic Headwinds and Correlation
The broader macroeconomic environment plays a significant role in the performance of cryptocurrencies. The DXY (Dollar Index) is currently at 99.8, showing strength. Historically, a stronger dollar often correlates with a risk-off sentiment, which can pressure riskier assets like Ethereum. While the SP500 is trading at 6572.87, indicating a degree of risk appetite, its own 1D trend is bearish (Power: 100%), suggesting potential for a broader market pullback. If equities were to falter, especially with the Nasdaq100 at 29706.51 showing a neutral 1D trend, it could spill over into the crypto market. Furthermore, persistent inflation concerns, even if not directly mentioned in the provided news snippets for this specific article, often lead central banks to maintain hawkish stances, indirectly dampening speculative asset prices. The recent significant rise in oil prices (Brent at $86.57, WTI at $83.38) could also fuel inflation fears, complicating the monetary policy outlook and potentially acting as a drag on ETHUSD.
The Technical Tug-of-War: Indicators in Conflict
Divergent Signals Across Timeframes
The most compelling aspect of ETHUSD's current technical setup is the divergence between different timeframes. The 1D chart paints a cautiously optimistic picture with a strong bullish trend power (90%) and a bullish Stochastic signal. However, this is directly contradicted by the immediate 1H and 4H charts, which clearly indicate bearish momentum. The RSI on the 1H (37.69) and 4H (39.28) is in oversold territory, suggesting a potential for a bounce, yet the strong ADX values (38.07 and 25.28) on these lower frames imply that any bounce might be short-lived or a mere retracement within a larger downtrend. This conflict between short-term weakness and longer-term bullish potential creates a highly uncertain trading environment. Traders must decide whether to bet on the continuation of the bearish momentum on lower timeframes or anticipate a reversal based on the 1D trend strength and Stochastic signal.
MACD and Bollinger Band Interpretations
Examining the MACD and Bollinger Bands further illustrates this conflict. On the 1D chart, MACD shows positive momentum, which is a bullish sign. However, on the 1H and 4H charts, the MACD is negative and below its signal line, indicating bearish pressure. This means that while the overall direction might be attempting to turn upwards, the immediate selling pressure is still significant. The Bollinger Bands on the 1D chart are below the middle band, a bearish signal, suggesting that the price is trading in the lower half of its recent range. Conversely, on the 1H and 4H, the bands are also showing downward pressure. This lack of clear directional consensus from these key indicators means that price action and volume will be crucial in determining the next move.
ADX and Trend Strength Analysis
The Average Directional Index (ADX) provides insight into the strength of the current trend. On the 1H and 4H charts, the ADX values of 38.07 and 25.28 respectively, indicate strong trending conditions, favoring the bearish momentum observed. However, the 1D ADX is a mere 16.34, signaling a weak trend. This is a critical piece of information: while short-term traders might be riding a strong downtrend, the overall longer-term trend is not yet firmly established in either direction. This weak 1D trend strength implies that the current price action could be more consolidative or range-bound in the longer term, and a breakout above resistance or breakdown below support could be more significant than usual. The strength of the trend is not yet confirming a clear path forward.
The Verdict: A Precarious Balance at $1,877.97
The Case for Caution: A Watch Zone Scenario
Given the conflicting signals across different timeframes and the current price hovering near resistance, the most prudent approach is a 'Watch Zone' strategy. The strong bearish signals on the 1H and 4H charts, coupled with the price action near resistance levels, suggest that a move lower is more probable in the immediate term. The support at $1,911.19 is critical. A failure to hold this level could lead to a cascade towards $1,896.75 and potentially lower. The strong dollar (DXY at 99.8) and the bearish 1D trend in the SP500 (6572.87) add to the risk-off sentiment that could pressure ETHUSD. Therefore, initiating a long position at current levels carries significant risk. A confirmation of strength is needed, ideally a clear break and hold above $1,925.63, before bullish positions can be considered with higher conviction.
Defining the Breakout or Breakdown
For a bullish scenario to materialize, ETHUSD needs to decisively break above the $1,925.63 resistance. A daily close above this level, supported by increasing volume and positive momentum indicators on lower timeframes, would signal a potential trend continuation or reversal. The targets would then be $1,932.59 and potentially $1,940.07. Conversely, a bearish scenario would be confirmed by a close below the $1,911.19 support. This would likely trigger stop-losses and accelerate selling pressure towards $1,903.71 and $1,896.75. The ADX reading on the 1D chart (16.34) suggests that a breakout above resistance or breakdown below support could lead to a more significant price move than usual, as the trend is not yet strongly defined.
What to Watch Next
The immediate focus should be on the $1,911.19 support level. A sustained hold here, followed by a push above $1,925.63, would be the first sign of a bullish turnaround. Traders should monitor trading volume closely; a surge accompanying a breakout or breakdown would add significant weight to the move. Additionally, keep an eye on correlated assets. A weakening DXY or a recovery in the SP500 could provide tailwinds for ETHUSD. Conversely, a strengthening dollar or a downturn in equities would likely add to the selling pressure. Until a clear break of either the support or resistance level occurs, staying on the sidelines and waiting for confirmation is the most prudent strategy. The market is currently in a state of flux, and patience will be rewarded.
Frequently Asked Questions: ETHUSD Analysis
What happens if ETHUSD breaks below the $1,911 support level?
If ETHUSD closes below the critical $1,911.19 support, it would likely trigger further selling pressure. The immediate downside target would be $1,903.71, with a potential move towards $1,896.75 if the bearish momentum intensures.
Should I buy ETHUSD at current levels near $1,877.97 given the mixed signals?
Buying at current levels near $1,877.97 is risky due to bearish signals on lower timeframes and proximity to resistance. A higher probability trade would require a confirmed break above $1,925.63 on the 1D chart, or a clear breakdown below $1,911.19 to consider short positions.
Is the RSI at 37.69 on the 1H chart a sell signal for ETHUSD?
An RSI of 37.69 on the 1H chart indicates a lack of immediate buying strength and leans towards bearish momentum. However, it's not an outright sell signal on its own; it suggests caution and potential for further downside unless a clear bullish divergence or reversal pattern emerges.
How will the strong DXY at 99.8 affect ETHUSD's price this week?
A DXY value of 99.8 indicates a strengthening dollar, which typically puts pressure on risk assets like ETHUSD. This could exacerbate downward pressure on Ethereum, especially if the market sentiment turns risk-off.
Bearish Scenario: Downside Risk Dominates
70% ProbabilityNeutral Scenario: Consolidation Around $1,877
20% ProbabilityBullish Scenario: A Rebound Above Resistance
10% Probability| Indicator | Value | Signal | Interpretation |
|---|---|---|---|
| RSI (14) | 37.69 | Bearish | Weak momentum on 1H; neutral on 1D. |
| MACD | Negative | Bearish | Bearish momentum on 1H/4H; positive on 1D. |
| Stochastic | K=55.42, D=26.96 | Bullish crossover | Bullish signal on 1H, but bearish on 4H. |
| ADX | 38.07 | Strong Trend | Strong downtrend on 1H; weak trend on 1D. |
| Bollinger Bands | Below Mid | Bearish | Indicating downward pressure on lower timeframes. |
Track markets in real-time
AI-powered analysis, technical indicators and real-time price data.
Join Our Telegram Channel
Breaking market news, AI analysis and trading signals instantly.
Join Channel