

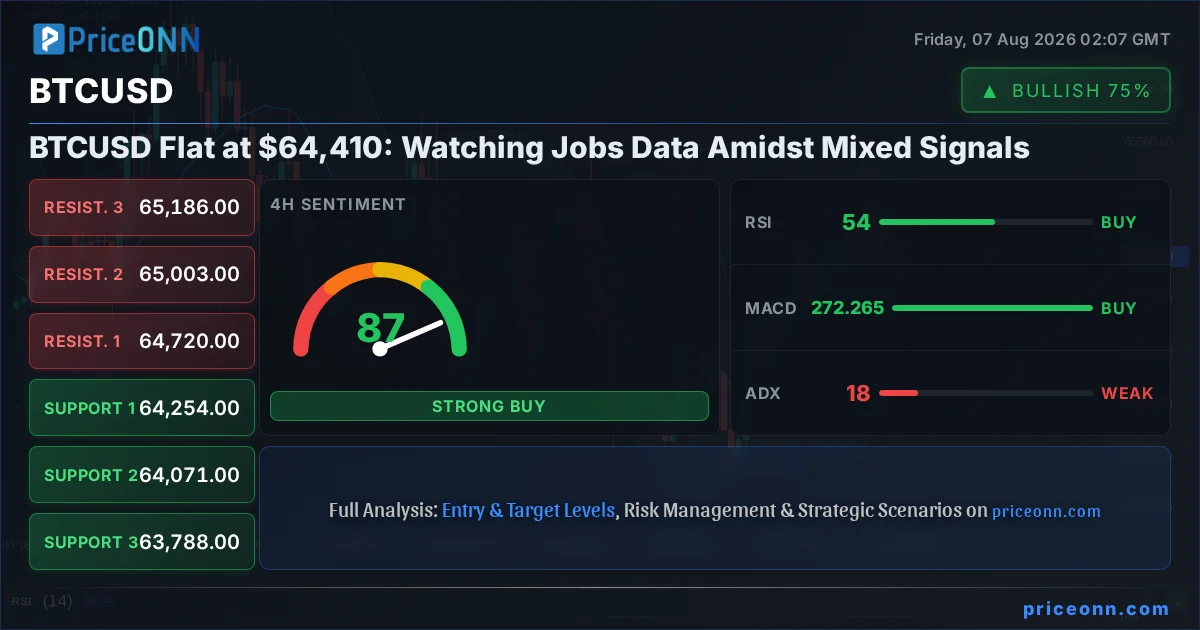
Bitcoin (BTCUSD) is currently navigating a critical juncture, trading flat around the $64,410 mark. This consolidation phase, occurring amidst a backdrop of mixed technical signals and heightened anticipation for crucial US employment data, presents a challenging yet potentially opportunity-rich environment for traders. The market is at a crossroads, with bulls and bears locked in a subtle dance as they await a definitive catalyst to break the stalemate. Understanding the interplay between on-chain metrics, macroeconomic influences, and precise price action is paramount for anyone seeking to navigate these choppy waters.
- BTCUSD is consolidating around $64,410, with mixed signals from oscillators like RSI (46.41 on 1H) and MACD.
- Critical support for BTCUSD is observed around $64,034.67, while resistance looms at $64,985.
- The ADX at 13.87 on the 1H chart indicates a weak trend, suggesting potential for a breakout.
- Traders are closely watching upcoming US jobs data for potential direction, with DXY at 99.98 showing strength.
The prevailing sentiment appears to be one of cautious observation. On the 1-hour chart, BTCUSD shows a neutral trend with a weak ADX reading of 13.87, suggesting that the market lacks a strong directional conviction. This is corroborated by the RSI at 46.41, which, while leaning bearish, is not in extreme territory. However, the MACD is showing negative momentum, lingering below its signal line, and Stochastic oscillators are also signaling a further dip with %K at 24.34 and %D at 25.79. This confluence of indicators on the shorter timeframe paints a picture of potential downside pressure, with immediate support identified at $64,221.67, followed by $64,127.33 and $64,034.67. A decisive break below these levels could trigger further liquidation.
The Tightening Grip Around $64K
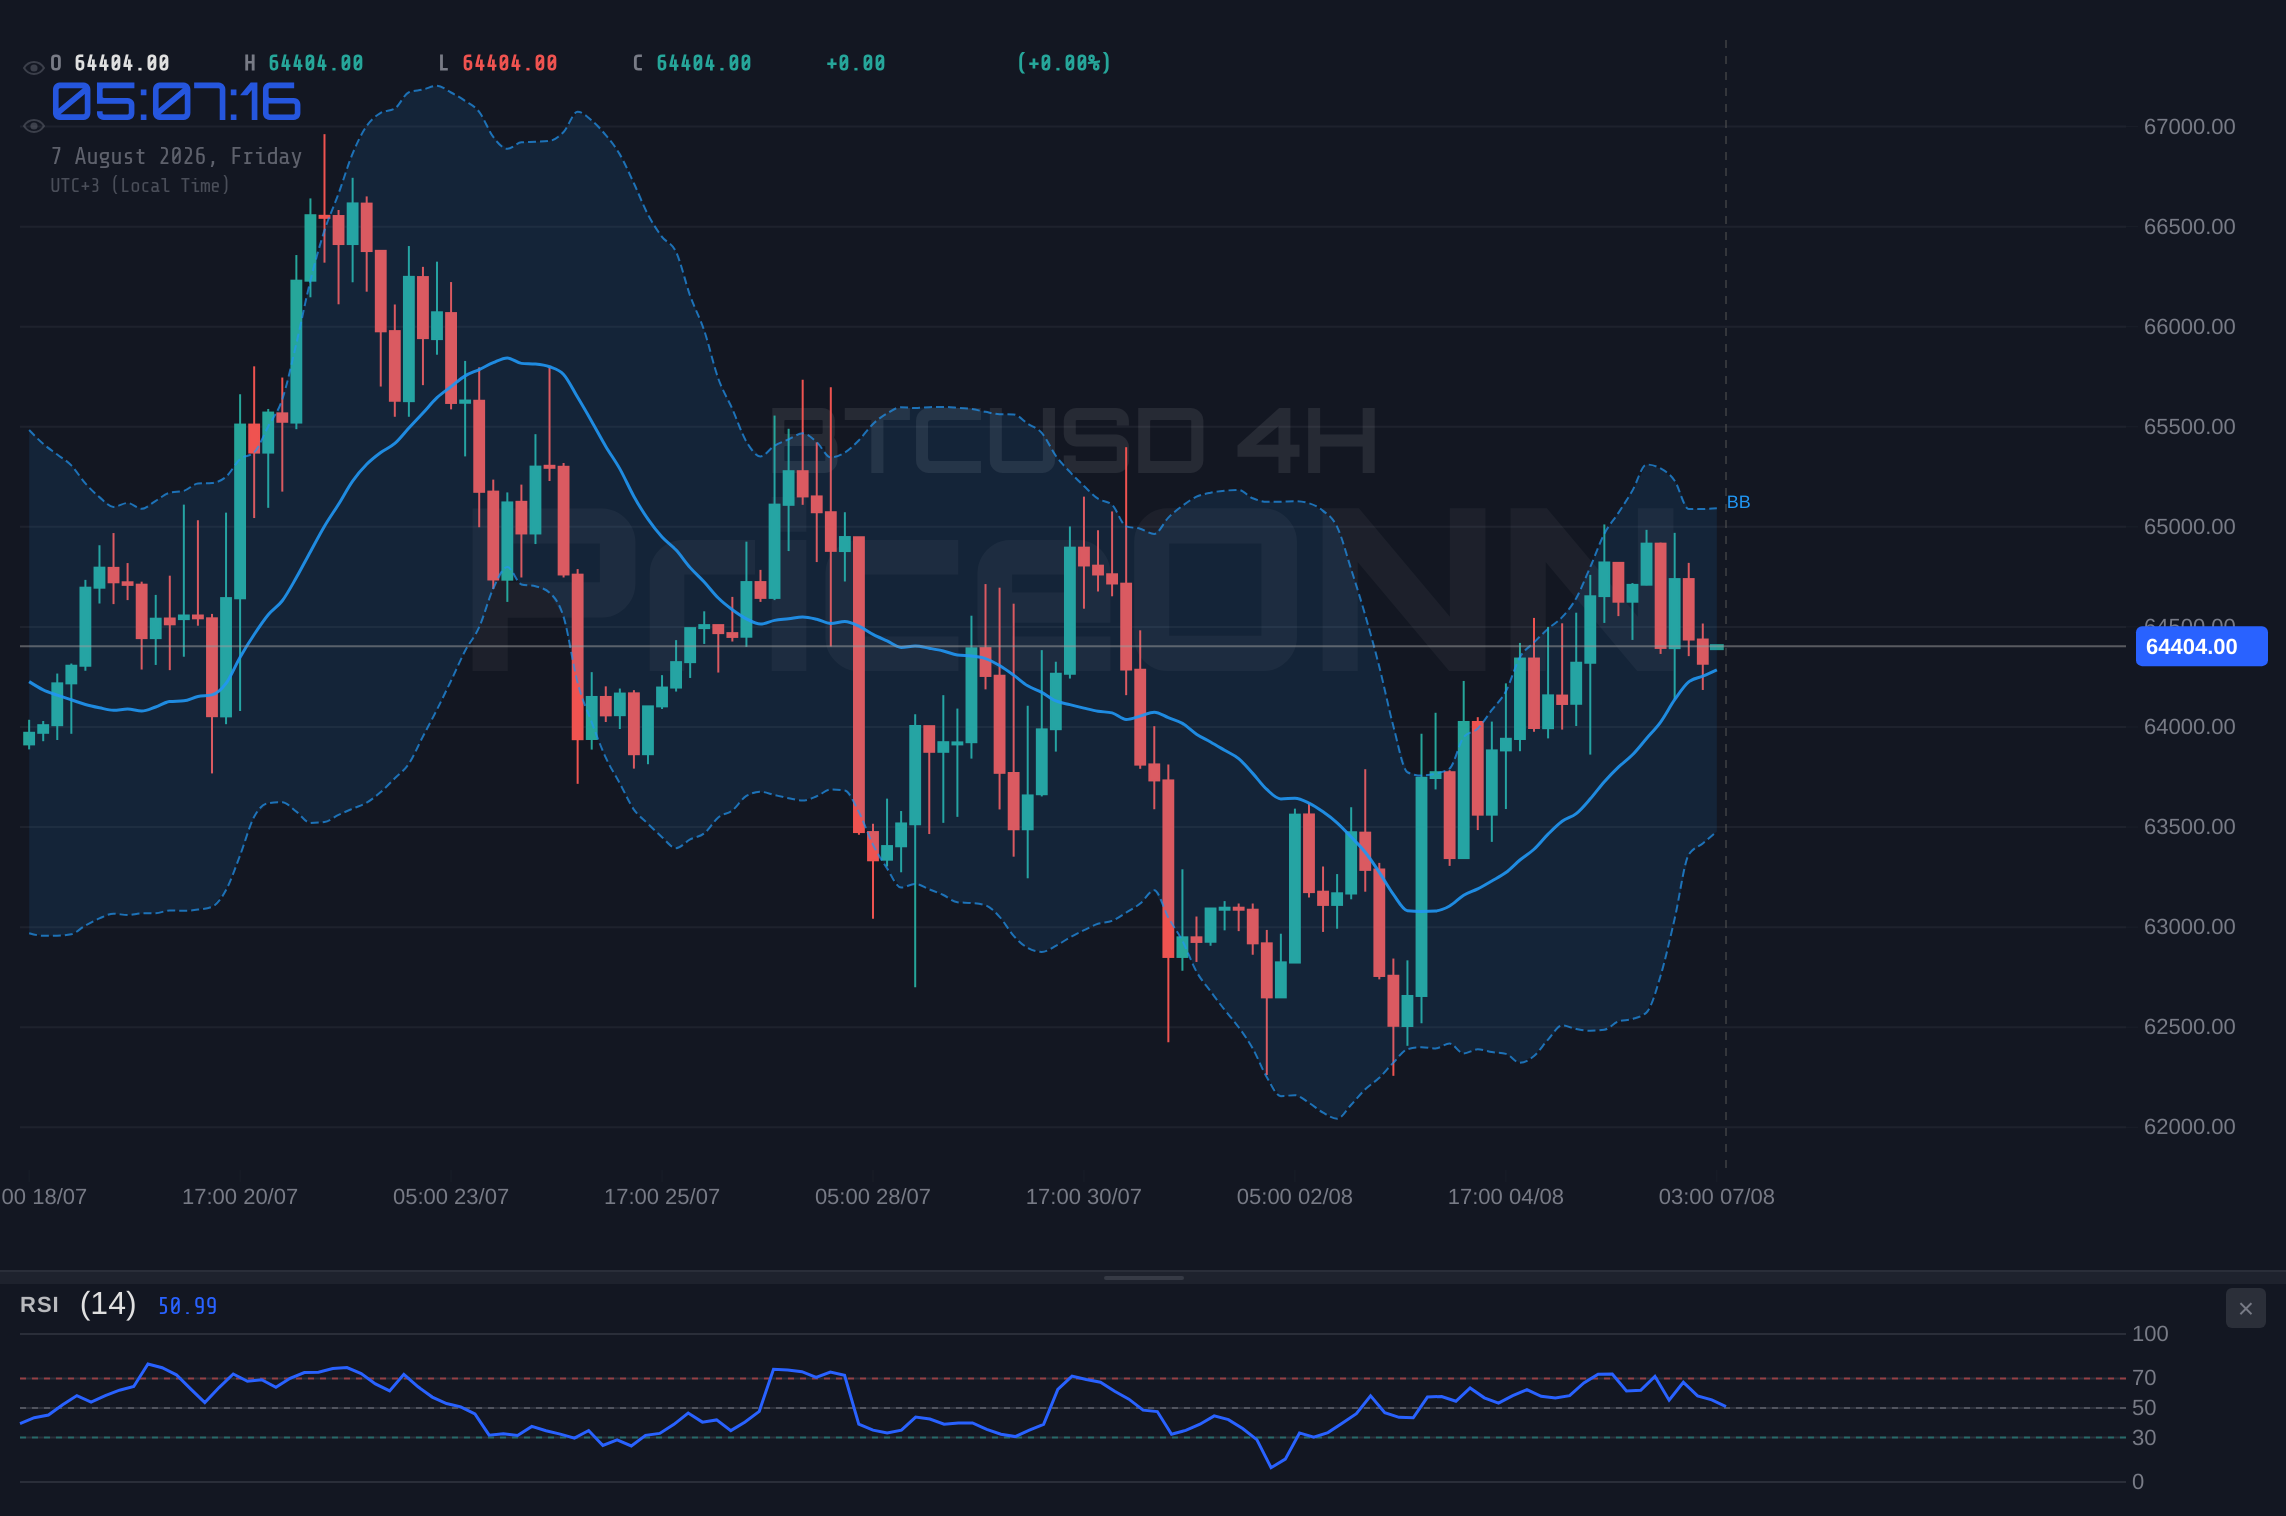
Despite the bearish leanings on the 1-hour timeframe, the 4-hour chart offers a slightly more optimistic, albeit still neutral, perspective. Here, the trend is also neutral, but the ADX strengthens to 18.39, indicating a slightly more defined, though still weak, trend. The RSI at 53.73 hovers just above the midpoint, suggesting a slight bullish inclination, while the MACD is positive, trading above its signal line. This creates a conflicting signal landscape. The Stochastic K line at 57.97 is above the D line at 69.19, which usually suggests a bullish move, but it's important to note that the D line is higher, which can sometimes indicate a potential reversal or consolidation. This divergence highlights the indecision in the market. For now, immediate resistance is seen at $64,720, with $65,003 and $65,186 acting as further upside hurdles. A sustained move above these levels on increased volume would be necessary to challenge the daily chart's more bullish outlook.
Daily Chart: A Glimmer of Hope?
Looking at the daily timeframe, the picture shifts towards a more constructive outlook, despite the short-term bearish signals. The trend is classified as bullish with a strong conviction of 87%, a significant contrast to the shorter timeframes. The RSI at 51.65 sits comfortably in the neutral zone, indicating room for both upward and downward movement without being overextended. The MACD, while showing negative momentum currently, is still above its signal line, suggesting that any recent bearish momentum might be short-lived. However, the Bollinger Bands are currently below the middle band, indicating a bearish bias on this timeframe, and the Stochastic is showing a strong bullish signal with K at 70.05 and D at 42.12. This conflict between the MACD and Stochastic on the daily chart, coupled with the Bollinger Band position, suggests that while the overarching trend might be bullish, the immediate path is likely to be choppy. The key levels to watch on the daily chart are significant: support lies at $64,118.67, $63,415.33, and $62,968.67, while resistance is eyed at $65,268.67, $65,715.33, and the more significant $66,418.67.
Navigating the Macroeconomic Crosscurrents
The broader macroeconomic environment continues to cast a long shadow over Bitcoin's price action. The US Dollar Index (DXY) is currently trading at 99.98, showing a clear upward bias on the 1-hour and 4-hour charts, with strong ADX readings suggesting continued strength. Historically, a strengthening dollar often correlates with pressure on risk assets like Bitcoin, as it increases the cost of dollar-denominated assets for holders of other currencies and can signal a flight to safety. The DXY's current position, just shy of the psychologically important 100 level, adds a layer of caution. If the dollar continues its ascent, it could further dampen sentiment for BTCUSD, especially if it coincides with broader risk-off sentiment in global equity markets.
Equity markets present a mixed bag. The S&P 500 is showing a bullish trend on the 1-hour and 4-hour charts, trading at 6572.87, with strong ADX readings. However, the daily chart paints a different picture, indicating a bearish trend with significant selling pressure and an RSI below 50. This divergence suggests that while short-term sentiment in equities might be positive, the longer-term outlook is less certain. Similarly, the Nasdaq 100, currently at 29426.31, shows conflicting signals across timeframes, with a bearish trend on the 1-hour chart but a more neutral to bullish stance on the 4-hour and daily charts. This indecision in major stock indices could translate into volatility for Bitcoin, as it often moves in correlation with tech-heavy indices, especially during periods of uncertainty. The Dow Jones Industrial Average (53807.5) is showing a strongly bearish 1-hour trend, contrasting with a bullish daily trend, further highlighting the fragmented market sentiment.
Geopolitical tensions, particularly the ongoing crisis in the Strait of Hormuz, continue to influence energy markets and overall risk appetite. Brent crude is trading significantly higher at $82.28, up 4.68% on the day, indicating strong upward momentum and potential inflationary pressures. WTI crude oil also shows a similar bullish surge, trading at $79.14. Higher oil prices can feed into inflation concerns, which in turn can influence central bank policy decisions. If inflation continues to be perceived as a persistent threat, it might delay anticipated interest rate cuts, potentially impacting risk assets like Bitcoin. The strong upward move in oil prices, while potentially signaling economic activity, also carries the risk of further global economic strain if supply disruptions persist.
The Jobs Data Dilemma
The upcoming release of US employment data is arguably the most significant event on the horizon for financial markets, including Bitcoin. Traders are dissecting every available clue, from the ADP employment report to the broader Non-Farm Payrolls (NFP) figures, to gauge the health of the US labor market and, by extension, the Federal Reserve's likely policy path. Stronger-than-expected jobs data could reinforce the narrative of a resilient US economy, potentially leading to a delayed or more hawkish stance from the Fed. This would likely strengthen the DXY and put downward pressure on risk assets like BTCUSD. Conversely, weaker-than-expected data could fuel speculation of earlier interest rate cuts, potentially boosting appetite for riskier assets and providing a tailwind for Bitcoin. The current consolidation in BTCUSD suggests that the market is pricing in a degree of uncertainty, making the jobs report a critical potential catalyst for a directional move.
Conflicting Signals Require Patience: The divergence between shorter-term bearish indicators (1H RSI, MACD) and the longer-term bullish trend (1D) on BTCUSD necessitates a cautious approach. Do not chase moves without confirmation. Wait for a clear break of key levels ($64,034.67 support or $64,985 resistance) on significant volume.
On-Chain Metrics: A Deeper Dive
Beyond the price charts and macroeconomic headlines, the on-chain data for Bitcoin offers a more granular perspective on network health and investor behavior. While specific real-time on-chain data is not provided in the market context, general trends offer valuable insights. A healthy number of active addresses, for instance, would suggest robust network usage and organic demand. Conversely, declining active addresses, even with a stable or rising price, could indicate a lack of genuine user engagement. Whale movements - large holders accumulating or distributing - are also critical to monitor. Significant outflows from exchanges to cold storage wallets are typically seen as a bullish sign, indicating long-term holding conviction. Inflows, however, might signal an intention to sell. Exchange flows are a crucial barometer of immediate selling pressure versus hodler conviction. The hash rate, a measure of the network's security and processing power, has been generally trending upwards over the long term, indicating network health and miner confidence, which is a foundational bullish factor for Bitcoin.
The current market structure, characterized by consolidation around the $64,410 level, could be interpreted in several ways from an on-chain perspective. It might represent a period of accumulation by savvy investors who see current levels as attractive before a potential upward move. Alternatively, it could be a distribution phase, where larger holders are slowly offloading their positions without triggering a sharp sell-off. The lack of significant on-chain selling pressure, such as large spikes in exchange inflows or a noticeable drop in active addresses, would lend more credence to the accumulation thesis. However, without real-time on-chain data, this remains speculative. The focus, therefore, shifts back to price action and external catalysts.
Trade Scenarios: What Lies Ahead?
Given the current indecision and the confluence of conflicting signals across different timeframes, a cautious approach to trading BTCUSD is warranted. The market is essentially waiting for a catalyst, and the upcoming US jobs report is the most likely candidate to provide it. Until then, expect volatility within the defined ranges.
Bearish Breakdown: The Path Below $64K
65% ProbabilityConsolidation Continues: The $64K Stalemate
25% ProbabilityBullish Breakout: Igniting the Rally
10% ProbabilityThe probabilities assigned reflect the current technical picture: the short-term indicators lean bearish, while the longer-term daily trend shows resilience but faces immediate resistance and conflicting signals. The jobs data is the wild card that could significantly shift these probabilities.
The current market environment for BTCUSD is a study in contrasts. Short-term indicators suggest caution, even a potential downturn, with the 1-hour chart showing negative momentum and key support levels within striking distance. However, the daily trend remains bullishly inclined, albeit with significant internal conflicts and resistance overhead. The overarching macroeconomic narrative, particularly the strength of the US dollar and the anticipation surrounding US employment figures, adds another layer of complexity. A surprisingly weak jobs report could ignite a risk-on rally, potentially propelling Bitcoin higher towards its daily resistance levels. Conversely, a strong report could reinforce the dollar's strength and usher in a period of risk aversion, leading BTCUSD to test its immediate support levels. Traders must remain vigilant, manage risk diligently, and wait for clear signals rather than trying to anticipate them in this uncertain landscape. The $64,410 level is currently a battleground, and the outcome of the upcoming economic data will likely dictate the next significant price movement.
| Indicator | Value | Signal | Interpretation |
|---|---|---|---|
| RSI (14) | 46.41 | Bearish | 46.41 suggests potential downside momentum on 1H, while 51.65 on 1D indicates neutral territory. |
| MACD Histogram | -0.64 | Bearish | Negative momentum on 1H and 1D signals selling pressure is currently dominant. |
| Stochastic | K:24.34, D:25.79 | Bearish | 24.34/%25.79 on 1H indicates oversold conditions potentially leading to a bounce, but momentum is still down. |
| ADX | 13.87 | Neutral | A low ADX of 13.87 on 1H indicates a weak trend, suggesting consolidation or a potential breakout is imminent. |
| Bollinger Bands | Middle Band | Bearish | Price is below the middle band on 1H and 1D, indicating potential downside pressure. |
Frequently Asked Questions: BTCUSD Analysis
What happens if BTCUSD breaks below $64,034.67 support amidst DXY strength?
A break below $64,034.67, especially if accompanied by a rising DXY (currently at 99.98), would likely trigger further downside for BTCUSD. This scenario could see price targets retested around $63,788 and potentially $62,968.67 on the daily chart.
Should I consider buying BTCUSD at current levels around $64,410 given the mixed signals?
Caution is advised. While the 1D trend is bullish, the 1H chart shows bearish momentum. A low probability (10%) bullish scenario requires a daily close above $65,268.67. It's prudent to wait for confirmation or a clearer setup, rather than chasing current levels.
Is the RSI at 46.41 on the 1-hour chart a sell signal for BTCUSD right now?
An RSI of 46.41 on the 1-hour chart indicates bearish momentum but is not yet in oversold territory. It suggests selling pressure is present, aligning with the negative MACD momentum on this timeframe, but it doesn't guarantee a sharp decline without further confirmation.
How will the upcoming US jobs report affect BTCUSD this week?
Stronger-than-expected jobs data could strengthen the DXY and lead to risk aversion, potentially pushing BTCUSD lower towards its support levels. Conversely, weak data might fuel rate cut expectations, boosting Bitcoin and pushing it towards resistance levels around $65,268.67.
Track markets in real-time
AI-powered analysis, technical indicators and real-time price data.
Join Our Telegram Channel
Breaking market news, AI analysis and trading signals instantly.
Join Channel