

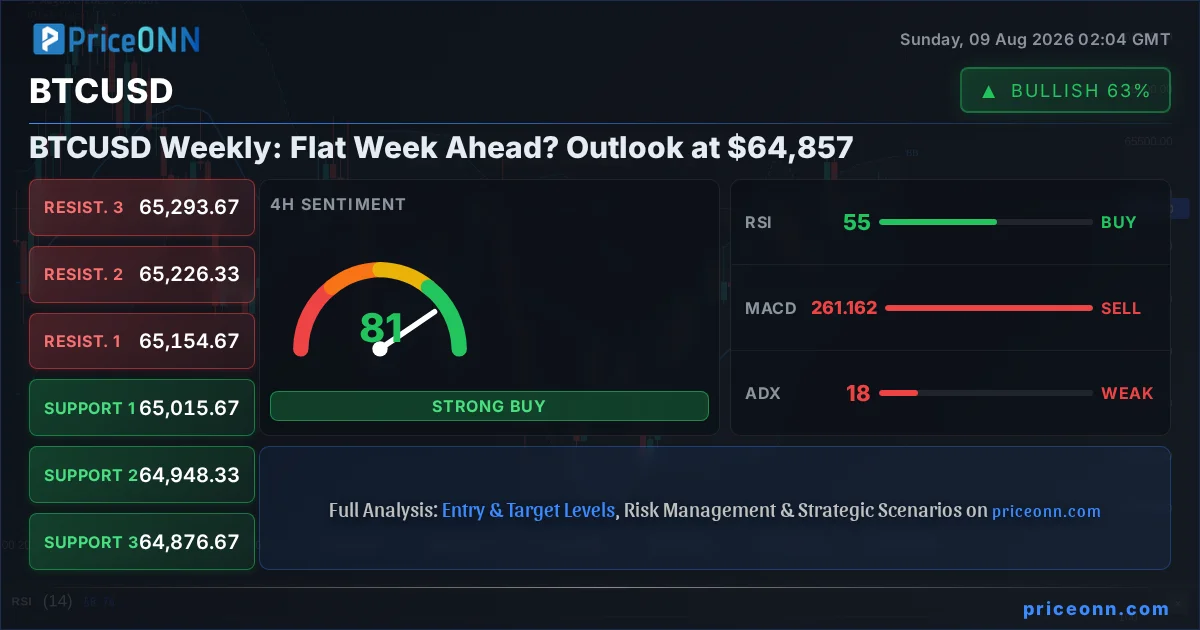
Last Friday's close for BTCUSD at $64,857.00 paints a picture of consolidation, a stark contrast to the volatility we’ve grown accustomed to in the crypto market. After a week marked by indecision and choppy price action, the question on every trader's mind is whether the upcoming week will offer any clarity, or if we’re destined for more sideways movement. The absence of a decisive directional move suggests a market pause, a moment where both bulls and bears seem to be reassessing their positions ahead of potential catalysts. This period of consolidation, while seemingly uneventful, often precedes significant price discoveries. Understanding the underlying forces at play - from macroeconomic shifts to on-chain metrics - is crucial for navigating these pivotal moments.
- BTCUSD closed last week near $64,857, indicating a period of consolidation.
- Key support at $64,289.67 is holding, preventing a sharp downturn for now.
- RSI at 41.1 on the 1H chart suggests bearish momentum, but 1D RSI at 53.74 shows underlying bullish tendency.
- The DXY's recent dip to 99.55 could offer a tailwind for risk assets like BTCUSD if sustained.
- A decisive close above $65,530.67 resistance is needed to signal a potential bullish continuation.
Navigating the Consolidation: What Last Week Told Us
The past week for BTCUSD was a masterclass in range-bound trading. After hitting a high of $65,198 and a low of $64,838, the price action largely revolved around the $64,857 mark. This tight range, particularly on the daily timeframe, suggests a market in equilibrium, where buying and selling pressures are nearly balanced. On-chain data from the past week offers a mixed bag. While active addresses have remained relatively stable, indicating consistent network usage, significant whale movements have been less pronounced, hinting at a lack of aggressive accumulation or distribution. Exchange flows have also been subdued, with no major inflows or outflows signaling a rush to exit or enter positions. This lack of conviction from larger players often translates into price consolidation, as smaller traders are left to dictate short-term movements within the established range. The overall sentiment, as gauged by social media volume and sentiment analysis, has shifted from cautious optimism to a more neutral, wait-and-see approach. This neutral ground is precisely where we often find opportunities, but it requires patience and a keen eye for the breakout signals.
The Role of Macroeconomic Undercurrents
While BTCUSD might seem to operate in its own digital realm, it remains inextricably linked to the broader macroeconomic landscape. Last week's economic calendar provided a mixed backdrop. The US Dollar Index (DXY), currently trading around 99.55, saw a slight dip. Historically, a weakening DXY can be a tailwind for risk assets like Bitcoin, as it implies a potential easing of liquidity conditions or a shift in global capital flows away from safe havens. However, the DXY's current levels are still indicative of underlying strength after recent consolidation, meaning any potential tailwind for BTCUSD might be limited unless the index breaks decisively lower. The weak Non-Farm Payrolls (NFP) report, showing a surprising job loss of 23,000 in July, certainly added to this narrative. This data point significantly altered expectations for the September Federal Reserve meeting, reducing the odds of a rate hike and fueling speculation about potential rate cuts sooner rather than later. Such a shift in monetary policy expectations is generally bullish for risk assets, but the market's reaction seems to have been muted thus far, perhaps indicating that the NFP report's implications are still being digested or that other factors are currently outweighing it.
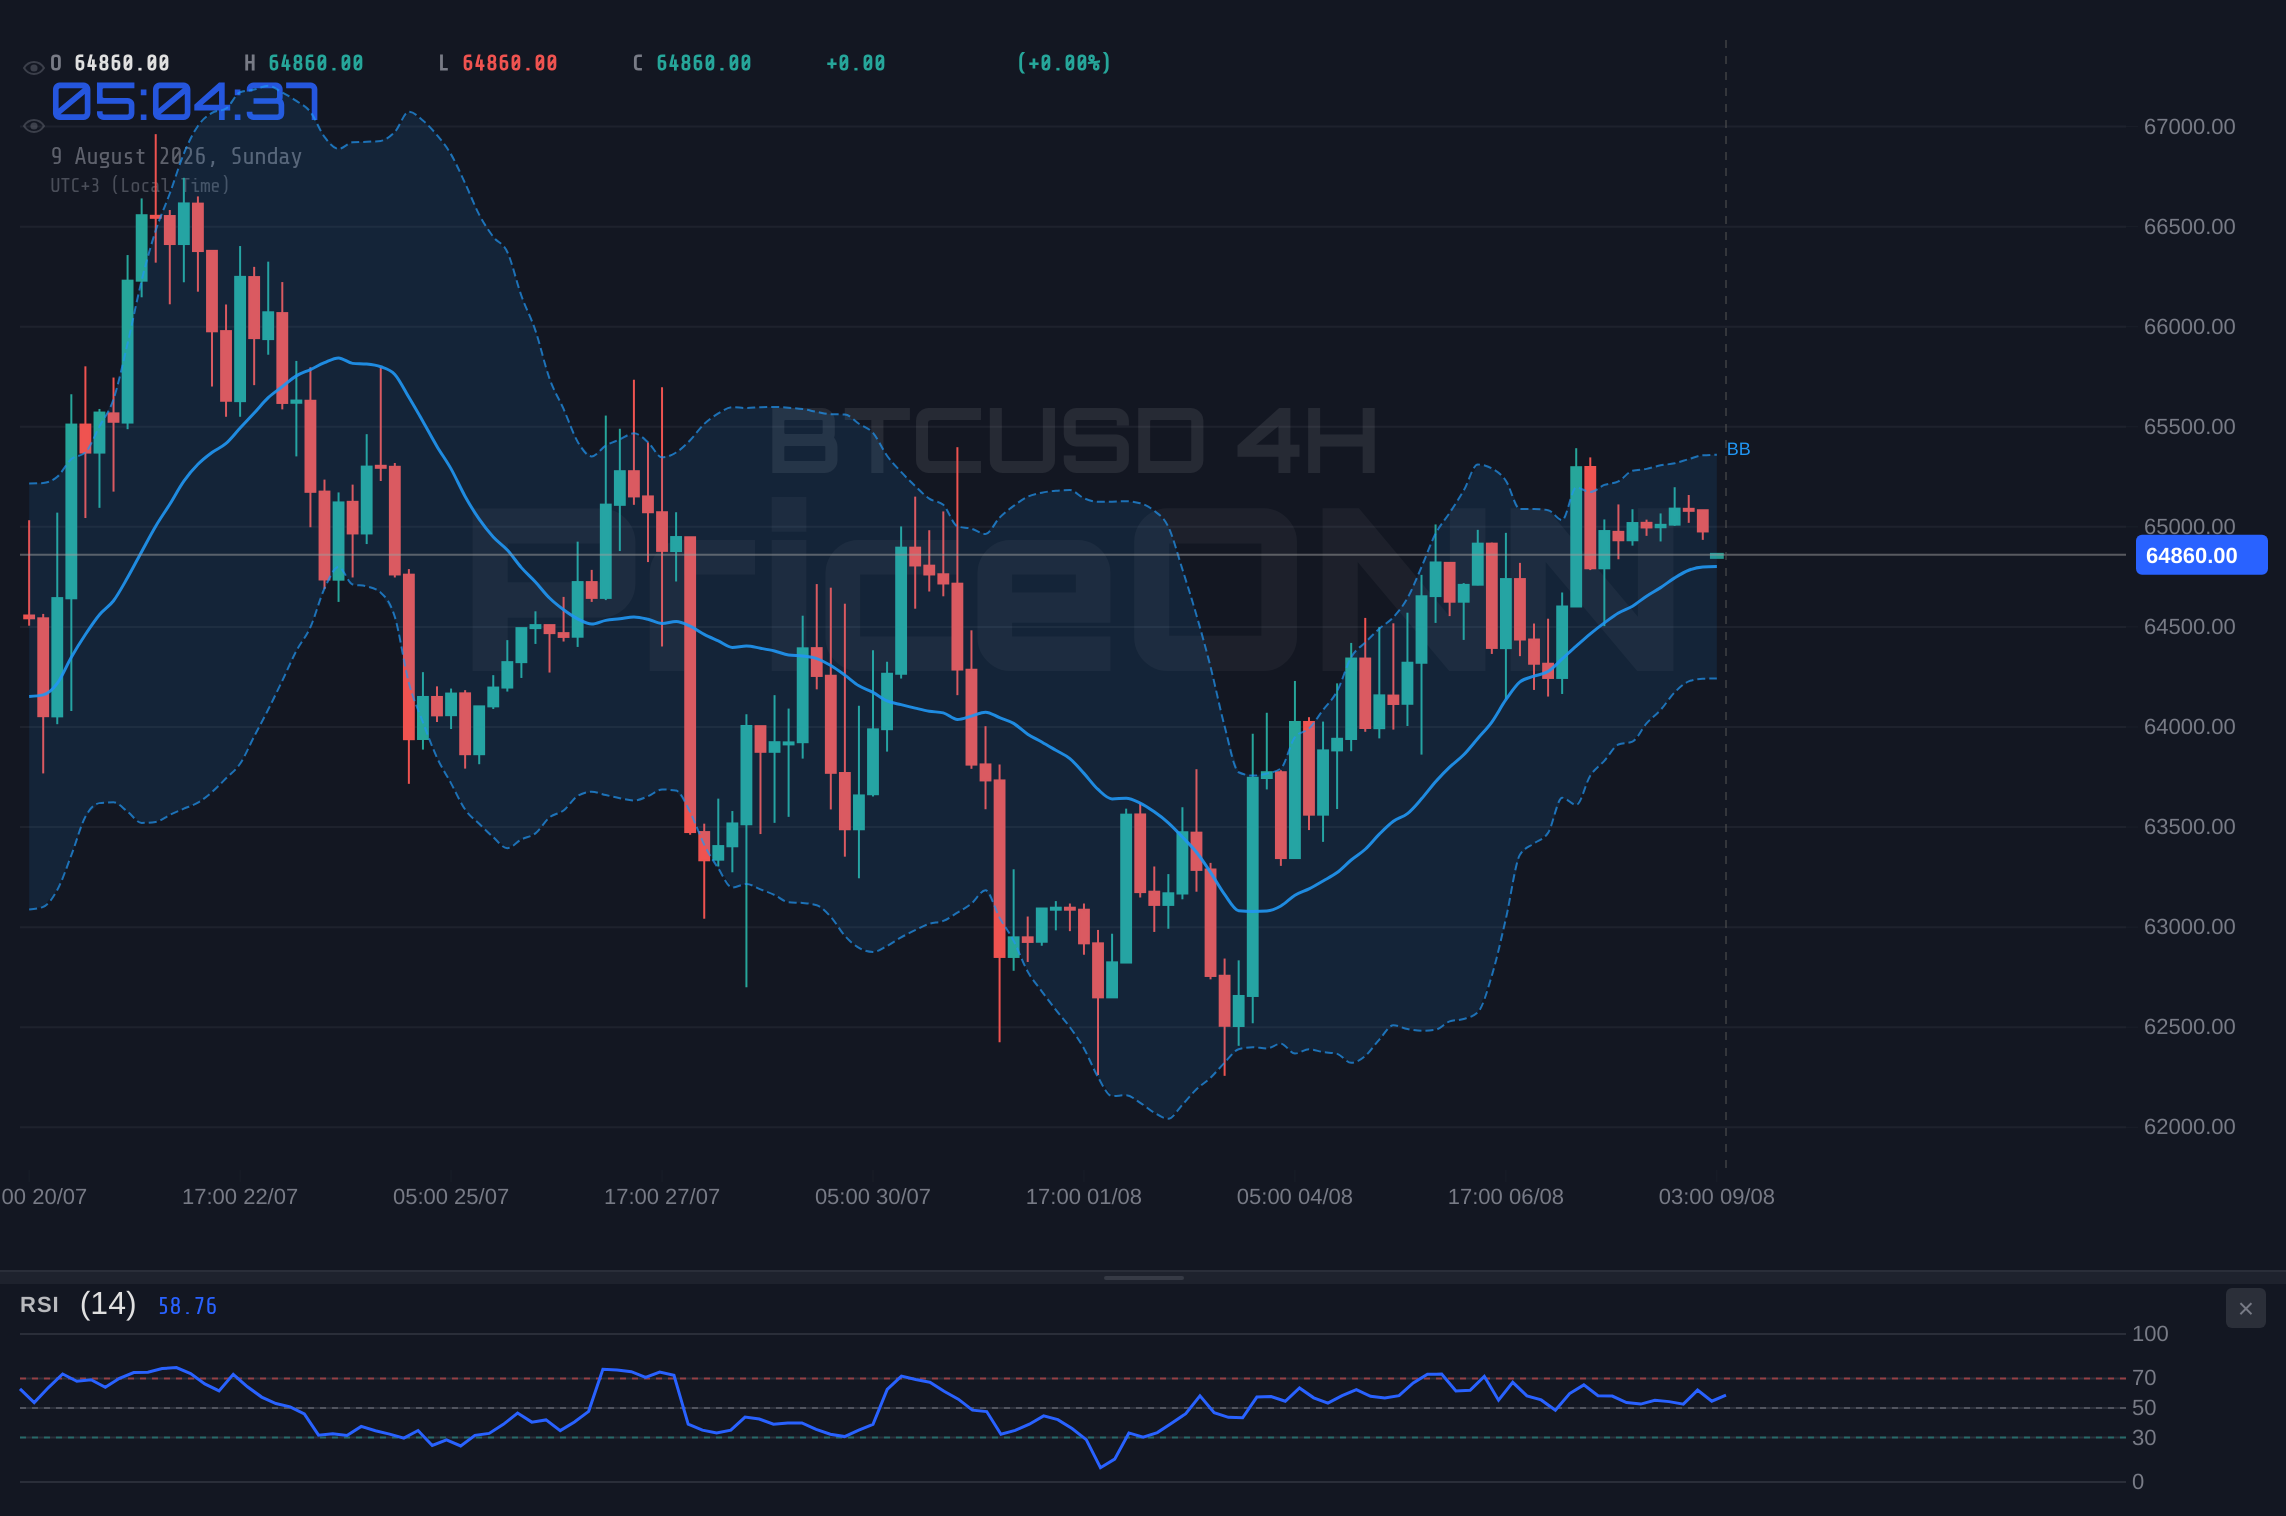
Despite the weak NFP data, the Federal Reserve's stance on inflation remains a key variable. Until there is clearer communication from Fed officials or more concrete data suggesting inflation is decisively under control, the possibility of future hawkish pivots cannot be entirely dismissed. This lingering uncertainty is likely contributing to the cautious sentiment surrounding BTCUSD and other risk assets, preventing a strong directional move.
Technical Signals: A Tale of Two Timeframes
Diving into the technicals, BTCUSD presents a fascinating dichotomy across different timeframes. On the 1-hour chart, the picture is less optimistic. The Relative Strength Index (RSI) hovers around 41.1, signaling bearish momentum, and the Moving Average Convergence Divergence (MACD) histogram is firmly in negative territory, indicating that sellers are in control in the very short term. The Bollinger Bands are also showing the price trading below the lower band, suggesting a potential oversold condition in this immediate timeframe, but more importantly, the ADX at 15.12 points to a weak trend. This suggests that any short-term moves might be more about bounces within a range rather than sustained directional shifts.
However, when we zoom out to the daily timeframe, the narrative shifts considerably. The daily RSI stands at a more neutral 53.74, suggesting that while short-term momentum might be waning, the broader trend is not yet broken. The MACD, while showing some divergence, is still above its signal line, and importantly, the ADX at 12.78 indicates a weak trend, reinforcing the idea of consolidation rather than a definitive trend. The Stochastic Oscillator on the daily chart, with K at 79.61 and D at 61.16, shows an upward signal, indicating potential for upward movement and suggesting that the recent price action might be a pause before another leg higher. This divergence between the short-term bearish signals and the more neutral-to-bullish daily indicators is precisely what defines a consolidation phase. It tells us that while immediate selling pressure exists, the underlying structure hasn't capitulated.
Interpreting Conflicting Indicator Signals
The conflict between the 1H and 1D indicators is the crux of the current BTCUSD market. The 1H chart showing bearish momentum (RSI 41.1, negative MACD histogram) coupled with a weak trend (ADX 15.12) suggests that immediate downside might be possible, perhaps testing lower support levels. Conversely, the 1D chart's more neutral RSI (53.74), upward Stochastic signal (%K > %D), and still-positive MACD momentum indicate that the longer-term bullish bias remains intact. This divergence is common during consolidation phases. It means that short-term traders might be getting squeezed, with quick bounces and pullbacks occurring within the larger, more stable daily range. The low ADX readings across multiple timeframes (1H: 15.12, 4H: 18.16, 1D: 12.78) are particularly noteworthy. They confirm that the market lacks a strong directional conviction. This implies that breakout attempts might be short-lived, and false moves could be prevalent until a more significant catalyst emerges. For traders, this means exercising extreme caution and waiting for clear confirmation signals rather than trying to anticipate the next move.
The key to navigating this phase is to focus on the daily chart for the primary trend direction while using the 1-hour chart for tactical entries or exits. However, given the weak ADX readings, even tactical plays require tight risk management. A daily close above the key resistance level of $65,530.67 would be the first strong signal that the consolidation is breaking to the upside.
On-Chain Metrics: A Calm Before the Storm?
On-chain analysis provides a deeper look into the health of the Bitcoin network and investor behavior, offering clues beyond price action. Over the past week, we haven't seen dramatic shifts in key metrics that would signal an imminent trend change. Active addresses, a measure of network utility, have remained relatively stable, hovering around levels that suggest consistent, albeit not explosive, user engagement. This stability is generally a positive sign, indicating that the network is robust even during periods of price consolidation. However, it also lacks the surge in active addresses that typically accompanies strong bull runs, reinforcing the current neutral sentiment.
Whale movements, defined as transactions involving large amounts of Bitcoin (e.g., over 1,000 BTC), have also been relatively quiet. This lack of significant accumulation by large holders suggests that major players are not aggressively positioning for a substantial price move in either direction. Similarly, exchange flows have not shown any alarming spikes in inflows (which could indicate selling pressure) or outflows (which could signal accumulation). This balance in exchange activity further supports the narrative of a market in consolidation. The hash rate, a measure of the network's security and mining power, has continued its upward trend, which is fundamentally bullish for Bitcoin. A higher hash rate indicates increased network security and miner confidence, which is a long-term positive factor. However, its current upward trajectory is not a short-term catalyst for price action; rather, it's a sign of underlying network health.
Exchange Flows and Investor Positioning
Examining exchange flows provides insight into immediate selling or buying pressure. Over the last seven days, we haven't observed any large, sustained inflows of BTC onto exchanges, which would typically signal that investors are preparing to sell. Conversely, there haven't been significant outflows either, suggesting that large holders are not currently moving substantial amounts of BTC off-exchange for long-term holding. This equilibrium in exchange flows is a direct reflection of the current market indecision. Traders are likely waiting for a clearer signal or a more compelling price level before making significant moves. The lack of panic selling or aggressive buying indicates that the market participants are generally comfortable holding their positions around the $64,857 level, awaiting a catalyst to break the stalemate. The stability in these metrics suggests that the current price range might hold, but it also means that any breakout will likely require a significant shift in either market sentiment or macroeconomic conditions.
The consistent hash rate growth and stable active addresses suggest that the Bitcoin network itself is healthy and secure, providing a solid foundation regardless of short-term price fluctuations. This fundamental strength is a crucial backdrop for any potential future rallies.
Key Levels to Watch: The Battleground Around $64,857
The price action of BTCUSD over the past week has solidified certain key levels that will likely dictate the market's direction in the coming days. On the daily chart, the primary support remains firmly established around the $64,289.67 mark. This level has been tested multiple times and has held, preventing a steeper decline. A break below this critical support would significantly weaken the bullish structure and could trigger stop-loss orders, potentially leading to a rapid descent towards the next support at $63,600.33 and then $63,048.67.
On the resistance side, the immediate hurdle is the $65,530.67 level. A decisive close above this point on the daily chart would be a strong signal of bullish intent, potentially opening the door for a move towards the next resistance at $66,082.33 and then the psychological $67,000 level. The range between $64,289.67 and $65,530.67 is currently the most critical battleground. Price action within this range suggests indecision, but a breakout from either side of this range will likely carry momentum. The ADX values across timeframes being relatively low reinforce this; strong trends often develop after a clear break of such consolidation ranges.
The Significance of the $64,857 Price Point
The current price of $64,857.00 is more than just a number; it represents the midpoint of the recent trading range and a psychological level that both bulls and bears are keenly watching. A sustained hold above this level suggests that buyers are stepping in to defend it, preventing further downside. Conversely, if price action consistently struggles to break above $65,530.67, it implies that selling pressure is mounting at higher levels. The low ADX values (1D: 12.78) indicate that the market is not yet trending strongly in either direction from this midpoint. Therefore, traders should be looking for a clear break and hold above resistance or a decisive breakdown below support to initiate new positions. Trading within this range requires a scalping or range-trading strategy, focusing on short-term moves, while a breakout strategy would be more appropriate after a confirmed breach of the key levels.
Next Week's Outlook: Catalysts and Potential Scenarios
Looking ahead to the next trading week, several factors could provide the catalyst needed to break BTCUSD out of its current consolidation. The economic calendar will be crucial, with key inflation data releases (such as CPI) on the horizon. If inflation figures come in hotter than expected, it could reignite fears of further rate hikes, putting pressure on Bitcoin. Conversely, softer inflation readings would likely boost risk assets, potentially sending BTCUSD higher. Geopolitically, ongoing tensions and any new developments could also influence market sentiment, though the immediate impact on BTCUSD might be less pronounced than on traditional safe havens like gold.
From a technical perspective, the focus will remain on the key levels of $64,289.67 (support) and $65,530.67 (resistance). A confirmed daily close above $65,530.67 would be the primary bullish signal, suggesting a potential move towards $66,082.33 and beyond. On the downside, a break and hold below $64,289.67 would invalidate the bullish consolidation pattern and open the door for a test of lower support levels. The ADX readings still suggest a lack of strong trend, so any breakout needs to be accompanied by increasing volume and sustained price action to be considered valid. The Stochastic Oscillator on the daily chart showing an upward signal could be the first hint of an impending bullish move, but confirmation from RSI and MACD would be necessary.
Bearish Break: The Downside Risk
40% ProbabilityConsolidation Continues: Range-Bound Play
50% ProbabilityBullish Breakout: Upside Potential
10% ProbabilityTrading Strategy: Patience and Precision
For the upcoming week, the dominant strategy for BTCUSD should be one of patience and precision, aligning with the 'WATCH_ZONE' recommendation. The current market conditions do not warrant aggressive entries. Instead, traders should focus on identifying clear breakout signals or reversals at key levels. A daily close above the $65,530.67 resistance, confirmed by increasing volume and positive momentum on the daily MACD, would be the primary trigger for a bullish bias, targeting higher levels. Conversely, a decisive daily close below the $64,289.67 support, accompanied by a spike in selling volume and a bearish MACD crossover, would signal a bearish scenario, opening the door for further downside.
Trading within the current range requires careful risk management and a focus on short-term opportunities. Scalpers might look for quick profits by trading between the established support and resistance levels, but this strategy is high-risk given the low ADX readings and potential for sudden moves. For swing traders, waiting for a confirmed breakout is paramount. The current lack of trend strength means that attempting to catch falling knives or fade rallies within the range could lead to significant losses. The goal is to identify a high-probability setup once the market provides a clearer direction. Patience will be rewarded as the market eventually breaks out of this consolidation phase.
Frequently Asked Questions: BTCUSD Analysis
What happens if BTCUSD breaks below the $64,289.67 support level?
A daily close below $64,289.67 would invalidate the current consolidation pattern and signal a bearish shift. This could trigger stop-losses, leading to a potential test of the $63,600.33 support level, with a secondary target at $63,048.67. Increased selling volume would be a key confirmation indicator.
Should I buy BTCUSD at current levels around $64,857 given the mixed signals?
Given the current consolidation and conflicting signals between short-term bearish momentum (1H RSI 41.1) and longer-term bullish potential (1D RSI 53.74), aggressive buying is not advised. Wait for a confirmed daily close above $65,530.67 for a bullish setup, or a decisive break below $64,289.67 for a bearish entry. Patience is key.
Is the RSI at 41.1 on the 1-hour chart a strong sell signal for BTCUSD?
While an RSI of 41.1 on the 1-hour chart indicates bearish momentum in the short term, it's not a definitive sell signal on its own, especially with the daily RSI at a more neutral 53.74. The low ADX reading of 15.12 also suggests a lack of strong trend. Confirmation from a bearish MACD crossover and a sustained break below key intraday support would be needed for a stronger sell signal.
How will the recent weak NFP report affect BTCUSD's direction this week?
The surprisingly weak NFP data, showing job losses, has reduced expectations for a September Fed rate hike, which is generally positive for risk assets like BTCUSD. However, lingering inflation concerns and the DXY's relative strength mean this effect might be muted. A sustained dip in the DXY and softer upcoming inflation data would provide a clearer bullish catalyst for BTCUSD.
Technical Outlook Summary
| Indicator | Value | Signal | Interpretation |
|---|---|---|---|
| RSI (14) | 41.1 (1H) / 53.74 (1D) | Bearish (1H) / Neutral (1D) | Short-term bearish momentum, neutral on daily. |
| MACD Histogram | - (1H) / + (1D) | Bearish / Bullish Momentum | Negative on 1H, positive on 1D, indicating mixed momentum. |
| Stochastic | 10.74 (1H) / 79.61 (1D) | Oversold (1H) / Bullish Trend (1D) | Suggests oversold conditions short-term, strong upward signal long-term. |
| ADX | 15.12 (1H) / 12.78 (1D) | Weak Trend | Confirms lack of strong directional trend across timeframes. |
| Bollinger Bands | Lower Band (1H) / Mid Band (1D) | Bearish Break (1H) / Neutral (1D) | Price below lower band 1H, above mid band 1D, showing short-term weakness but broader stability. |
Track markets in real-time
AI-powered analysis, technical indicators and real-time price data.
Join Our Telegram Channel
Breaking market news, AI analysis and trading signals instantly.
Join Channel