

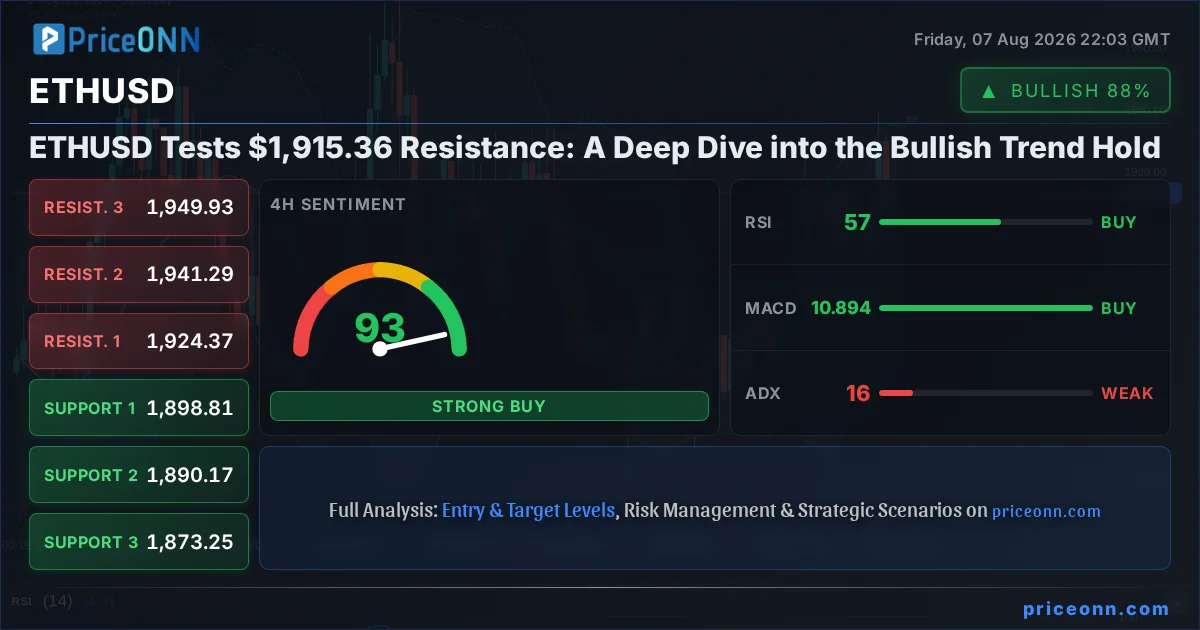
ETHUSD's resilience near the $1,915.36 mark is proving that the recent bullish momentum isn't just a fleeting spark, but a sustained push against significant resistance. As traders eye this critical juncture, the confluence of technical indicators, on-chain activity, and broader market correlations paints a detailed picture of where the second-largest cryptocurrency might be headed. This isn't just about watching price action; it's about understanding the underlying currents that dictate its movement in this dynamic crypto cycle.
- ETHUSD is testing resistance around the $1,915.36 level, with the 1H RSI at 54.77 indicating neutral momentum with a slight upward bias.
- Critical support for ETHUSD sits at $1,904.07, a level that has held firm, preventing a deeper pullback despite short-term bearish MACD signals on the 1H chart.
- The ADX at 24.93 on the 1H timeframe suggests a moderate uptrend is in play, but requires confirmation from other indicators to signify a strong directional move.
- Correlations with the DXY, currently at 99.58 and showing a bearish trend, suggest a potentially supportive environment for risk assets like ETHUSD, although market sentiment remains cautious.
The digital asset space is perpetually in motion, and ETHUSD's current position around $1,915.36 is a prime example of the constant tug-of-war between buyers and sellers. We've seen a notable attempt to push past immediate resistance, a move that, while not yet a decisive breakout, signals underlying strength. The 1-hour chart shows the Relative Strength Index (RSI) at 54.77, a reading that, while not overtly bullish, suggests buyers are still engaged and the bears haven't seized control. This neutral-leaning momentum on the shorter timeframe is crucial; it indicates that the price isn't being aggressively pushed down, leaving room for potential upside continuation.
Now, this is where it gets interesting! The MACD on the 1-hour chart, while showing negative momentum and sitting below its signal line, hasn't triggered a significant sell-off. This divergence between a potentially bearish short-term signal and the price holding firm is something seasoned traders watch closely. It often precedes a shift in momentum. Coupled with the ADX at 24.93, which signifies a moderate uptrend, the technical picture on the hourly chart suggests a cautious optimism. However, this isn't a green light for aggressive buying; it's a signal to monitor for confirmation, particularly as we approach key resistance levels.
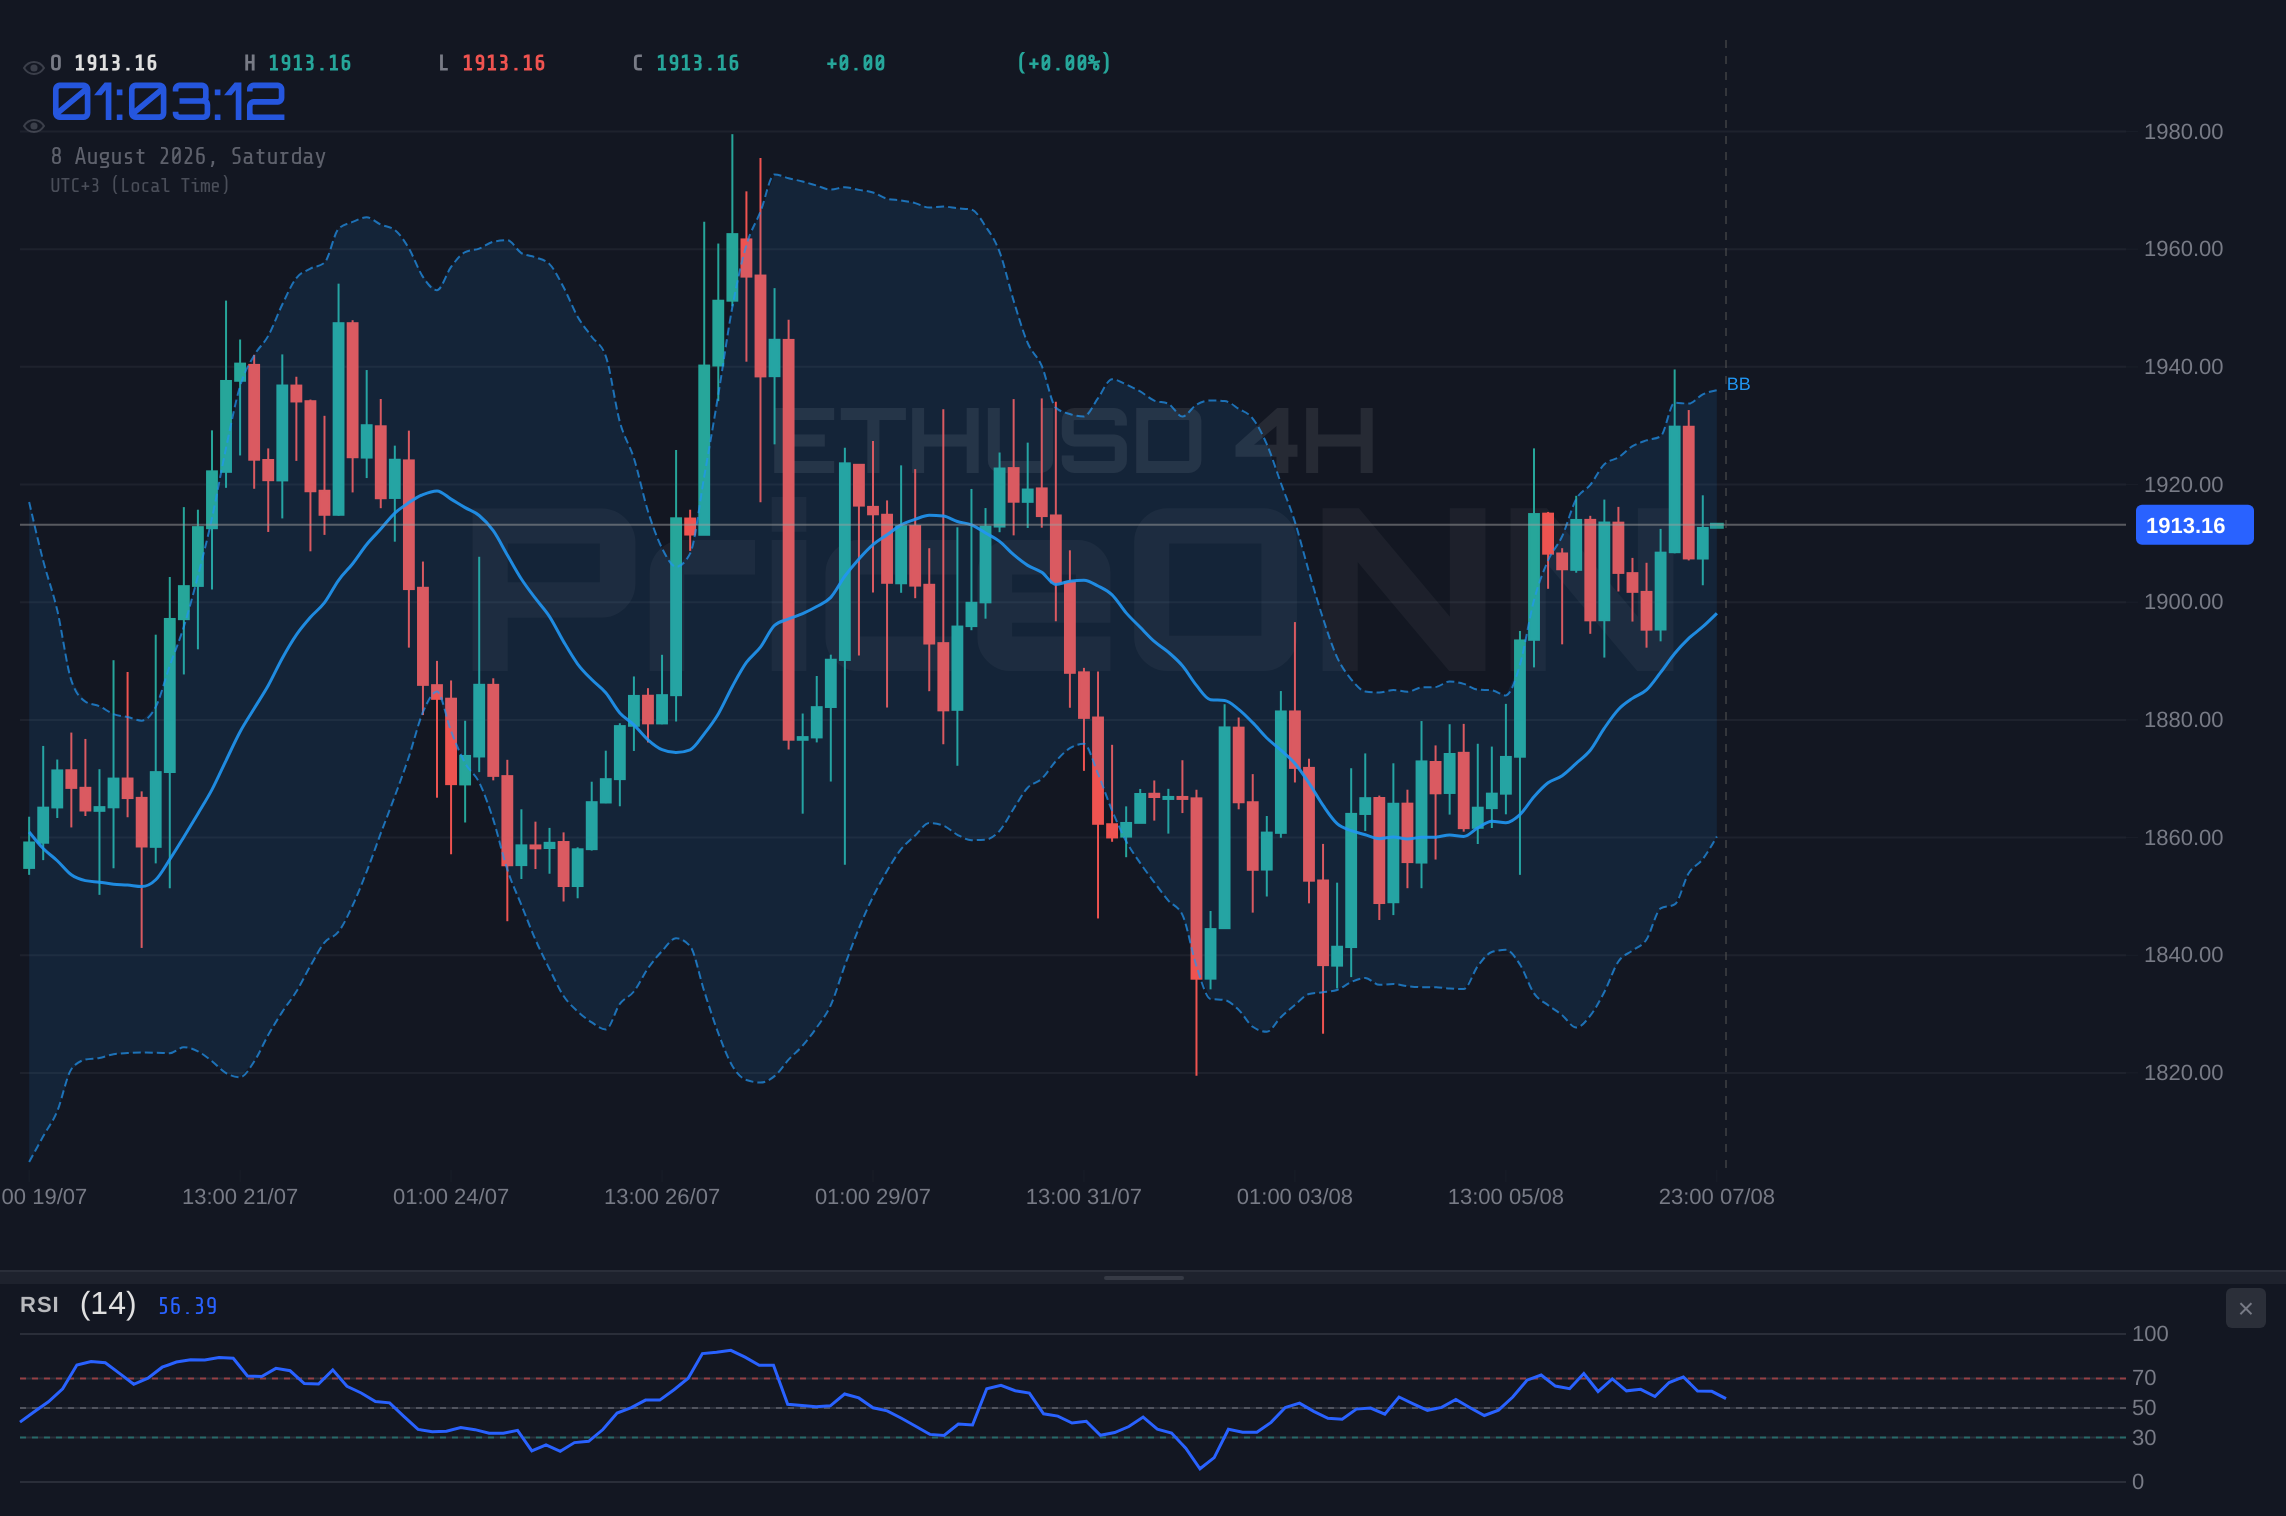
Looking at the 4-hour timeframe, the trend is officially neutral, with a strength score of 50%. This is where the market seems to be consolidating its recent gains, waiting for a clearer catalyst. The RSI here is at 56.89, still comfortably in neutral territory, and importantly, the MACD is showing positive momentum, now above its signal line. This presents a more constructive short-to-medium term outlook compared to the 1-hour chart. The Stochastic oscillator, however, is showing a slight bearish signal (%K
The daily chart for ETHUSD offers a slightly more optimistic view, classifying the trend as 'Bullish' with a strength of 88%. This longer-term perspective is vital for understanding the broader market sentiment. The RSI at 54.27 reinforces the idea of a market that has room to grow, avoiding the overbought conditions that often precede sharp pullbacks. The MACD on the daily is firmly in positive territory, above its signal line, and the ADX, while low at 13.08, indicates that the current uptrend, though potentially slow-moving, is developing. This suggests that any consolidation observed on shorter timeframes might just be a pause before further upward movement.
The Macroeconomic Undercurrents: DXY and Risk Appetite
It's impossible to analyze ETHUSD in isolation. The broader macroeconomic landscape, particularly the performance of the US Dollar Index (DXY) and major equity indices like the S&P 500 and Nasdaq, plays a crucial role. Currently, the DXY is at 99.58, showing a bearish trend on the 1-hour chart and a neutral stance on the 4-hour. This weakness in the dollar is generally a tailwind for risk assets, including cryptocurrencies. When the dollar weakens, it often signifies a decrease in global risk aversion, making assets like ETHUSD more attractive to investors seeking higher returns.
The S&P 500, trading at 6572.87 with a strong bullish trend on the 1-hour and 4-hour charts, reflects a positive risk appetite in traditional markets. However, its daily trend is bearish, indicating some underlying caution. The Nasdaq 100, at 29706.54, mirrors this sentiment with strong bullish signals on shorter timeframes but a neutral daily trend. This mixed signal from equities suggests that while there's appetite for risk, it's not without its hesitations. For ETHUSD, this means that while a weaker dollar is supportive, the overall market sentiment isn't overwhelmingly bullish, creating a delicate balance.
The Brent crude oil price, currently at 81.31, is showing a bearish trend on the 1-hour and daily charts, with a neutral stance on the 4-hour. This decline in oil prices could have a cooling effect on inflation expectations. Historically, high oil prices have been a significant driver of inflation concerns, often leading central banks to adopt more hawkish monetary policies, which can be detrimental to risk assets. A moderation in oil prices might, therefore, reduce immediate inflation fears, potentially easing pressure on central banks to hike rates aggressively. This indirectly benefits ETHUSD by reducing the perceived threat of tighter monetary policy.
The interplay between these macro factors creates a complex environment. A weaker dollar and moderating oil prices could theoretically support ETHUSD's ascent. However, the mixed signals from equity markets and the cautious technical readings on shorter timeframes for ETHUSD itself suggest that the path forward isn't straightforward. Traders are likely waiting for clearer direction from upcoming economic data, such as the Non-Farm Payrolls (NFP) report, which, according to recent news, showed an unexpected loss of 23,000 jobs in July. This negative NFP print could significantly alter the market's perception of the Federal Reserve's next move, potentially leading to a dovish shift and further supporting risk assets.
On-Chain Metrics and Ecosystem Health
Diving deeper into the crypto-specific fundamentals, on-chain data provides invaluable insights into ETHUSD's ecosystem health. Active addresses, a key metric for network usage, need to be consistently high to support price appreciation. While specific on-chain data isn't provided in the market context, a sustained price increase typically correlates with an uptick in active addresses and transaction volumes. If network activity is indeed rising in line with price, it validates the bullish sentiment. Conversely, if price is rising while active addresses stagnate or decline, it signals a potential divergence and a less sustainable rally.
Whale movements are another critical factor. Large holders transferring significant amounts of ETH to exchanges can be a bearish signal, indicating potential selling pressure. Conversely, whales accumulating or moving ETH off-exchange to cold storage often suggests long-term confidence. Monitoring these large wallet movements, if data were available, would offer a clearer picture of institutional sentiment. Without direct on-chain data in this context, we infer sentiment from price action and broader market correlations, acknowledging this as a limitation.
The DeFi and NFT ecosystems also play a vital role in Ethereum's value proposition. The Total Value Locked (TVL) in DeFi protocols and the activity within NFT marketplaces are direct indicators of demand for the Ethereum network. A growing TVL suggests more capital is being deployed in DeFi applications, increasing the utility and demand for ETH. Similarly, a vibrant NFT market indicates ongoing interest and utility for the blockchain. If these sectors are showing signs of growth or sustained activity, it adds a fundamental layer of support to ETHUSD's price, even if short-term technicals are mixed.
Regulatory news continues to be a significant overhang for the crypto market. Any developments regarding regulatory clarity or crackdowns can cause sharp price movements. For instance, positive regulatory news could boost institutional adoption and investor confidence, while negative news could introduce uncertainty and trigger sell-offs. Given the current market environment, any significant regulatory announcements would need to be closely monitored as potential catalysts for ETHUSD.
Navigating the Levels: Support, Resistance, and Trade Scenarios
Understanding the immediate price action requires a close look at the key technical levels provided. On the 1-hour chart, immediate resistance is found at $1,916.55, followed by $1,920.48 and $1,922.79. A decisive move above $1,916.55 would be the first sign of bulls gaining stronger control. However, it's the longer-term daily resistance levels that truly matter for trend confirmation. The daily resistance at $4,336.66 for XAUUSD is a key indicator of strength in the precious metals market, which sometimes correlates with crypto. For ETHUSD, the daily resistance levels are $4,336.66, $4,369.28, and $4,288.53. A sustained push above these significant daily resistance points would signal a more robust bullish trend.
On the downside, support levels are crucial for risk management. The immediate 1-hour support is at $1,910.31, then $1,908, and $1,904.07. A break below $1,904.07 on the 1-hour chart would be a warning sign, potentially indicating a short-term reversal. The daily support levels are $1,891.02, $1,877.06, and $1,863.53. Holding these levels is paramount for the overall bullish thesis. A close below the daily support at $1,891.02 would invalidate the current upward momentum and suggest a potential deeper correction.
Bearish Scenario: Consolidation Turns to Decline
35% ProbabilityNeutral Scenario: Range-Bound Choppiness
40% ProbabilityBullish Scenario: Resistance Breakout
25% ProbabilityThe current technical setup, particularly the mixed signals across different timeframes and the proximity to resistance, suggests that a period of consolidation or a minor pullback is more probable in the immediate short term. The 1-hour chart's bearish MACD momentum and the Stochastic's slight bearish signal, despite the overall positive trend strength indicated by the ADX, point towards potential choppiness. Therefore, the neutral scenario, with price action oscillating between the key 1-hour support and resistance levels, appears to be the most likely immediate outcome.
However, we must not discount the possibility of a bullish breakout. If ETHUSD can decisively close above the $1,916.55 resistance on the 1-hour chart, and ideally push towards the $1,920s, it would signal a continuation of the bullish trend, especially if confirmed by increasing trading volume and positive on-chain metrics. The key would be sustained buying pressure that overcomes the overhead resistance without triggering significant profit-taking. The daily trend's strength (88%) provides a solid foundation for such an upside move.
Conversely, a breakdown below the critical 1-hour support at $1,904.07 would invalidate the immediate bullish bias. This could lead to a retest of the more significant daily support levels around $1,891.02. Such a move would likely be exacerbated if broader market sentiment sours, perhaps due to unexpected negative economic data or geopolitical developments. The current DXY weakness provides a buffer, but a sharp reversal in risk appetite could quickly turn the tide against ETHUSD.
What Traders Should Watch Next
The immediate future for ETHUSD hinges on its ability to decisively break through the $1,916.55 resistance level. A sustained move above this point, ideally accompanied by increasing volume and positive on-chain activity, would strengthen the bullish case and potentially open the door for targets towards $1,939.56. Traders should be looking for confirmation on the daily chart, with a close above $1,918.51 being a significant milestone.
Conversely, failure to break resistance and a subsequent close below the $1,904.07 support level on the 1-hour chart would signal a shift towards caution. This could lead to a retest of the $1,891.02 daily support. The market is currently sensitive to macroeconomic data, and the recent negative NFP print suggests that the Federal Reserve might be nearing the end of its tightening cycle, which could provide a tailwind for risk assets. However, geopolitical risks, such as tensions in the Strait of Hormuz, remain a wildcard that could quickly shift sentiment back to risk-off.
While the daily trend for ETHUSD remains bullish, the short-term technicals show mixed signals. A close below the $1,904.07 support level on the 1-hour chart should be treated as a warning sign, potentially leading to further downside. Always manage your risk by setting appropriate stop-losses, especially when trading around key resistance levels.
For those looking to enter positions, patience is key. A confirmed breakout above resistance or a clear bounce off support levels would offer more defined risk/reward profiles. The current price action around $1,915.36 presents a zone of uncertainty. Waiting for clearer signals - either a decisive move up or a confirmed rejection and pullback - will likely lead to more favorable trading opportunities. The interplay between technicals, on-chain data, and macroeconomics will continue to dictate the short-term direction.
Frequently Asked Questions: ETHUSD Analysis
What happens if ETHUSD breaks above the $1,916.55 resistance level?
A sustained close above $1,916.55 on the 1-hour chart would confirm bullish momentum, potentially targeting the daily high of $1,939.56. This move would be supported by increasing on-chain activity and a positive macro environment, such as a weakening DXY.
Should I buy ETHUSD at current levels near $1,915.36, given the mixed signals?
Buying at current levels carries risk due to the proximity to resistance and mixed short-term indicators. A more prudent approach would be to wait for a confirmed breakout above $1,916.55 or a clear bounce from the $1,904.07 support, offering better risk-reward ratios.
Is the RSI at 54.77 a sell signal for ETHUSD right now?
No, an RSI of 54.77 on the 1-hour chart is not a sell signal; it indicates neutral momentum with a slight upward bias. It suggests buyers are still active but not yet in control, avoiding the overbought territory that typically signals potential reversals.
How will the recent negative NFP report affect ETHUSD this week?
The unexpected loss of 23,000 jobs in the US July NFP report could lead to a dovish shift in Federal Reserve policy expectations. This could weaken the DXY and boost risk assets like ETHUSD, potentially supporting a move towards higher resistance levels if the trend continues.
Technical Outlook Summary
| Indicator | Value | Signal | Interpretation |
|---|---|---|---|
| RSI (14) | 54.27 | Neutral | Room for upside, avoids overbought. |
| MACD Histogram | Positive | Bullish | Momentum supports upward movement. |
| Stochastic | 78.80 / 51.11 | Bullish | Strong upward signal on daily. |
| ADX | 13.08 | Weak Trend | Current trend is developing slowly. |
| Bollinger Bands | Upper Band Break | Bullish | Price above middle band, extended move possible. |
Key Levels
Support Levels
Resistance Levels
Track markets in real-time
AI-powered analysis, technical indicators and real-time price data.
Join Our Telegram Channel
Breaking market news, AI analysis and trading signals instantly.
Join Channel