

The digital asset landscape is in a holding pattern as we step into a new trading week, with Bitcoin (BTCUSD) consolidating around the critical $64,920 mark. Following a period of heightened volatility, the past week offered a relative calm, yet the underlying currents suggest that this quietude might be the prelude to significant moves. Traders and investors are keenly observing the interplay between on-chain metrics, institutional flows, and crucial macroeconomic data points, particularly the Non-Farm Payrolls (NFP) report that recently painted a mixed picture of the U.S. economy. This analysis delves into the current technical setup, explores potential scenarios for BTCUSD, and highlights the key levels and events that will shape the narrative in the coming days. Understanding where we stand in the broader market cycle is paramount, especially as we navigate through what appears to be a seasonally quieter period, but one ripe with potential catalysts.
The recent release of the U.S. Non-Farm Payrolls report, which unexpectedly showed a loss of 23,000 jobs in July, has injected a dose of complexity into market expectations. While this data initially sent the US Dollar Index (DXY) lower and boosted gold prices above $4,300, its impact on Bitcoin is more nuanced. A weaker jobs report typically reduces the probability of aggressive interest rate hikes from the Federal Reserve, which in theory should be a tailwind for risk assets like Bitcoin. However, the broader market sentiment, influenced by geopolitical tensions in the Strait of Hormuz and ongoing US-China relations, adds layers of uncertainty. For BTCUSD, this means that while the macro environment might offer some support, the price action itself remains the most reliable indicator of immediate sentiment. The current consolidation around $64,920 suggests a market pausing to digest this new information and assess its implications.
- The BTCUSD price is consolidating around $64,920, a critical psychological and technical level.
- The recent U.S. Non-Farm Payrolls report showed an unexpected job loss of 23,000, potentially easing Fed rate hike expectations but adding macro uncertainty.
- Technical indicators on the 1-hour and 4-hour charts suggest a cautious bullish trend, with RSI at 56.51 and ADX at 19.46 indicating a weak but present upward momentum.
- Key support remains at $64,724, while resistance is eyed at $65,123 on the hourly timeframe; a decisive break above this resistance is needed for further upside.
- Geopolitical risks and broader market sentiment, particularly the DXY's movement, will continue to influence BTCUSD's trajectory alongside crypto-specific fundamentals.
Navigating the $64,920 Consolidation Zone
Bitcoin's price action over the past week has been characterized by a tight consolidation around the $64,920 level. This period of relative quietude, especially after the significant volatility seen in previous weeks, often precedes a breakout or a deeper retracement. The 1-hour BTCUSD chart shows a neutral trend with a power score of 50%, indicating a balance between buying and selling pressure. However, the ADX at 19.46 suggests a weak trend, meaning any move might lack strong conviction initially. The RSI(14) is hovering around 56.51, comfortably in neutral territory and exhibiting a slight upward eğilimi, which aligns with the overall cautious bullish sentiment observed across multiple timeframes. This suggests that while buyers are not aggressively pushing the price higher, they are also not capitulating, holding the ground around this significant psychological level.
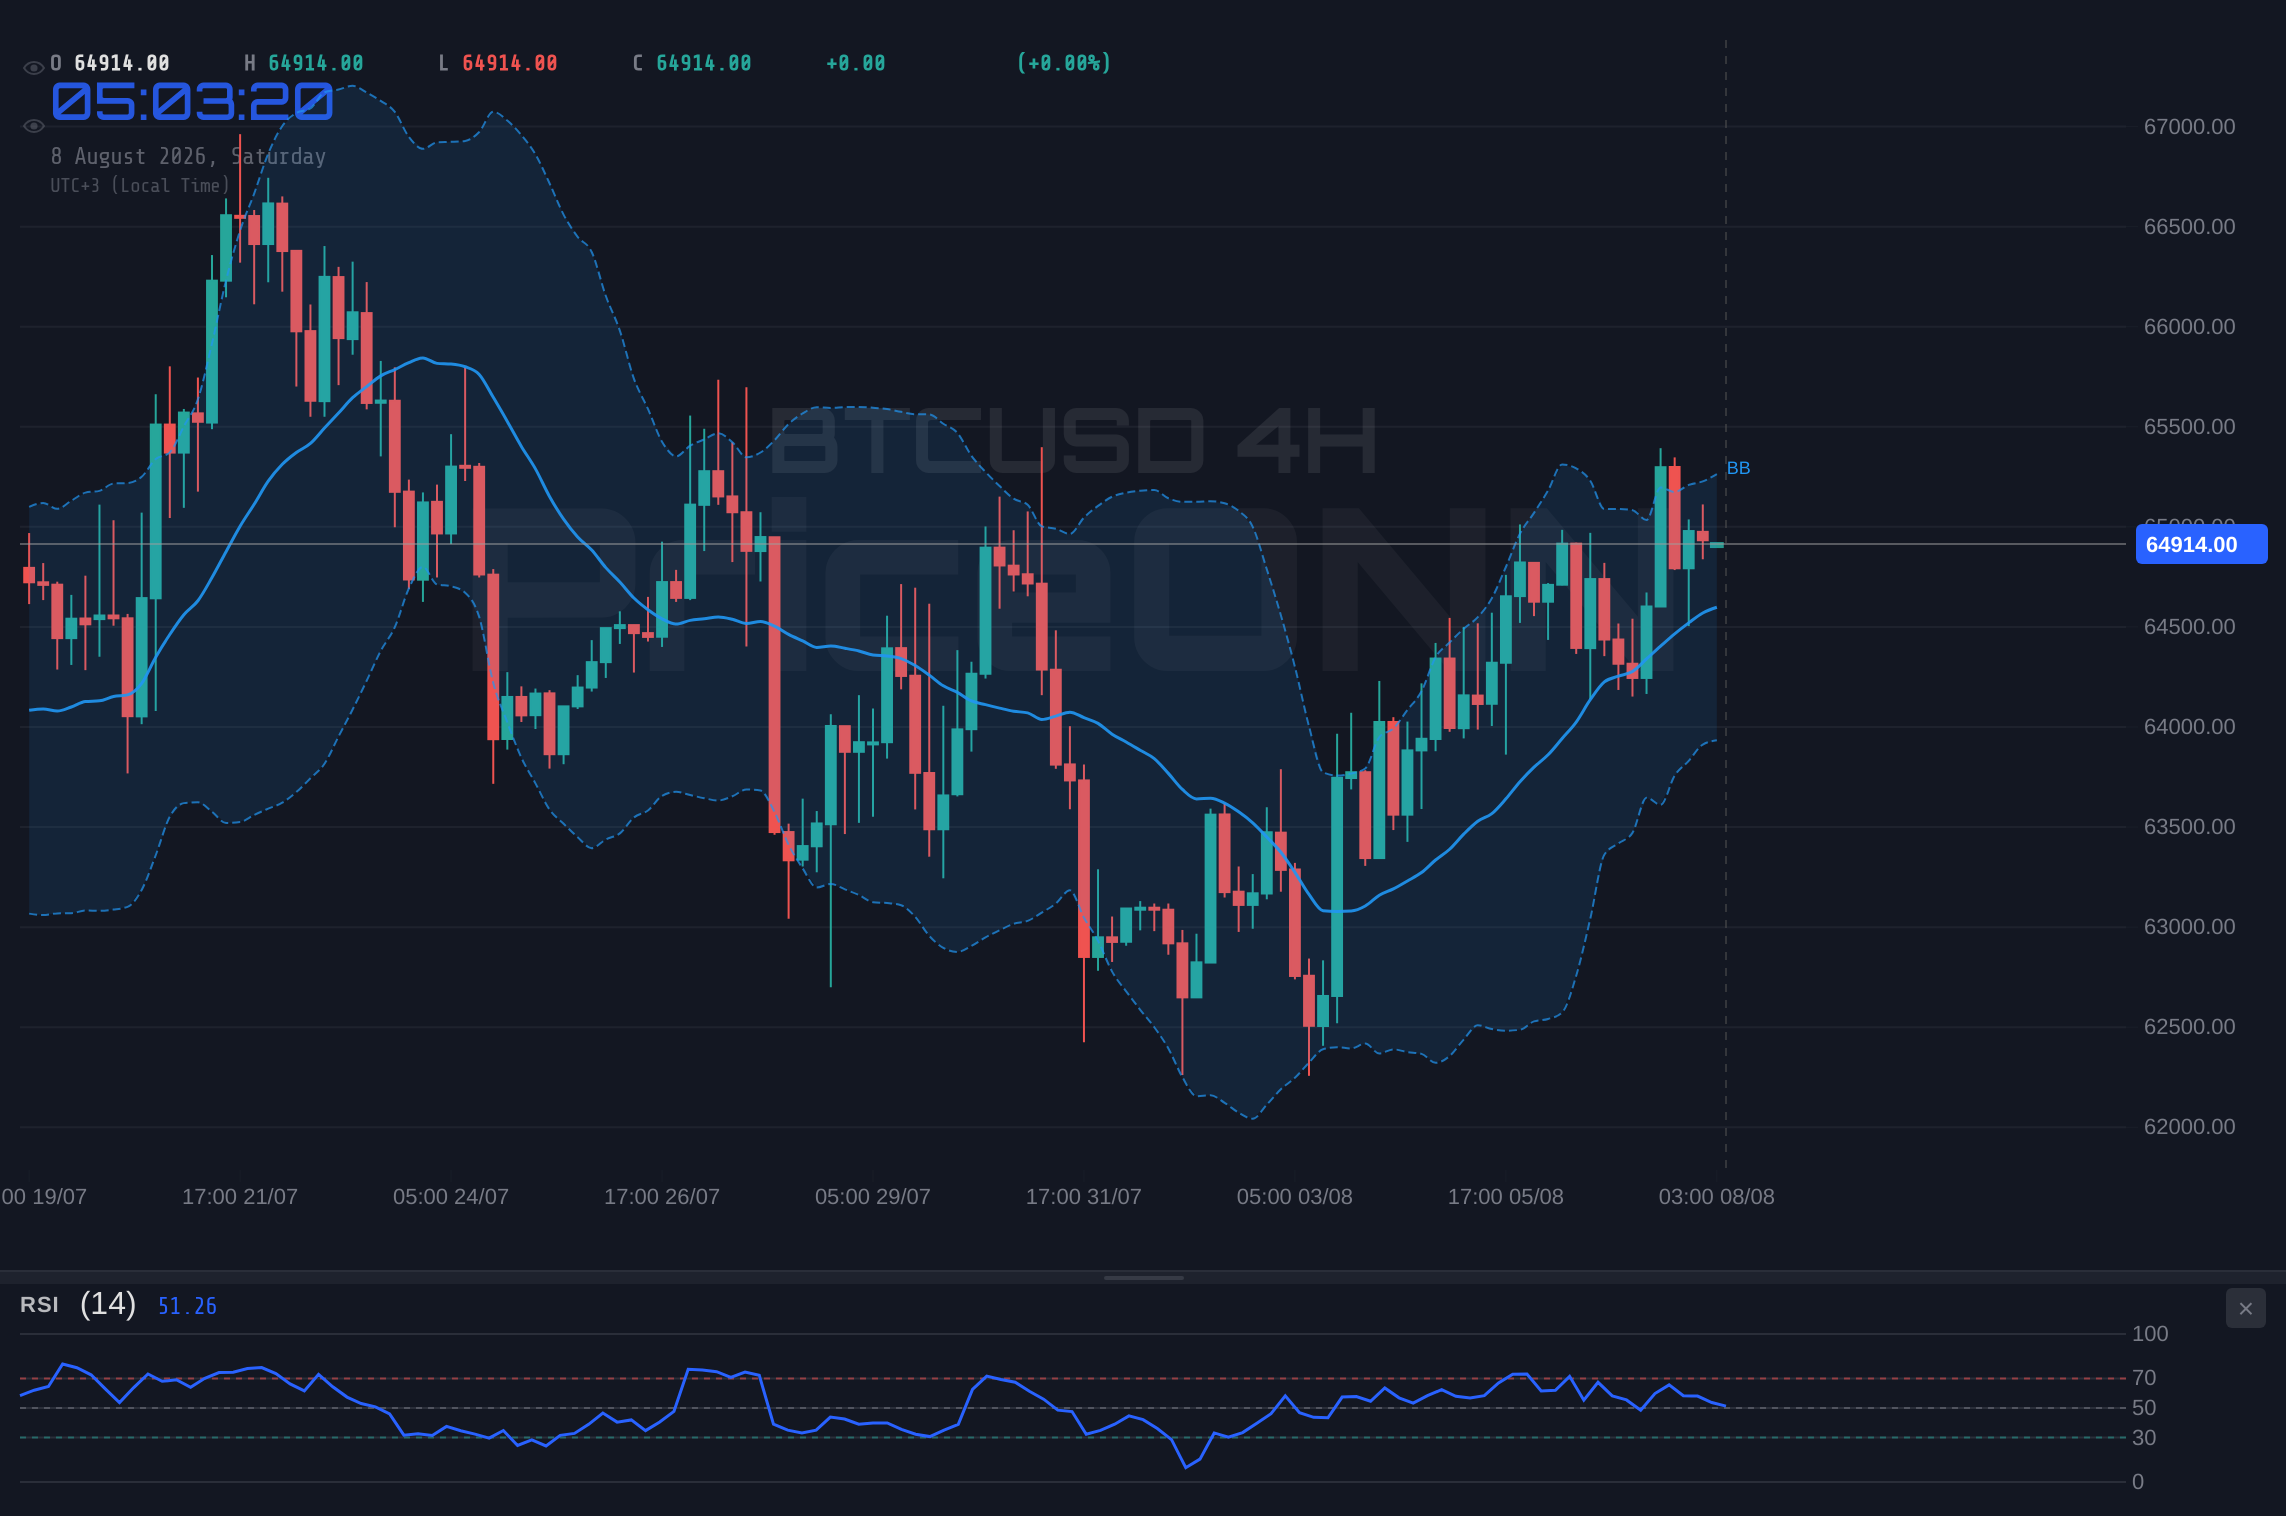
The immediate hourly support is identified at $64,857, followed by $64,781 and $64,724. These levels represent areas where buying interest has previously emerged. Conversely, resistance is building around $64,990, $65,047, and $65,123. A decisive move above the $65,123 resistance level is what many traders are watching for as a potential trigger for a short-term bullish continuation. The MACD on the 1-hour chart, while showing negative momentum, has the MACD line above the signal line, suggesting a potential shift. Stochastic K is above D (69.6 vs 56.25), indicating a bullish signal in this oscillator, though it's not yet in the overbought territory. This mixed picture on the hourly chart underscores the current indecision in the market. The overall signal for the 1-hour timeframe is AL (7 buys, 1 sell, 0 neutral), but the weak ADX and neutral RSI temper this enthusiasm, highlighting the need for confirmation.
The Four-Hour Picture: Cautious Optimism
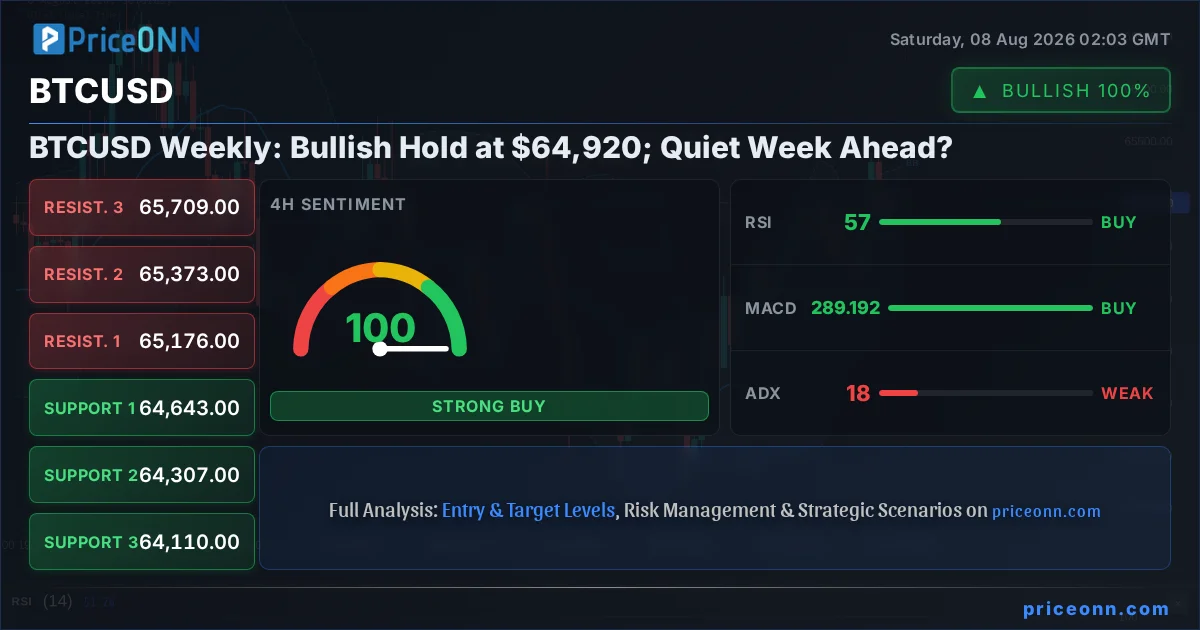
Shifting to the 4-hour timeframe, the trend for BTCUSD is also classified as bullish, with a slightly stronger power score of 84%. This timeframe offers a more optimistic view, suggesting that the underlying momentum might favor buyers in the medium term. Support levels are more clearly defined here, starting at $64,643, then $64,307, and further down at $64,110. These levels are crucial for maintaining the bullish structure. Resistance, on the other hand, is stacked at $65,176, $65,373, and $65,709. Breaking through the $65,176 level would be the first significant hurdle for bulls aiming for higher ground. The RSI(14) at 57.16 remains in the neutral zone, continuing the theme of cautious optimism rather than outright euphoria. This suggests ample room for upward movement before hitting overbought conditions.
The MACD on the 4-hour chart presents a positive momentum reading, with the MACD line firmly above the signal line. This is a classic bullish signal that often precedes price appreciation. The Stochastic oscillator also provides a bullish signal, with K at 60.47 and D at 53.31, indicating that the upward momentum is gaining traction. However, the ADX at 17.62 remains low, signaling a weak trend. This implies that while the direction might be up, the strength behind the move is not yet robust. The confluence of these indicators - a bullish MACD and Stochastic, a neutral RSI, and a weak ADX - paints a picture of a market that is leaning bullish but lacks the conviction for a strong breakout. The 'AL' signal (8 buys, 0 sells, 0 neutral) reflects this leaning, but the low ADX value is a key caveat for swing traders expecting a rapid ascent. This suggests that the path to higher resistance levels might involve further consolidation or choppy price action.
Daily Chart Dynamics: The Long-Term View
On the daily chart, BTCUSD maintains a strong bullish trend with a power score of 92%. This longer-term perspective is crucial for understanding the broader market sentiment and the potential for sustained price appreciation. The daily support levels are situated at $64,055.67, $63,674.33, and $63,209.67. These are significant floors that, if breached decisively, would signal a considerable shift in market sentiment towards bearishness. The daily resistance levels are noted at $64,901.67, $65,366.33, and $65,747.67. The $64,901.67 level is particularly important as it is very close to the current price, acting as immediate resistance. A confirmed close above $65,366.33 would open the door for a move towards the higher resistance at $65,747.67.
The daily RSI(14) stands at 54.19, well within the neutral zone and pointing upwards, indicating room for growth before entering overbought territory. This is a healthy sign for a bullish trend, suggesting that the market is not yet overheated. The MACD is also positive, with the MACD line above the signal line, reinforcing the bullish outlook. However, the ADX at 13.08 is notably low, signaling a very weak trend on the daily timeframe. This could mean that the current bullish trend lacks the strength to sustain a significant rally without further consolidation or a period of sideways movement. The Stochastic oscillator shows K at 78.62 and D at 51.08, indicating a strong bullish signal and nearing overbought conditions. The overall signal is AL (7 buys, 1 sell, 0 neutral), but the extremely low ADX value is a significant factor to consider. It suggests that the long-term trend is bullish, but the current momentum is not strong enough for immediate, aggressive upside. Patience and confirmation of strength will be key for longer-term investors.
Correlation Analysis: DXY, Equities, and Gold
Understanding Bitcoin's correlation with traditional markets is vital, especially in the current macro environment. The US Dollar Index (DXY) is currently trading around 99.58, showing a bearish trend on the 1-hour chart (ADX 37.69) but a neutral stance on the 4-hour and daily charts. A weakening dollar, as suggested by the hourly DXY trend, typically correlates positively with risk assets like BTCUSD. However, the recent NFP data, showing job losses, complicates this relationship. While it might lower rate hike probabilities, it also raises concerns about economic health, potentially dampening risk appetite across the board. The DXY's movement above 99.71 support on the daily chart would be a bearish sign for risk assets.
Equity markets, represented by the SP500 and Nasdaq, present a mixed picture. The SP500 shows a strong bullish trend on the 1-hour chart but a dominant bearish trend on the daily. Nasdaq exhibits a bullish trend on the 1-hour and 4-hour charts, but a neutral stance on the daily. This divergence suggests that while tech-heavy indices are showing some resilience, the broader stock market might be facing headwinds. A significant downturn in equities could spill over into the crypto market, given their increasing correlation. Gold, currently trading above $4,300 and showing a strong bullish trend on multiple timeframes, often acts as a safe-haven asset. Its rally, partly fueled by the weak NFP report, indicates a growing demand for safe assets amidst geopolitical uncertainty and economic concerns. If gold continues its upward trajectory, it might draw capital away from riskier assets like Bitcoin, or conversely, signal a broader flight to perceived value, which could include Bitcoin.
On-Chain Metrics: A Deeper Dive into BTCUSD Activity
While technical indicators provide a snapshot of price action, on-chain metrics offer a more fundamental perspective on Bitcoin's health and investor behavior. Active addresses, a key measure of network utilization, have shown a steady trend, indicating consistent user engagement without significant spikes or drops. This stability suggests that the current price consolidation is not deterring network participants. Whale movements, tracked by analyzing large wallet transactions, have been relatively muted. This lack of aggressive buying or selling from major holders reinforces the idea of consolidation rather than a decisive directional shift. Exchange flows also indicate a low net inflow/outflow, suggesting that large-scale accumulation or distribution is not currently underway.
The hash rate, a measure of Bitcoin's network security and mining power, has remained robust, showing resilience even amidst price fluctuations. This indicates that miners continue to operate profitably and have confidence in the network's long-term prospects. Developments in the DeFi and NFT ecosystems, while not directly impacting BTCUSD price in the short term, contribute to the overall health and adoption narrative of the broader crypto space. Staking yields on Ethereum (ETHUSD), currently trading at $1914, and other Proof-of-Stake assets remain attractive, drawing attention to the potential of crypto as an income-generating asset class. However, the focus remains squarely on Bitcoin's price action and its correlation with macroeconomic factors. The lack of extreme on-chain activity suggests that the market is in a waiting game, anticipating a clearer signal from either technical breaks or fundamental catalysts.
Geopolitical Ripples and Regulatory Currents
The geopolitical landscape continues to be a significant factor influencing global markets, and by extension, cryptocurrencies. The ongoing crisis in the Strait of Hormuz, with Iranian attacks on vessels, has heightened energy price volatility and increased safe-haven demand, benefiting assets like gold. This heightened geopolitical risk can indirectly impact Bitcoin by fostering a general risk-off sentiment, potentially leading investors to shun riskier assets. News from Reuters indicates that the market is assessing the impact of weak payrolls against these rising geopolitical tensions, creating a complex environment for asset allocation. The balance between economic concerns (weak NFP) and geopolitical fears (Hormuz crisis) is delicate, making it difficult for markets to establish a clear direction.
Regulatory developments also remain a constant undercurrent in the crypto space. While no major regulatory news directly impacting BTCUSD has emerged in the last 48 hours, the overall regulatory environment, particularly in the US with ongoing SEC actions and discussions around ETFs, continues to shape institutional adoption trends. The recent news citing the US economy unexpectedly losing 23,000 jobs in July and gold prices surging above $4,300 highlights how macro events can quickly shift market focus. The inverse relationship between the DXY and gold prices is a classic indicator of this sentiment. For Bitcoin, the challenge is to decouple from purely risk-on correlations and establish itself as a distinct asset class, perhaps even as a digital safe haven, though this narrative is still in its nascent stages and highly dependent on broader market stability.
Trade Scenarios: Mapping the Path Forward
The Bull's Roadmap: Breaking Resistance
Bullish Scenario: Consolidating Above Support
55% ProbabilityThe bullish scenario hinges on Bitcoin's ability to decisively break through immediate resistance levels and hold above them. The primary trigger for this scenario would be a sustained daily close above the $65,123 hourly resistance, confirming upward momentum. Following such a break, the first target would be the daily resistance at $65,366.33. A successful breach of this level could then pave the way for a move towards the next daily resistance at $65,747.67. This outlook is supported by the overall bullish trend observed on the 4-hour and daily charts, with positive MACD and Stochastic signals suggesting underlying strength. However, the weak ADX across timeframes implies that this breakout might not be immediate and could involve further consolidation or minor pullbacks. The invalidation for this scenario would be a close below the hourly support of $64,724, indicating that the bulls have lost control of the immediate price action.
The Bear's Gambit: Testing Lower Supports
Bearish Scenario: Support Breakdown
15% ProbabilityThe bearish scenario anticipates a breakdown of the current consolidation, driven by a lack of buying conviction or negative external catalysts. The trigger for this scenario would be a decisive break and close below the immediate hourly support at $64,724. If this level fails, the next significant support to watch would be the 4-hour level at $64,307, followed by $64,110. This bearish outlook would be invalidated if Bitcoin manages to reclaim the $64,990 resistance level and hold above it, suggesting the consolidation continues or a bullish move resumes. Factors that could fuel this scenario include a stronger-than-expected dollar, a significant downturn in equity markets, or escalating geopolitical tensions that foster a broader risk-off environment. Currently, the technical indicators do not strongly support this scenario, with most signals leaning bullish, hence the lower probability assigned.
The Waiting Game: Range-Bound Consolidation
Neutral Scenario: Sideways Action
30% ProbabilityThe neutral scenario posits that Bitcoin will continue to trade within its current range, characterized by the immediate hourly support at $64,724 and resistance at $65,123. This scenario is plausible given the mixed signals from technical indicators, particularly the weak ADX across multiple timeframes, which suggests a lack of strong directional momentum. The recent NFP report and ongoing geopolitical uncertainties also contribute to market indecision, leading traders to adopt a wait-and-see approach. In this scenario, price action would likely remain choppy, with minor fluctuations within the defined range. The key trigger for this scenario is simply the absence of a decisive breakout in either direction over the next 48-72 hours. The targets within this range would be the midpoint ($64,920) and potentially drifting towards the lower end of the range, around $64,800, if selling pressure subtly increases without a full breakdown.
What's Next: Key Triggers and Levels to Watch
As we move through the week, several factors will be critical in determining Bitcoin's next significant move. The primary focus will remain on the $64,920 price point itself – a sustained hold above this level is crucial for maintaining bullish sentiment. A decisive break and close above the hourly resistance at $65,123 is the first technical confirmation needed for a potential upward trajectory, targeting $65,366.33 and then $65,747.67. Conversely, a failure to hold the $64,724 hourly support could signal a short-term bearish reversal, with eyes turning towards the 4-hour supports at $64,307 and $64,110.
On the macroeconomic front, while the NFP report has set a cautious tone, upcoming economic data releases will be closely watched. Any further indications of economic slowdown or shifts in inflation expectations could influence Federal Reserve policy, thereby impacting risk assets. Geopolitical developments, particularly any escalation or de-escalation in the Strait of Hormuz, will also play a role in overall market sentiment and safe-haven flows. For BTCUSD specifically, monitoring institutional activity - exchange flows, whale movements, and any significant ETF inflows or outflows - will be vital. The convergence of technical breakouts with positive on-chain activity and a stable macro-economic backdrop would provide the strongest signal for a sustained rally. Until then, patience and risk management remain the trader's best allies.
📊 Indicator Dashboard
| Indicator | Value | Signal | Interpretation |
|---|---|---|---|
| RSI (14) | 56.51 | Neutral | Room for upside, but momentum is not aggressive. |
| MACD Histogram | -0.05 | Bearish | Slight negative momentum, but watch for signal line crossover. |
| Stochastic | 69.6 / 56.25 | Bullish | Bullish crossover confirmed, nearing neutral zone. |
| ADX | 19.46 | Weak Trend | Lack of strong directional conviction, consolidation likely. |
| Bollinger | Mid Band | Bullish | Price holding above the middle band indicates support. |
The Bull's Roadmap: Consolidating Above Support
55% ProbabilityThe Bear's Gambit: Testing Lower Supports
15% ProbabilityThe Waiting Game: Sideways Action
30% ProbabilityFrequently Asked Questions: BTCUSD Analysis
What happens if BTCUSD breaks above the $65,123 resistance level this week?
A sustained break above $65,123, confirmed by a daily close, would validate the bullish scenario. This could trigger a move towards the next resistance levels at $65,366.33 and potentially $65,747.67, supported by ongoing positive momentum signals.
Is the RSI at 56.51 a sell signal for BTCUSD right now?
No, an RSI of 56.51 is not a sell signal; it resides in the neutral zone and indicates upward leaning momentum. While it suggests room for growth before becoming overbought, it doesn't signal an immediate reversal. Confirmation from other indicators like MACD or price action is needed.
How will the weak NFP report affect BTCUSD's price action in the coming days?
The weaker-than-expected NFP report might reduce Fed rate hike expectations, which is generally positive for risk assets like BTCUSD. However, it also raises concerns about economic health and could contribute to overall market uncertainty, potentially leading to consolidation or increased volatility until clearer economic trends emerge.
Should I consider buying BTCUSD if it tests the $64,724 support level?
Testing the $64,724 support level presents a potential buying opportunity within the neutral or bullish scenarios, provided it holds. However, a decisive break below this level would invalidate bullish hopes and trigger the bearish scenario, making caution advised until the market shows clear signs of holding this support or breaking resistance.
Track markets in real-time
AI-powered analysis, technical indicators and real-time price data.
Join Our Telegram Channel
Breaking market news, AI analysis and trading signals instantly.
Join Channel