

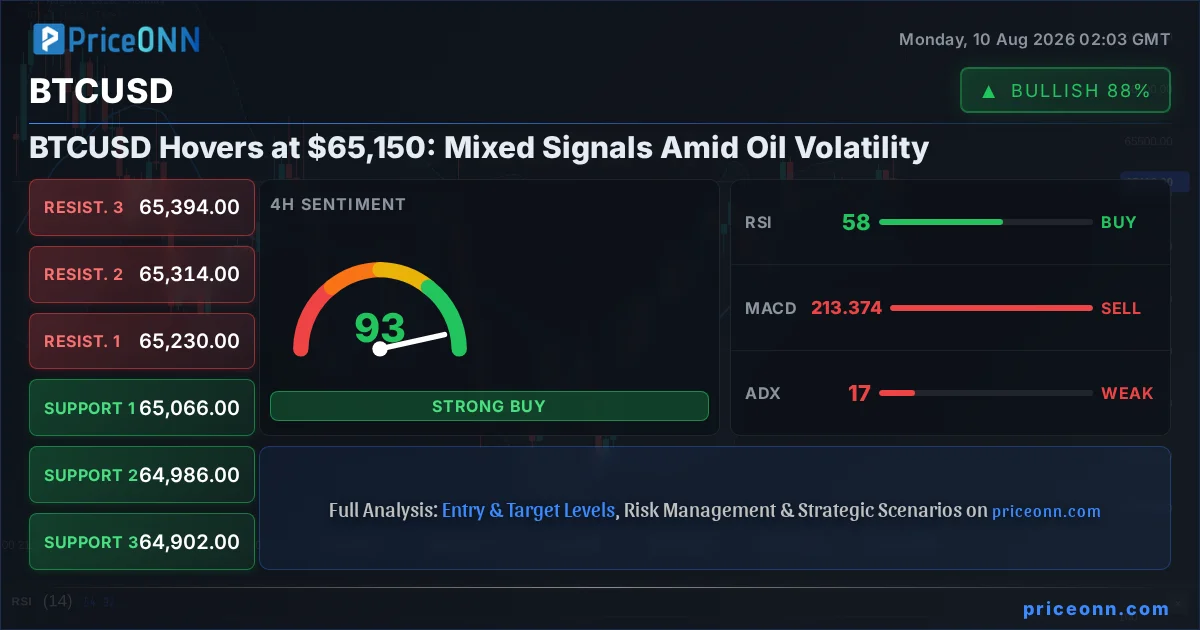
The global energy markets are sending ripples across all asset classes, and Bitcoin (BTCUSD) is no exception. As Brent crude oil prices surge past $83.00, a potent mix of inflation concerns and geopolitical uncertainty is brewing. This complex backdrop creates a challenging environment for risk assets, with BTCUSD currently finding itself at a critical juncture near $65,150. While some technical indicators flash bullish signals, a closer look reveals a market grappling with conflicting data points and external pressures that demand a nuanced approach. The question on every trader's mind is whether the current price action is a prelude to a significant move or merely a pause before further consolidation.
- RSI at 56.06 on the 1H chart signals cautious bullish momentum for BTCUSD, but MACD remains in negative territory.
- Critical support for BTCUSD sits at $64,245, tested during the 1H timeframe, while resistance is eyed at $65,757.
- The surge in Brent crude above $83.18, coupled with geopolitical tensions, adds an inflationary pressure that typically weighs on risk assets like Bitcoin.
- A daily close above $65,757 would be needed to confirm a bullish breakout, while a break below $64,245 could trigger further downside.
The interplay between energy prices and broader market sentiment is a critical factor to monitor. Brent crude's ascent, driven by ongoing geopolitical disruptions in the Middle East and a general tightening of global energy supply, injects a dose of inflation risk into the economic narrative. Historically, rising energy costs can dampen consumer spending and business investment, potentially leading central banks to maintain tighter monetary policies for longer. This, in turn, can create headwinds for speculative assets like Bitcoin. The current price of Brent at $83.18 is a significant data point, suggesting that the market is pricing in persistent supply concerns. This inflationary pressure is a wildcard that cannot be ignored when assessing the immediate prospects for BTCUSD.
Navigating the BTCUSD Landscape: A Tale of Two Signals
Bitcoin, the flagship cryptocurrency, is currently trading around the $65,150 mark. The 1-hour chart presents a mixed bag of signals. On one hand, the Relative Strength Index (RSI) at 56.06 suggests a degree of bullish momentum is present, indicating that buyers are still in the game without pushing the asset into fully overbought territory. This aligns with the overall upward directionality indicated by the 1-hour trend strength of 50% and a general 'Buy' signal from the aggregated 1-hour indicators. However, the MACD (Moving Average Convergence Divergence) paints a less optimistic picture, showing negative momentum with the MACD line below its signal line. This divergence between the RSI and MACD on the shorter timeframe highlights the indecision currently gripping the market.
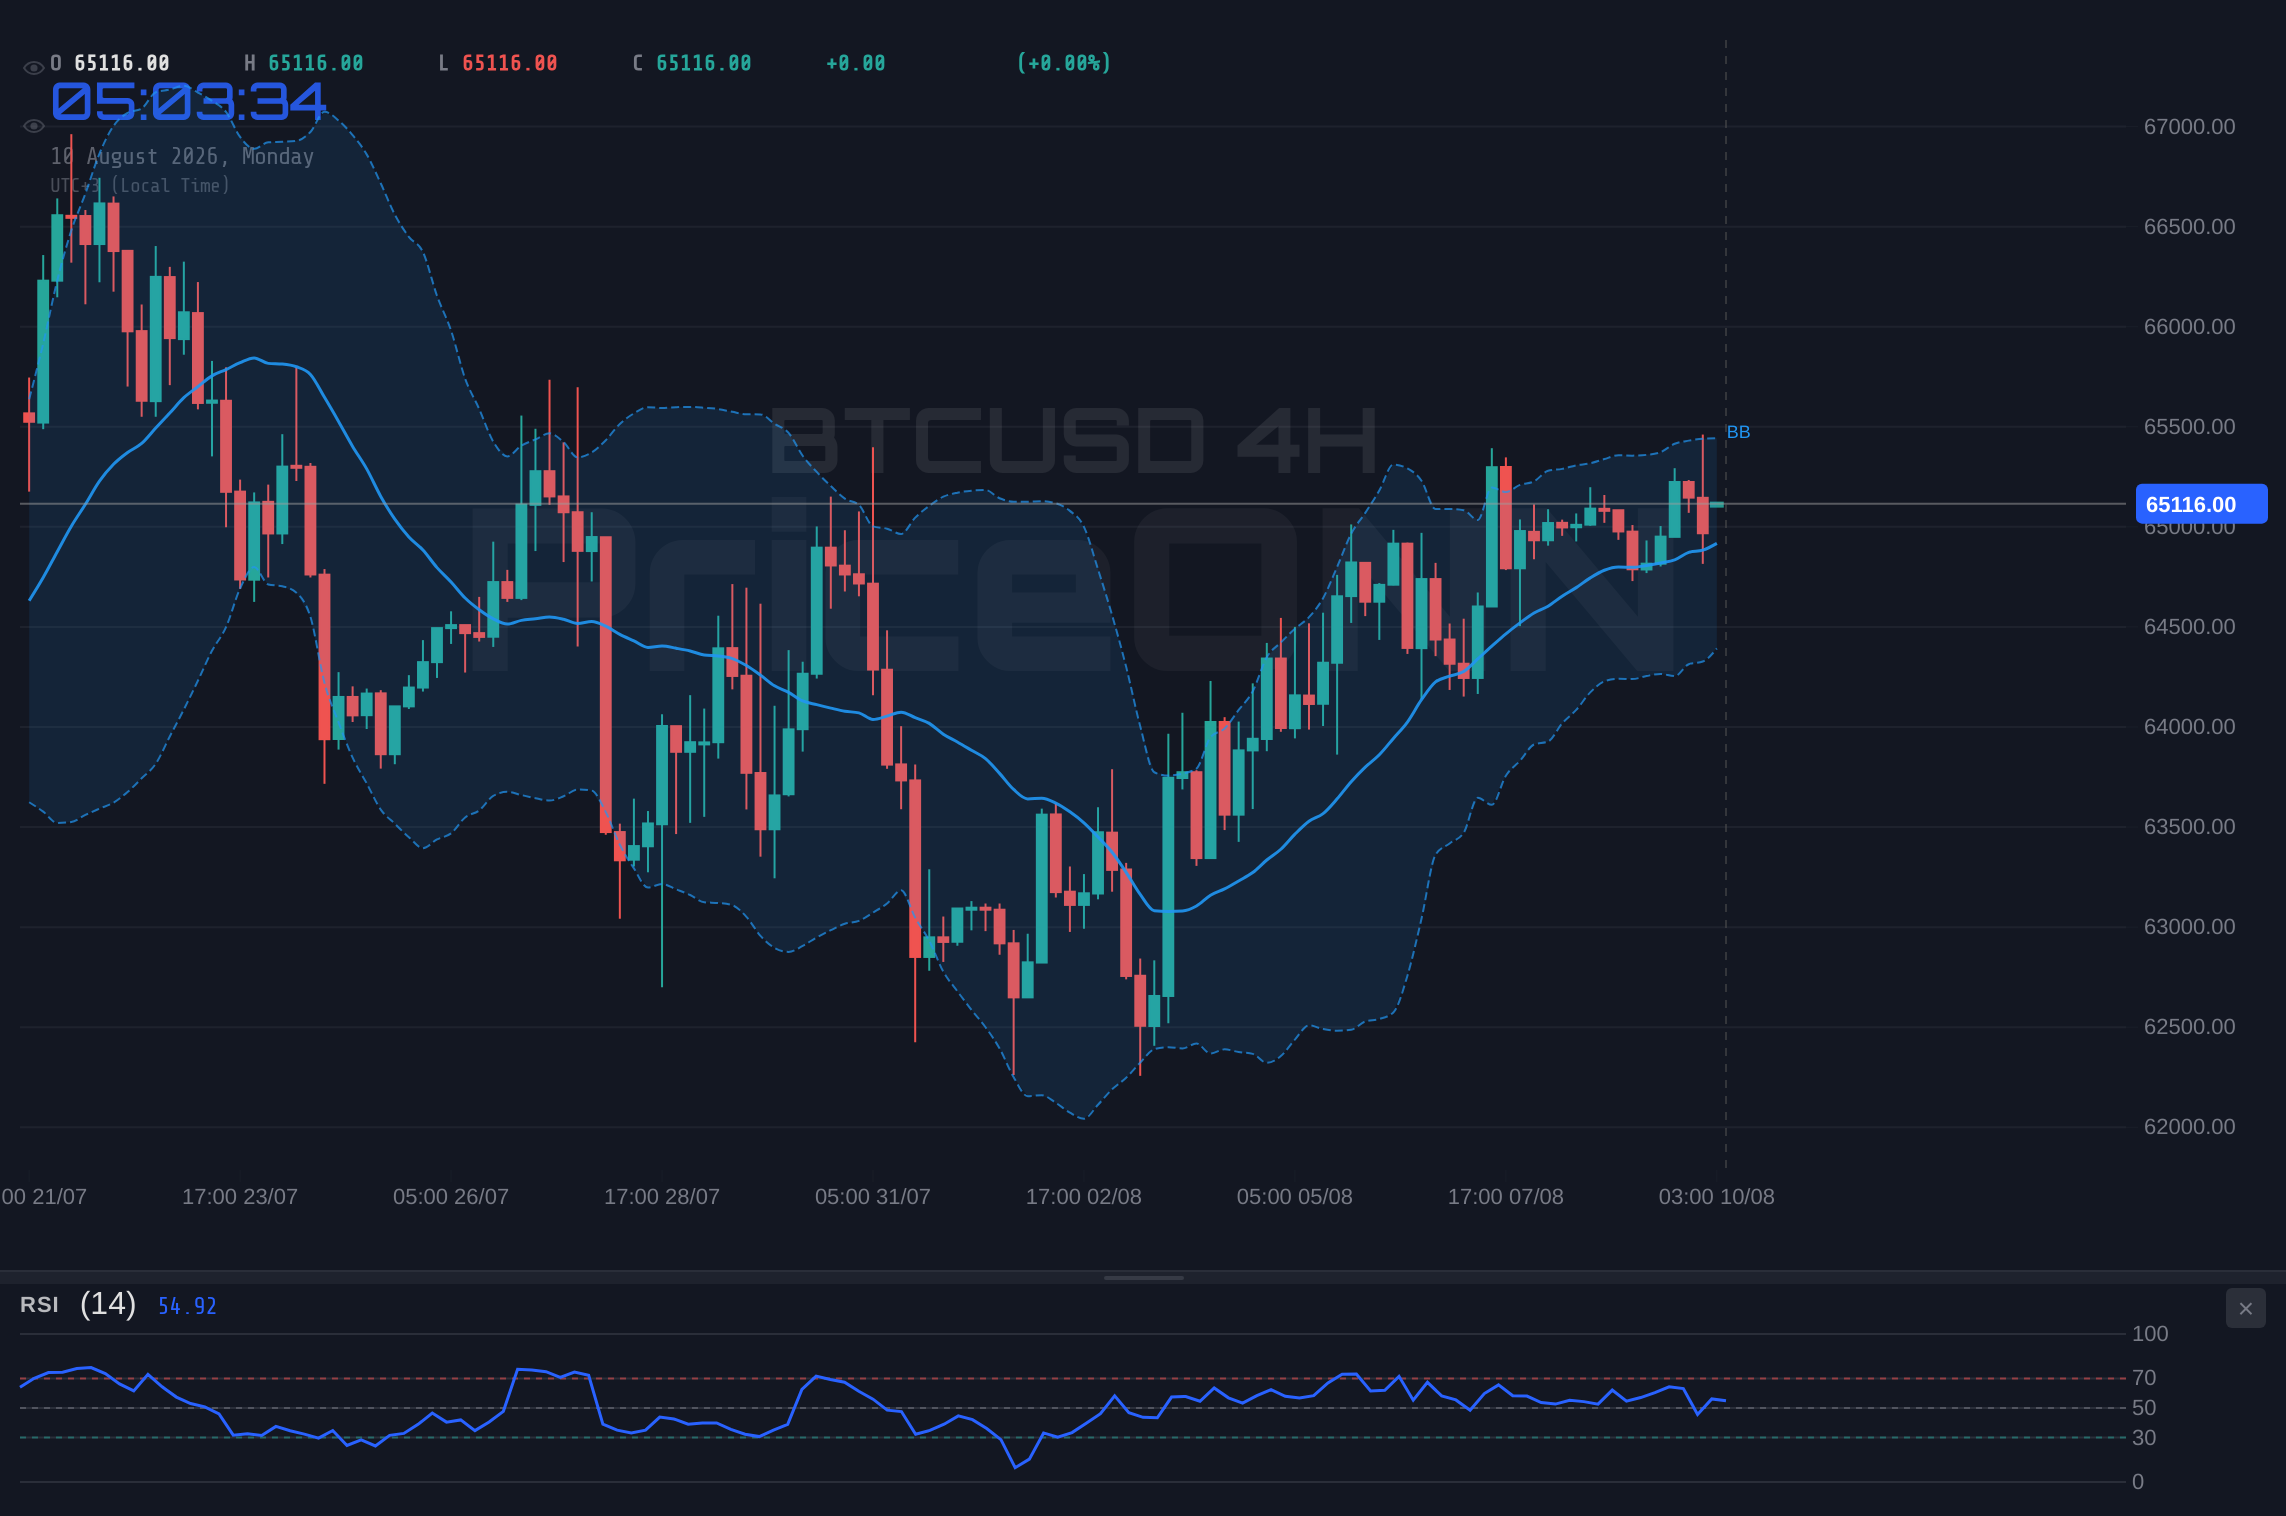
Adding to this complexity, the 4-hour timeframe for BTCUSD shows a stronger bullish lean. The trend strength is rated at 78%, and the aggregated signal is a solid 'Buy'. The RSI here is at 58.66, still comfortably in neutral territory but trending upwards, suggesting room for further appreciation. The Stochastic Oscillator, with K at 73.07 and D at 53.69, also provides a bullish signal, indicating that the %K line is above the %D line and moving higher. Yet, even on this timeframe, the MACD exhibits negative momentum, a recurring theme that underscores the caution needed. The ADX, at 16.52 on the 4-hour chart, points to a weak trend, suggesting that while there's upward movement, it lacks the conviction for a sustained breakout. This weak trend strength, despite positive indicator readings, means that the current upward push might be more of a grind than a charge.
The daily chart for BTCUSD offers a more encouraging, albeit still cautious, outlook. The trend is predominantly bullish with a strength of 86%. The RSI at 55.33 remains in neutral territory, but the MACD is showing positive momentum with the MACD line above its signal line. This is a more constructive sign than what we're seeing on shorter timeframes. The Stochastic Oscillator is in overbought territory, with K at 89.63 and D at 71.52, indicating that the price has moved up significantly and could be due for a pause or pullback. However, the ADX at 12.38 is exceptionally low, suggesting a very weak trend. This is somewhat contradictory to the overall bullish signal, implying that the daily trend is building but lacks strong directional conviction. In essence, the daily chart suggests an underlying bullish bias, but the lack of a strong trend and the overbought Stochastic are cautionary notes.
The Oil Factor: An Inflationary Headwind
The surge in Brent crude oil prices to $83.18 is a critical piece of the puzzle. This isn't just a commodity market move; it has significant implications for inflation expectations and, by extension, central bank policy. When oil prices rise sharply, it increases transportation costs and impacts a wide range of industries, feeding into broader inflation metrics. The market's response to this has been a mixed bag of signals. While the US economy has shown some resilience, as indicated by the Weekly Bottom Line mentioning stocks hitting all-time highs amidst mixed economic data, the persistent strength in oil prices cannot be ignored. The July NFP report, which was surprisingly weak, had initially flipped Fed rate cut odds, suggesting a potential easing of monetary policy. However, the ongoing strength in energy prices complicates this narrative. If inflation remains sticky due to factors like high oil prices, the Federal Reserve might be compelled to maintain a more hawkish stance, which typically acts as a drag on risk assets like BTCUSD.
The current correlation between BTCUSD and traditional risk assets, particularly equities, is a key area of focus. While the Nasdaq 100 and S&P 500 have shown recent strength, their performance can be directly influenced by macroeconomic factors like inflation and interest rate expectations. The S&P 500, currently at 6572.87, and the Nasdaq 100 at 29764.42, are exhibiting bullish trends on shorter timeframes but show mixed signals on the daily chart, mirroring BTCUSD's own ambiguity. A sustained rise in oil prices could put pressure on these equity indices if it fuels inflation fears, potentially leading to a broader risk-off sentiment. In such a scenario, even a technically constructive BTCUSD setup could face significant headwinds. The DXY (Dollar Index), currently at 99.7, is also a vital component. A strengthening dollar, often seen as a safe-haven asset, can put pressure on commodities and risk assets. While the DXY is showing a daily downtrend, its movements are closely watched for shifts in global risk appetite.
Bridging the Gap: What Levels Matter Most?
For BTCUSD to solidify its bullish case, breaking through immediate resistance levels is paramount. On the 1-hour chart, the resistance is clearly defined at $4342.58, $4353.03, and $4359.04. A decisive move above these levels, supported by increasing volume and positive MACD crossover, would signal stronger buying conviction. However, the current data shows MACD in negative territory on this timeframe, and the ADX at 35.89 indicates a strong trend, but the overall signal is neutral, hinting at a potential stalemate. The daily chart resistance levels are significantly higher, at $4288.53, $4336.66, and $4369.28, suggesting that a break above the immediate hourly resistance could open the door for a larger move towards these more significant daily barriers.
Conversely, support levels must hold for the bullish narrative to remain intact. On the 1-hour chart, immediate support lies at $4326.12, $4320.11, and $4309.66. A break below these levels, particularly $4309.66, would invalidate the short-term bullish bias and could lead to a test of the daily support levels at $4207.78, $4175.16, and $4127.03. The daily chart's ADX at 27.02 indicates a strong uptrend, but the overbought Stochastic suggests a potential for a pullback. Traders should pay close attention to how BTCUSD reacts around the $65,150 price point. A failure to hold the immediate 1-hour support could signal a shift in sentiment, especially if coupled with further negative news from the energy sector or a renewed rise in the DXY. The market is currently balanced on a knife's edge, with both upside and downside potential heavily dependent on external factors and immediate price action.
The Path Forward: Scenarios and Strategy
Given the conflicting signals and the external pressures from the energy market, a cautious approach is warranted. The current setup around $65,150 presents a classic 'watch zone' scenario rather than a clear-cut trade. The market needs to provide more conviction before a decisive directional bet can be made. The primary condition for a bullish setup would be a sustained break above the immediate 1-hour resistance levels, ideally confirmed by positive MACD movement and increasing volume. This would suggest that Bitcoin is shrugging off the inflationary concerns and continuing its upward trajectory.
A bearish scenario would be triggered if BTCUSD fails to hold its current support levels, particularly the 1-hour support at $4309.66. A close below this level, especially on the 4-hour chart, would signal a potential reversal and could lead to a sharp decline towards the daily support zones. The ongoing strength in Brent crude and any dovish signals from the Fed in response to weak economic data could exacerbate such a move. The market is currently in a state of flux, where a single catalyst could shift the sentiment dramatically. Therefore, managing risk and waiting for clear confirmation is key.
The current ADX readings across multiple timeframes (1H: 35.89, 4H: 43.44, 1D: 27.02 for XAUUSD, and similar strong readings for other assets) suggest that when trends do form, they are strong. However, for BTCUSD itself, the ADX is more subdued, especially on the daily chart (12.38). This indicates that the market is not yet in a strong, committed trend. This weakness in trend strength, despite positive RSI and Stochastic signals on some timeframes, suggests that breakouts need to be treated with caution and ideally confirmed by volume and MACD confirmation. The price action around $65,150 is crucial; a failure to break higher or a decisive break lower will dictate the next significant move.
Frequently Asked Questions: BTCUSD Analysis
What happens if BTCUSD breaks above $65,757 resistance?
A sustained break above the 1-hour resistance at $65,757, especially with increased volume and a positive MACD crossover, would invalidate the current neutral stance. This could open the door for a move towards the next daily resistance level around $4336.66, signaling renewed bullish momentum.
Should I buy BTCUSD at current levels of $65,150 given the RSI at 56.06 and Brent crude above $83.18?
Buying at current levels carries risk due to conflicting signals and the inflationary pressure from oil. While the RSI at 56.06 is not yet overbought, the negative MACD momentum on shorter timeframes and the high Brent price suggest caution. A more prudent approach would be to wait for a confirmed break above $65,757 or a pullback to a stronger support level like $64,245, where risk management is clearer.
Is the RSI at 56.06 a sell signal for BTCUSD right now?
No, an RSI of 56.06 is not considered a sell signal; it indicates moderate bullish momentum. Sell signals typically occur when RSI moves above 70 (overbought) and starts to turn down, or if it fails to hold above 50 during a bullish trend. Currently, it suggests buyers are active but not in full control.
How will the ongoing energy market disruptions affect BTCUSD this week?
Persistent disruptions in the Middle East, keeping Brent crude above $83.18, could fuel inflation concerns. This might pressure central banks to maintain a hawkish stance, potentially dampening risk appetite for assets like BTCUSD. Traders should watch for any shifts in market sentiment that correlate with energy price movements and Fed policy expectations.
Track markets in real-time
AI-powered analysis, technical indicators and real-time price data.
Join Our Telegram Channel
Breaking market news, AI analysis and trading signals instantly.
Join Channel