Trump, Iran and Hormuz: Brent Oil’s Double Bottom Could Be the Real Warning.
Oil traders are making a collective bet that may be the most consequential mispricing of the year. Despite a sequence of military escalations that reads like a geopolitical thriller, Brent crude is trading well below the psychologically significant $100 per barrel level. The market's implicit message is that diplomacy will prevail. The news from the Strait of Hormuz is telling a completely different story.
A Helicopter, a Blockade, and Markets That Are Not Listening
The triggering event was the downing of a US Army Apache helicopter near the Strait of Hormuz. Washington's response was immediate. President Donald Trump ordered targeted airstrikes against Iranian coastal surveillance radar installations and air defense batteries. Iran's Revolutionary Guard countered with a large-scale offensive, launching ballistic missiles and drone swarms at American military assets spread across the Gulf region.
The ripple effects spread quickly. Kuwait brought its national air defenses online to intercept threats approaching key military facilities. Bahrain sounded air raid sirens as Iranian strikes targeted sites linked to the US Fifth Fleet. What began as a bilateral US-Iran confrontation has since drawn multiple Gulf states into the crossfire.
The political dimension deteriorated just as fast. Trump publicly accused Tehran of deliberately running out the clock on ceasefire negotiations and made the provocative claim that Washington, not Tehran, controls the Strait of Hormuz. Iranian military commanders responded by issuing a formal declaration that the Strait is now closed to oil tankers and all commercial shipping, with warnings that vessels attempting passage could be fired upon.
If enforced, that declaration would represent the most serious threat to global energy transit in decades. And yet, Brent is not pricing that outcome. Prices are sitting far below the March peak near $120, and the market continues to trade as though diplomatic resolution is a matter of time rather than possibility.
What the Chart Is Quietly Telling You
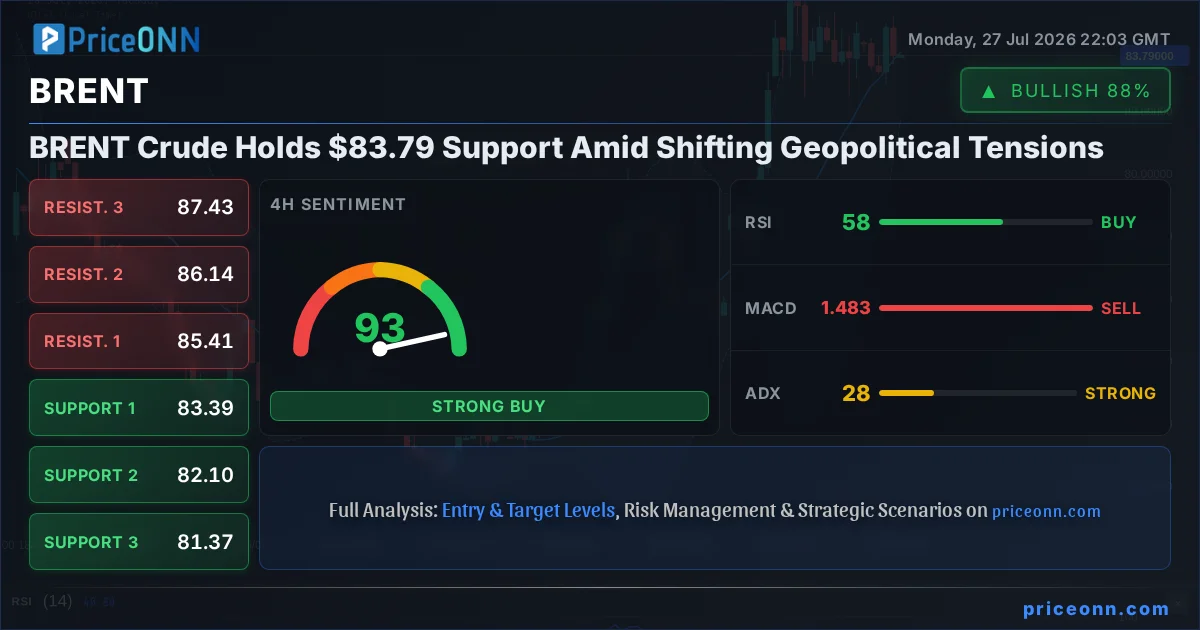
Brent crude extended its rebound after printing this week's low at $89.57, but the recovery has been hesitant. The upside is currently being capped by the 55-period 4-hour exponential moving average, now sitting at $94.89. Until that level is cleared convincingly, the short-term technical bias remains tilted to the downside.
A deeper technical story is forming beneath the surface. Brent has registered two consecutive lows in close proximity: an earlier base at $89.93 and the more recent print at $89.57. Together, these form the foundation of a potential double bottom pattern, one of the most widely tracked reversal setups in technical analysis.
Confirmation would require a sustained break above $98.99, a cluster resistance zone that aligns closely with the 38.2% Fibonacci retracement of the full decline from $115.30 to $89.57, calculated at $99.40. A decisive close above that band would validate the reversal and open a measured move toward the 61.8% retracement target at $105.47.
That threshold matters well beyond the oil market itself. A confirmed double bottom would signal that trader positioning is beginning to shift toward a longer-lasting supply disruption scenario. When professional capital starts repositioning for that outcome, the knock-on effects travel far beyond crude.
Reading Between the Lines
The central tension in this market is the gap between what geopolitical events are implying and what prices are currently reflecting. Gold has already absorbed some safe-haven demand but has not repriced to levels consistent with a genuine, sustained Hormuz crisis. The USD/CAD pair deserves close attention: a sustained crude rally would benefit Canada's energy export revenues, putting downward pressure on that currency pair. In equity markets, upstream energy names stand to gain while consumer-facing and transportation sectors face margin compression from higher fuel costs.
Central bank policy carries the broadest implication. Oil price surges are inherently inflationary, and a sustained move toward $105 or beyond would complicate rate-cut timelines across multiple major economies at once. Bond markets would need to reprice duration risk. The inflation narrative that many investors had been quietly shelving would return with force.
What separates this episode from previous Hormuz tension events is the combination of factors now simultaneously in play: an active military exchange, a formal closure declaration backed by enforcement language, and multiple Gulf states drawn into the conflict. Past episodes of tension typically lacked at least one of these elements.
The $94.89 EMA is the immediate pivot to watch. A sustained close above it would be an early signal that the market is beginning to close the gap between geopolitical risk and crude pricing. A rejection there keeps the short-term downward bias intact, but it does not resolve the pressure building in the double bottom base. The chart is asking the same question the news has been posing for 48 hours. When the answer arrives, it will move more than just oil.
Track markets in real-time
Empower your investment decisions with AI-powered analysis, technical indicators and real-time price data.
Join Our Telegram Channel
Get breaking market news, AI analysis and trading signals delivered instantly to your Telegram.
Join ChannelGold fell to 4,047 USD per ounce on Tuesday, erasing gains from the previous session. Pressure on the metal is mounting amid fears that the Federal Reserve may raise rates as early as this week. Markets currently estimate the probability of such a move on Wednesday at over 33% – an unusually high level of […] The post Gold Declines, Focus on Fed and Falling Oil Prices appeared first on ActionForex.
The de-escalation of the conflict in the Middle East has sent Brent prices tumbling. The oil market could return to a surplus as early as the end of 2026. The US dollar and oil have lost their correlation. Brent recorded its worst daily fall in three months after reports of a ceasefire in the Middle […] The post Oil: A Surplus on the Horizon appeared first on ActionForex.
(RTTNews) - Gold prices traded higher on Monday as oil prices tumbled amid eased Middle East tensions, helping ease inflation and interest-rate concerns ahead of crucial Fed, BoE and BoJ central bank meetings due this week.
Market Overview The crypto market trended lower at the end of Monday, mirroring the US equity market, as it fell from a peak of $2.23T to $2.16T before returning to recent local lows of $2.18T by Tuesday morning. This marks yet another test of the 50-day moving average (MA) as support, which sellers have been […] The post Bitcoin Has Failed to Break Away from Its Long-Term Trend appeared first on ActionForex.
I am already riding two EURUSD sell entries. Another possible sell opportunity could be forming for traders that are not in yet. EURUSD Possible Bearish Scenario Watch for price to tap 4 Hour FVG (Purple) first. Watch for a bearish shift and bearish reversal signs in the FVG zone. Wait for all above to play […] The post Riding EURUSD Sellside appeared first on ActionForex.
The Trump administration is weighing whether to extend access to some Chinese rare earth materials beyond the January 1, 2027 cutoff after U.S. producers acknowledged they cannot build sufficient domestic processing and magnet capacity before the deadline, Reuters reported on Monday. Industry executives and Pentagon suppliers told Reuters that U.S. processing and magnet manufacturing capacity remains insufficient to meet despite billions of dollars in federal support for new mines, separation...
The US stock market is not factoring in the existing risks. Investors are increasingly focusing on the cash flows of S&P 500 companies. US stock indices have closed in the red the last two weeks, something that hasn’t happened since March. The stock market has weathered both the armed conflict in the Middle East and […] The post It’s Time to Weigh Up the Risks for the S&P 500 appeared first on ActionForex.
The ceasefire in the Middle East has disrupted the greenback’s plans. Strong PMI data and falling oil prices are helping the euro. The US dollar faced a downward gap at the start of the week as the Middle East de-escalation of the conflict came as an unwelcome surprise to speculators who had built up net […] The post De-Escalation Undermines the Greenback appeared first on ActionForex.
The dollar heads into a pivotal week trading near 101.80, just off a 15-month high, with the Fed’s July 29 meeting standing as the clear focal point. Markets currently price roughly a 65% chance of a hold, though renewed Middle East escalation has kept a hike back on the table for later this year. Energy […] The post US Dollar Index: a Defining Week for the King of the Markets appeared first on ActionForex.
EUR/USD enters the final week of July at 1.1369. Friday’s modest decline in energy prices reduced expectations that the Federal Reserve could raise rates as early as its upcoming meeting, scheduled for Tuesday and Wednesday. At the same time, the main currency pair remains very close to the monthly low recorded in late June. Markets […] The post EUR/USD Ahead of a Key Week: Holding Near Lows appeared first on ActionForex.
European Central Bank Governing Council member Peter Kazimir from Slovak reinforced the hawkish bias on Monday, arguing that policymakers will likely need to raise interest rates at least once more and warning that a worsening energy shock could ultimately require even more tightening than markets currently anticipate. His remarks come just days after the ECB […] The post ECB’s Kazimir Sees At Least One More Rate Hike, Warns Oil Shock Could Require More appeared first on ActionForex.
On 21 July, Stats NZ reported an acceleration in inflation: the Consumer Price Index rose 1.5% in the second quarter, while the annual inflation rate climbed to 4.1%, its highest level in more than two years and slightly above analysts’ consensus forecast of 4.0%. The increase was driven primarily by higher fuel prices amid tensions […] The post NZD/USD: Inflation Surge Meets Strong US Dollar Pressure appeared first on ActionForex.