

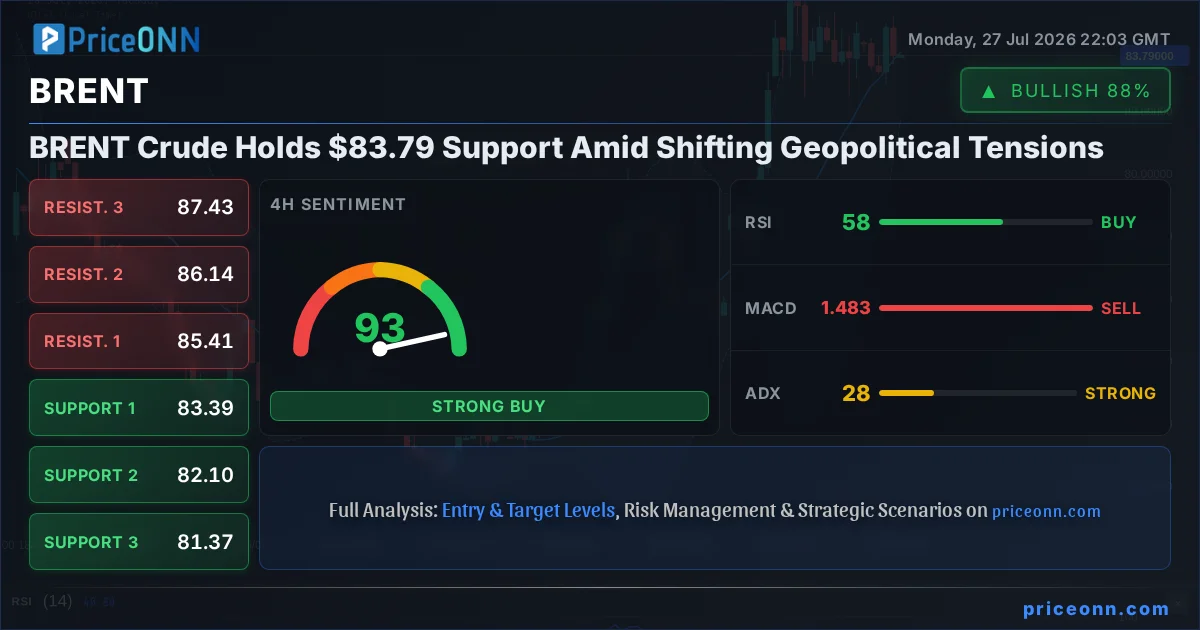
The global energy landscape is in constant flux, and the recent price action in BRENT Crude, currently hovering around the critical $83.79 mark, underscores this dynamic. While headlines often focus on supply and demand figures, the underlying currents of geopolitical maneuvering and macroeconomic policy are the true architects of sustained price trends. Recent developments, particularly the easing of US-Iran tensions and shifts in central bank rhetoric, are painting a complex picture for oil markets. Understanding these macro drivers is paramount for any trader navigating the volatile energy sector today.
- BRENT Crude is testing support near $83.79, with the 1H RSI at 49.74 indicating neutral momentum but a slight downtrend.
- Geopolitical shifts, including easing US-Iran tensions, are reducing immediate risk premiums, impacting oil prices.
- Central bank policy, especially from the ECB, signals continued hawkishness, potentially strengthening the USD and pressuring commodities.
- The DXY is currently at 100.7, showing a neutral-to-bullish trend on the 1H chart, which typically correlates with downward pressure on oil.
- While the 1D ADX for BRENT is 31.85 suggesting a strong uptrend, the short-term indicators and easing geopolitical fears warrant caution.
The narrative around oil prices has been heavily influenced by geopolitical risk premiums, especially concerning the Middle East. Reports suggesting a potential US-Iran truce, brokered by Pakistan, have led to a noticeable easing of tensions. This de-escalation, if sustained, directly impacts the immediate supply risk perception. When the market perceives a lower probability of supply disruptions, the 'fear premium' embedded in oil prices begins to erode. This is precisely what we're observing as European natural gas prices plunged and oil gave up earlier gains. Standard Chartered's analysis highlights that markets must now price in the reduced risk from two major chokepoints, suggesting that the immediate upward pressure on prices stemming from conflict fears is subsiding. This fundamental shift is crucial for understanding why BRENT is currently finding itself near support levels, rather than pushing higher on speculative anxieties.
However, the story doesn't end with geopolitical detente. Macroeconomic factors, particularly inflation and central bank policy, are exerting significant influence. The recent surge in New Zealand's inflation, with the CPI rising 1.5% in Q2, serves as a stark reminder that inflationary pressures remain a global concern. This is particularly relevant for oil, a key component of inflation baskets. While easing geopolitical risks might temper immediate price spikes, persistent underlying inflation can still support commodity prices. The European Central Bank's (ECB) hawkish stance, with Governing Council member Peter Kazimir indicating at least one more rate hike, adds another layer of complexity. A stronger Eurozone monetary policy typically strengthens the Euro, but it also signals a commitment to fighting inflation, which could dampen economic growth expectations. This, in turn, can reduce future demand for oil, creating a counterbalancing force to supply-side stability.
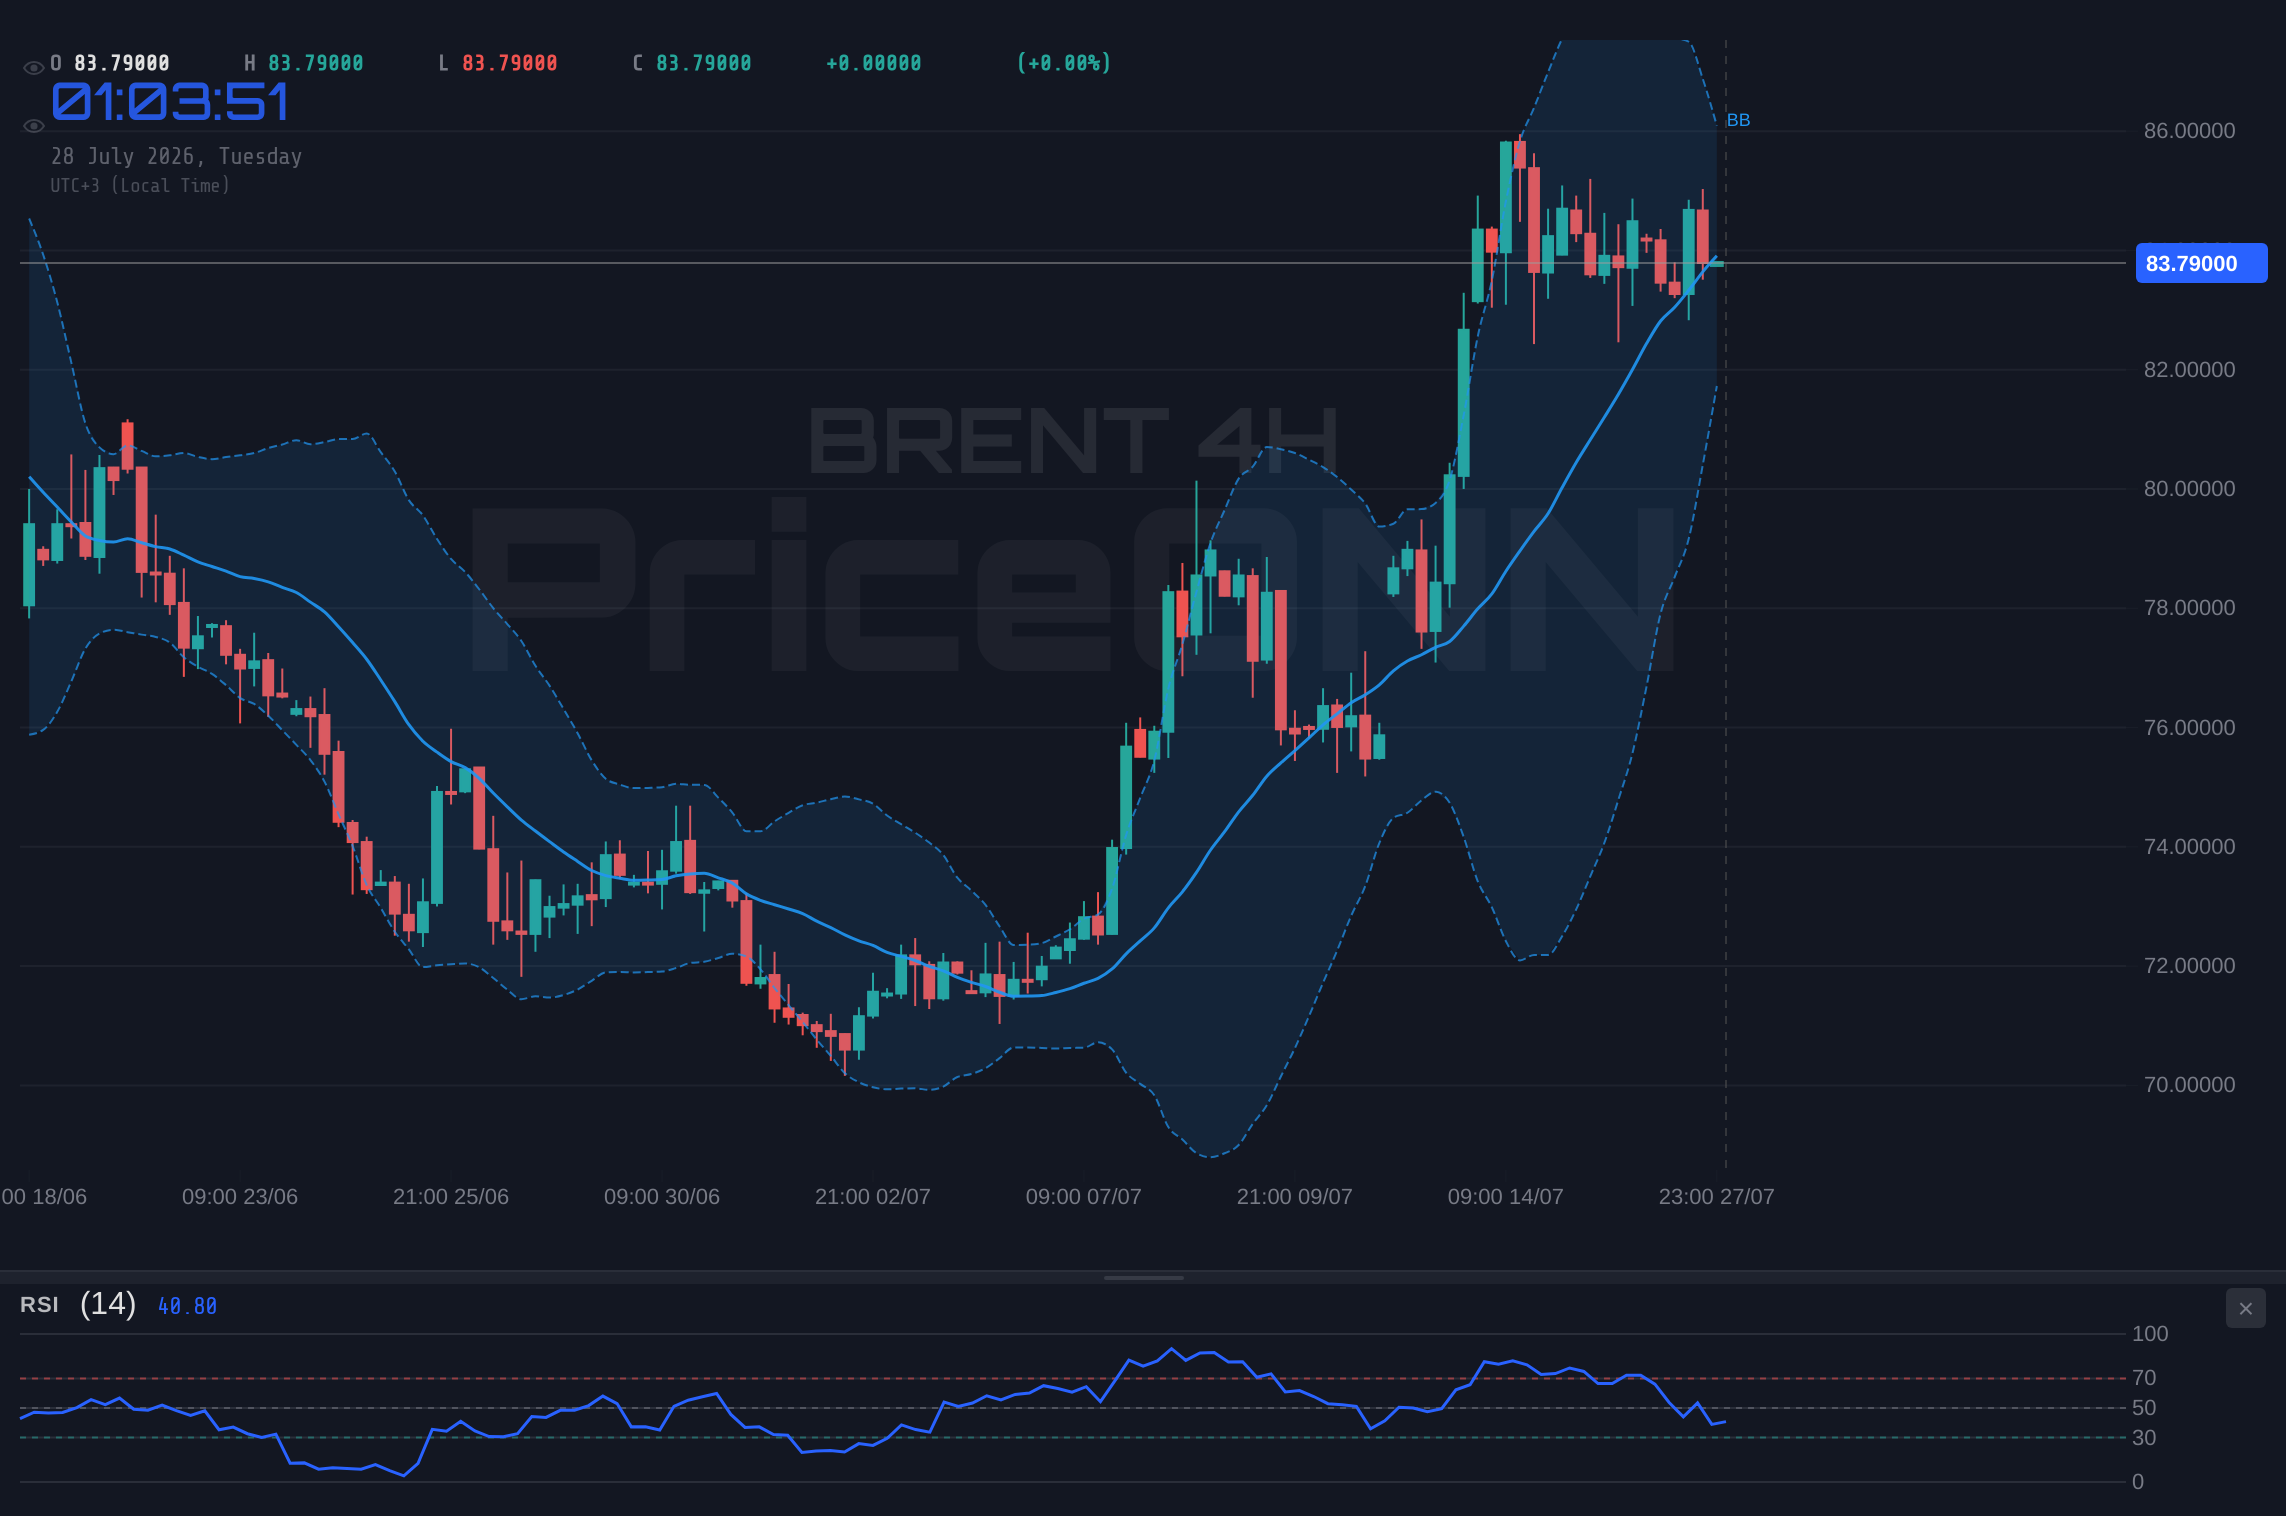
The interplay between these factors is clearly reflected in the technical indicators for BRENT. On the 1-hour chart, BRENT Crude is trading at $83.79. The RSI(14) stands at 49.74, firmly in neutral territory but showing a slight downtrend, suggesting a lack of strong buying conviction. The ADX at 11.13 indicates a weak trend, suggesting consolidation or a potential reversal rather than a continuation of a strong directional move. The MACD is showing positive momentum, but it's below the signal line, indicating some underlying selling pressure. Similarly, the Stochastic oscillator's K line (43.33) is below its D line (59.32), signaling a bearish inclination on this short-term timeframe. These indicators collectively suggest that while the price is holding near support, the immediate momentum isn't strongly bullish, reflecting the mixed fundamental signals.
Looking at the 4-hour timeframe, the picture becomes slightly more nuanced. The ADX at 27.68 suggests a stronger uptrend compared to the 1-hour chart. The RSI(14) at 58.18 is moving higher, indicating increasing bullish sentiment. The MACD is negative but showing signs of shifting, and the Stochastic is K=53.04, D=47.99, a bullish crossover. The Bollinger Bands are above the middle band, also hinting at upward momentum. This timeframe's indicators suggest that underlying demand might be present, potentially anticipating future price appreciation. This is where the 'trader's perspective' comes into play: short-term signals might show hesitation, but the medium-term trend indicators on the 4H chart hint at potential resilience. It’s a classic case of conflicting signals across different timeframes, demanding a careful approach.
The daily chart provides a broader context, revealing a more robust bullish inclination despite the current price consolidation. The ADX at 31.85 confirms a strong uptrend on the daily scale. The RSI(14) at 54.4 is in neutral territory but trending upwards, indicating room for further gains. The MACD is positive and above its signal line, reinforcing the bullish momentum. Stochastic K=88.3, D=79.63 shows an overbought condition, which in a strong uptrend can persist, but also warns of potential pullbacks. The Bollinger Bands are above the middle band, aligning with the bullish trend. This daily view suggests that the current dip near $83.79 might be a temporary pause within a larger upward trajectory, provided key support levels hold.
The correlation with other markets is also a critical piece of the puzzle. The US Dollar Index (DXY) is currently at 100.7. On the 1-hour chart, it shows a neutral-to-bullish trend with RSI at 56.6 and Stochastic in the overbought zone. A strengthening dollar typically exerts downward pressure on dollar-denominated commodities like BRENT. This inverse correlation is a consistent theme; as the dollar firms up, the cost of oil in other currencies rises, potentially dampening demand. The DXY's current positioning suggests it could be a headwind for oil prices in the short term, adding another layer of complexity to the bullish case suggested by the daily BRENT chart. Traders must watch the DXY closely; a sustained rise here could cap any upside for BRENT, even if geopolitical risks were to re-emerge.
Equities also play a role in the risk appetite narrative. The SP500 is trading at 6572.87, showing a strong daily uptrend (ADX 47.51) but mixed signals on shorter timeframes. The Nasdaq 100, currently at 29164.86, is showing a clear downtrend on the 1H and 4H charts, with RSI below 40. This divergence in equity markets - a strong daily SP500 versus a weaker Nasdaq on shorter terms - creates uncertainty. Generally, a risk-off sentiment in equities, particularly in growth-sensitive tech stocks like those in the Nasdaq, can spill over into commodities, reducing demand. However, the strength in the SP500's daily trend suggests that broad market risk appetite isn't collapsing entirely. This mixed equity signal adds to the indecision currently reflected in BRENT's short-term technicals.
The price action around the $83.79 level for BRENT Crude is significant. Support levels identified on the 1H chart are 83.44, 83.18, and 82.85. On the 4H chart, these are 83.39, 82.10, and 81.37. The daily support levels are 82.90, 81.31, and 80.16. The current price of $83.79 is holding above the immediate 1H support but is not far from it. A break below the 4H support at $83.39 would signal a more significant bearish move, potentially targeting the $82.10 area. Conversely, if BRENT can hold above $83.79 and reclaim the $84.03 resistance on the 1H chart, it could signal a short-term bounce. The confluence of support zones between the 1H and 4H charts around the $83.30-$83.40 area is a crucial area to watch.
Looking ahead, several factors will shape the trajectory of BRENT Crude. The ongoing geopolitical situation in the Middle East remains a wild card; any resurgence in tensions could quickly reignite supply risk premiums. Simultaneously, central bank communications regarding inflation and interest rate policy will be critical. If inflation proves persistent, central banks might adopt more aggressive stances, potentially dampening global growth and oil demand. Conversely, signs of inflation cooling could lead to a more dovish pivot, supporting economic activity and oil demand. The market is also closely watching production levels from OPEC+ and other major producers, as any shifts in output could significantly impact the supply-demand balance. The current technical picture suggests consolidation around $83.79, but the fundamental backdrop is ripe for volatility.
For traders, the current environment demands a strategic approach. The conflicting signals across different timeframes - bullish on the daily, neutral-to-bearish on the hourly - necessitate patience. A break below the $83.39 support on the 4H chart could initiate a move towards $82.10, offering a bearish trading opportunity if confirmed by volume and momentum. On the upside, a decisive close above the 1H resistance at $84.03, followed by a push above the $85.03 daily high, could signal a resumption of the bullish trend, targeting higher levels. The key is to wait for confirmation, manage risk diligently, and avoid premature entries in this uncertain market. The $83.79 level serves as a crucial pivot point; its defense or failure will likely dictate the near-term direction.
The market sentiment, as indicated by the overall signal across timeframes, leans towards caution. While the daily chart shows a strong uptrend (ADX 31.85), the hourly and 4-hour charts present a more mixed to bearish outlook, with several 'SELL' signals dominating. This divergence suggests that short-term traders might be taking profits or hedging against upside risk, even as longer-term investors maintain a bullish bias. This is a typical scenario when significant macro events are on the horizon or when geopolitical risks are receding but not entirely gone. The lack of strong conviction across all timeframes means that the $83.79 support level is being tested under pressure, and its resilience will be key in determining the next significant move.
The economic calendar for the upcoming week holds several key events that could influence BRENT's price. While specific dates weren't provided in the market data, typical high-impact releases such as US Non-Farm Payrolls (NFP), CPI figures from major economies, and PMI data will be closely scrutinized. Stronger-than-expected economic data, especially from the US, could reinforce the bullish dollar trend and pressure oil. Conversely, weaker data might signal a global economic slowdown, reducing oil demand expectations. Furthermore, any updates from OPEC+ regarding production quotas or adherence will be paramount. The market's reaction to these events will likely determine whether BRENT can sustain its position above $83.79 or succumbs to bearish pressures.
The current technical setup around $83.79 presents a classic risk/reward scenario. For bullish traders, the ideal entry would likely occur on a confirmed bounce from this support, targeting resistance levels above $84.03 and potentially aiming for the $85.00 psychological level and beyond. The invalidation point would be a decisive close below the $83.39 4H support. For bearish traders, a breakdown below $83.39 would be the trigger, with targets at $82.10 and $80.16. The neutral scenario involves continued trading within the current range, perhaps between $83.00 and $84.50, until a clearer fundamental catalyst emerges. Given the conflicting signals, a patient, data-driven approach is essential. The market is currently digesting easing geopolitical fears against persistent inflation concerns and central bank policy tightening, making $83.79 a pivotal level to monitor.
Frequently Asked Questions: BRENT Analysis
What happens if BRENT breaks below the $83.39 support level?
A break below the $83.39 support on the 4-hour chart would invalidate the current bullish bias and likely trigger a move towards the next significant support at $82.10. This scenario would be confirmed by increasing bearish momentum and volume, suggesting that the easing geopolitical tensions are having a more pronounced impact on prices.
Should I buy BRENT at current levels of $83.79 given the mixed signals?
Entering a long position at $83.79 requires caution due to conflicting short-term technical indicators and a strengthening DXY. A more prudent approach would be to wait for confirmation, such as a decisive close above $84.03 resistance on the 1H chart, or a clear bounce from the $83.39 4H support with bullish momentum.
Is the RSI at 49.74 a sell signal for BRENT right now?
An RSI of 49.74 on the 1-hour chart is considered neutral territory, but its slight downtrend indicates a lack of buying conviction. It is not a direct sell signal on its own, but coupled with other bearish indicators like the Stochastic crossover and the weakening geopolitical risk premium, it contributes to a cautious short-term outlook.
How will upcoming economic data releases affect BRENT Crude this week?
Upcoming data like US NFP and CPI figures will be crucial. Stronger data could bolster the USD, pressuring BRENT lower, while weaker data might signal economic slowdown, also potentially hurting oil demand. Traders should monitor these releases closely as they could provide the catalyst needed to break the current consolidation around $83.79.
Track markets in real-time
AI-powered analysis, technical indicators and real-time price data.
Join Our Telegram Channel
Breaking market news, AI analysis and trading signals instantly.
Join Channel