

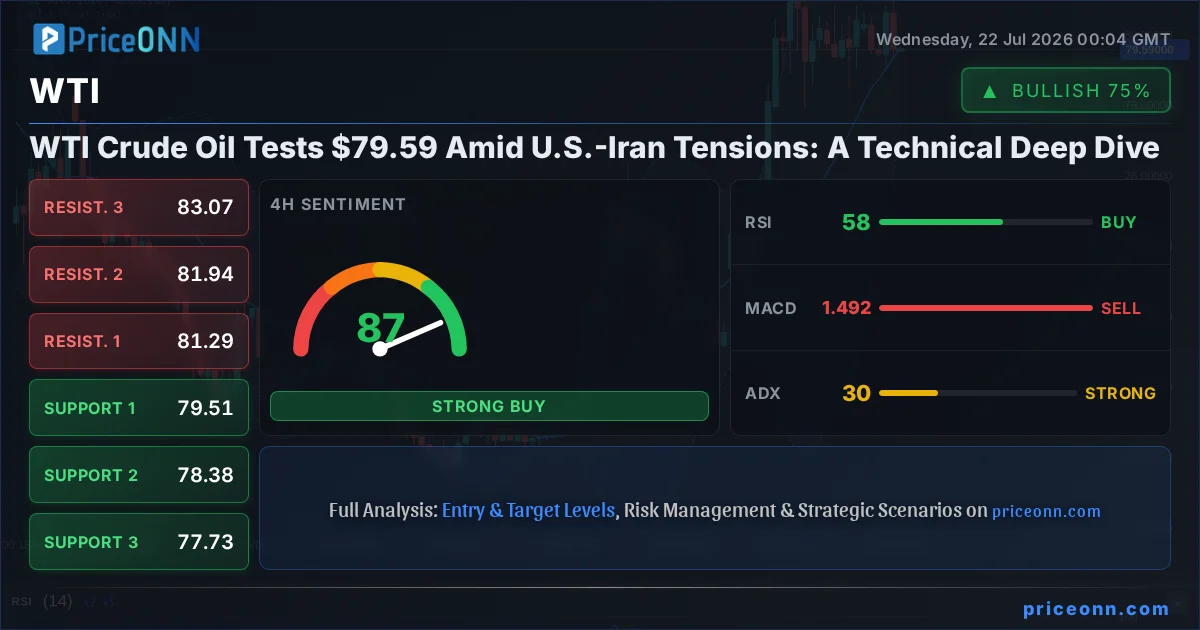
The delicate balance of global energy markets is once again being tested, with WTI Crude Oil finding itself at a critical juncture around the $79.59 mark. Renewed geopolitical tensions, particularly between the U.S. and Iran, have injected a significant dose of volatility, pushing oil prices higher as traders price in potential supply disruptions. This isn't just a headline-driven spike; the underlying technical indicators and market structure are painting a complex picture that demands careful analysis. As senior master teacher and forensic expert witness in energy systems, I'll break down the infrastructure-first perspective, dissecting the technical chart patterns, indicator readings, and crucial support and resistance levels that traders must watch. Understanding these dynamics is key to navigating the current choppy waters and identifying potential opportunities amidst the uncertainty.
- WTI Crude Oil is trading at $79.59, influenced by escalating U.S.-Iran geopolitical tensions.
- Critical support for WTI is identified at $79.23, with resistance looming at $79.83 on the 1H chart.
- ADX at 10.18 suggests a weak trend on the 1H timeframe, indicating potential for range-bound movement despite geopolitical news.
- The 4H chart shows a stronger bullish trend (ADX 30.49) with a bullish signal from Stochastic, suggesting potential upside if key levels hold.
- Daily indicators present a mixed outlook, with a neutral trend but positive momentum signals from MACD and Stochastic, pointing to potential upside continuation if key resistance is cleared.
Navigating Geopolitical Storms: The U.S.-Iran Dynamic
The recent uptick in WTI Crude Oil prices, bringing it to $79.59, is inextricably linked to the escalating rhetoric and heightened military posture between the United States and Iran. The Middle East remains a critical chokepoint for global oil supply, and any perceived threat to stability in this region sends ripples through commodity markets. Traders and analysts are closely monitoring developments, as a significant disruption to oil flow from the Persian Gulf could dramatically alter supply-demand dynamics, potentially sending prices soaring. This geopolitical risk premium is a well-understood factor in energy markets, and its re-emergence is a primary driver behind the current upward pressure on WTI. From an infrastructure perspective, the sheer volume of crude oil passing through the Strait of Hormuz means that even the *threat* of conflict can cause significant price swings, irrespective of actual supply loss. The market's reaction is often preemptive, anticipating the worst-case scenario.
The current price of $79.59 reflects this heightened tension, but it's crucial to understand that this level is also a technical battleground. The 1-hour chart shows a neutral trend with a weak ADX reading of 10.18, suggesting that while the news is pushing prices up, the underlying trend momentum on this short timeframe is not yet strong. This dichotomy between geopolitical news flow and short-term technical weakness highlights the intraday trading complexities. However, the 4-hour chart presents a different narrative, with an ADX of 30.49 indicating a stronger trend, albeit still classified as 'strong' rather than 'very strong'. The Stochastic indicator on this timeframe is also showing a bullish signal (%K > %D), which aligns with the news-driven price action. This divergence in trend strength across different timeframes is a key element to watch for traders attempting to position themselves.
Technical Underpinnings: What the Charts Tell Us About WTI at $79.59
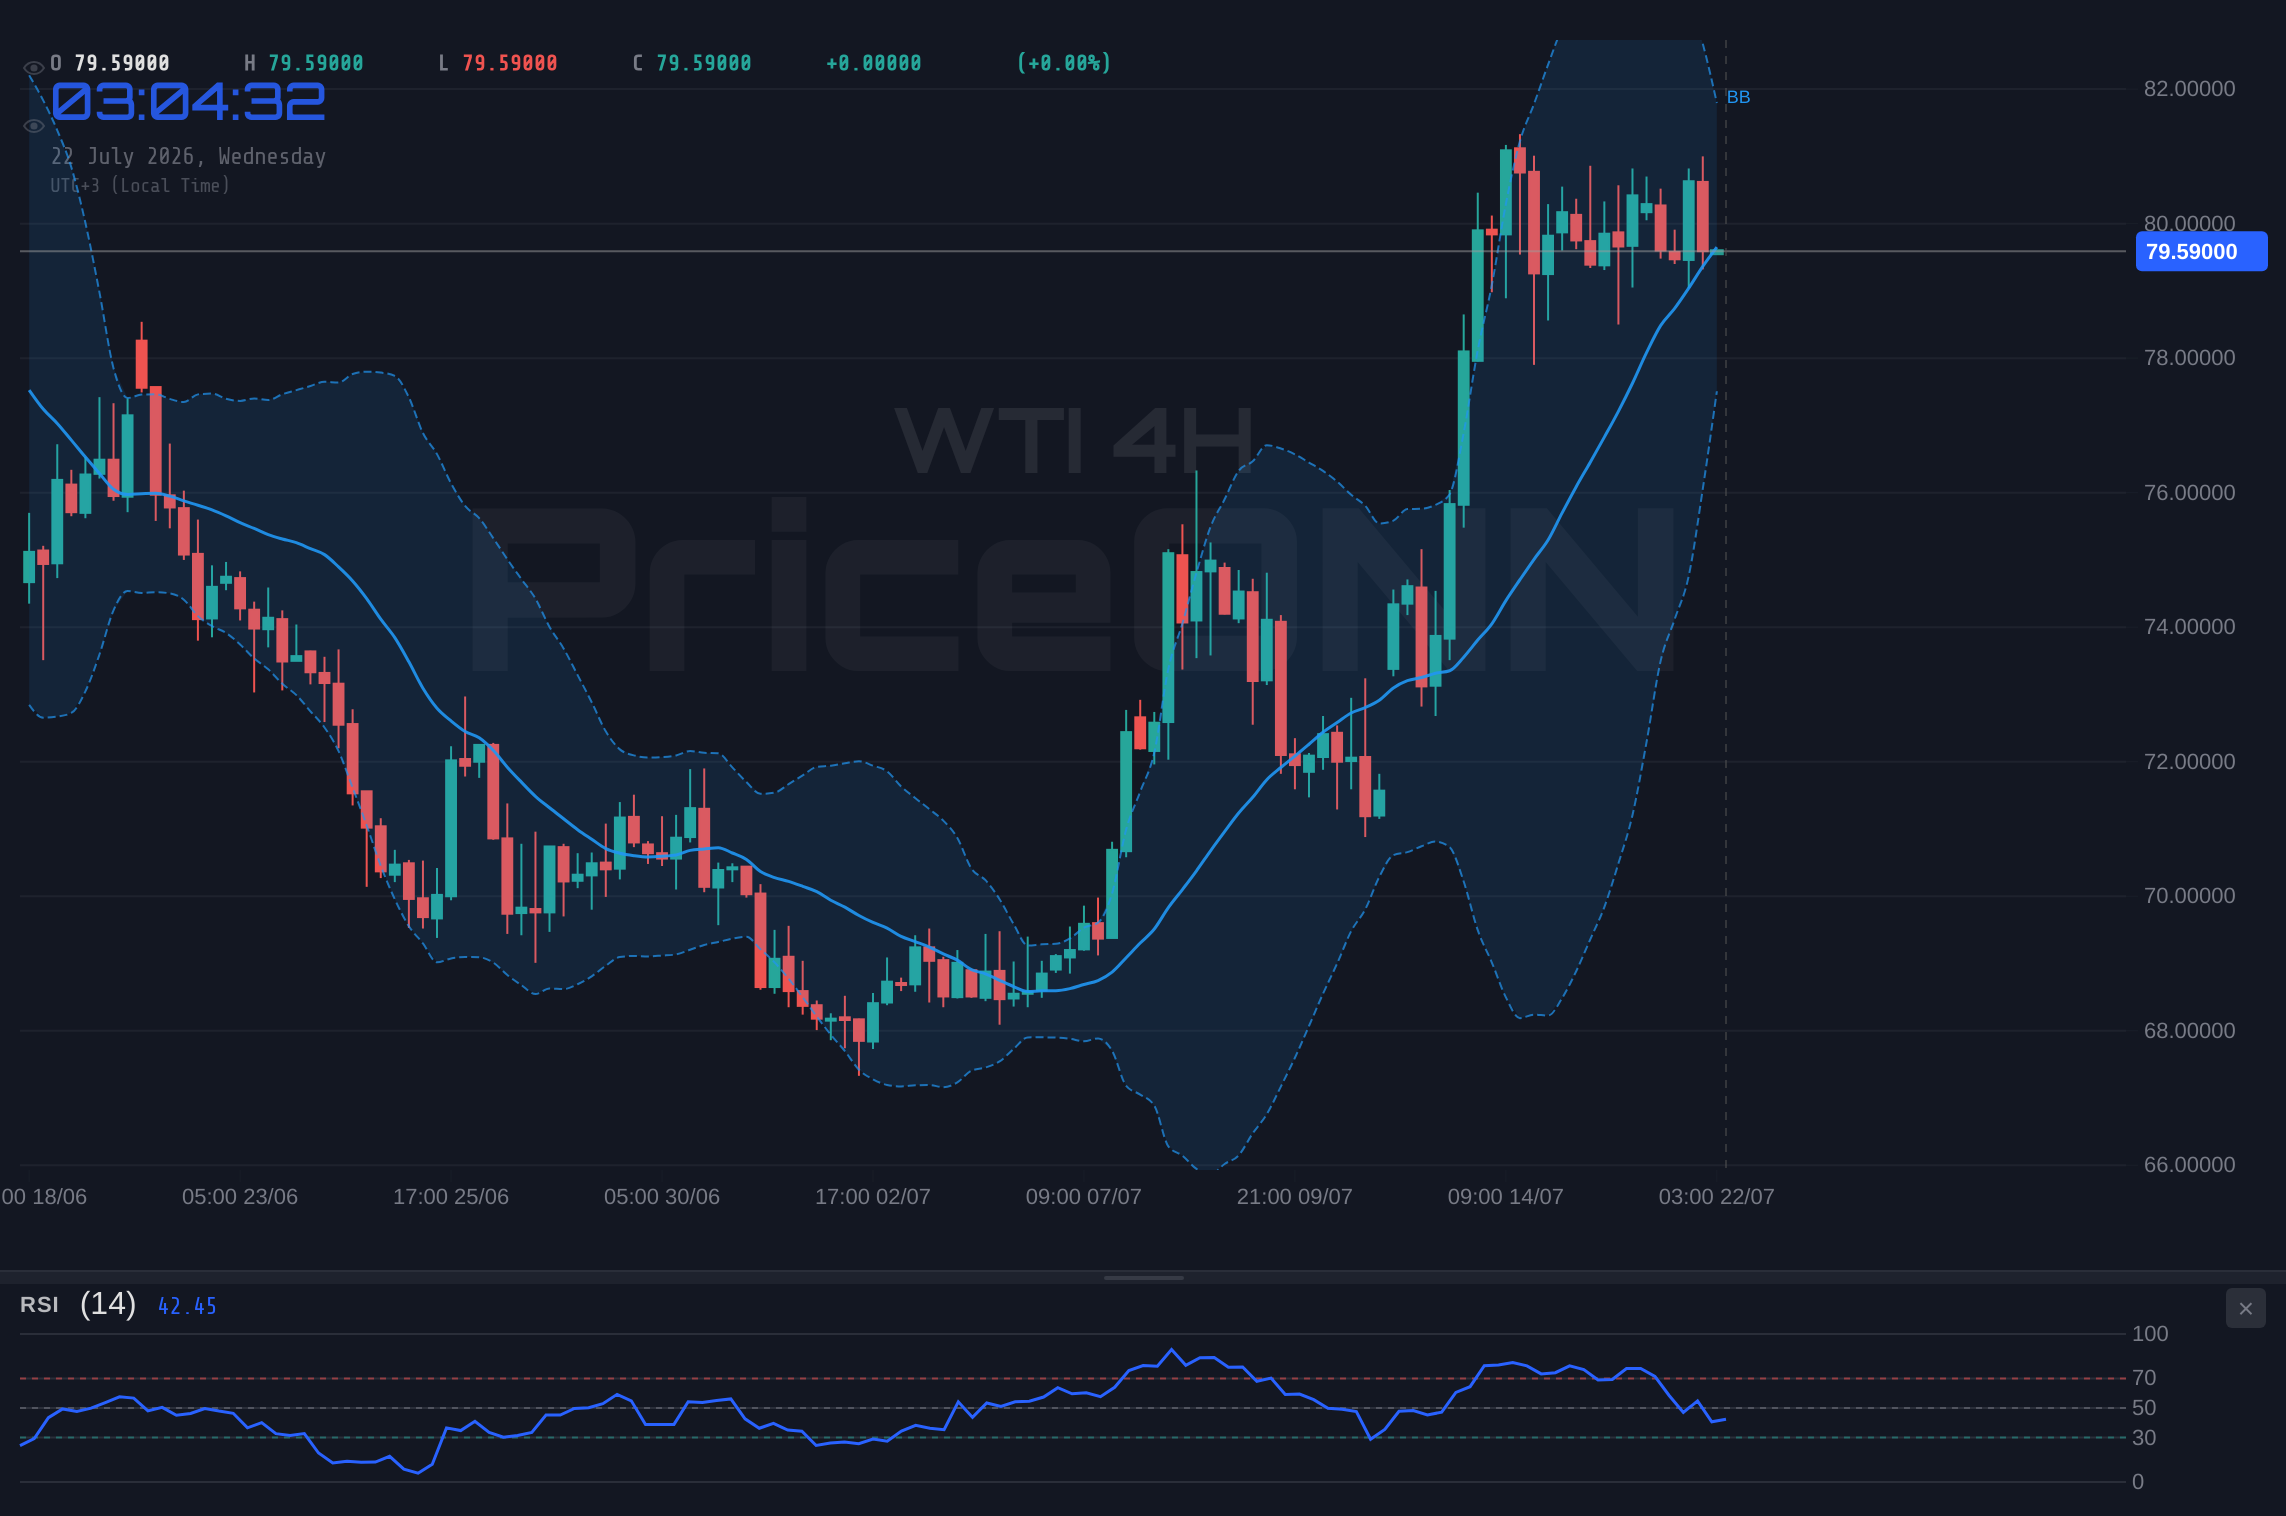
Delving deeper into the technicals, the WTI Crude Oil chart at $79.59 reveals a multi-faceted picture across different timeframes. On the 1-hour chart, the trend is neutral, with a weak ADX of 10.18 suggesting a lack of sustained directional momentum. However, the Stochastic indicator is flashing a bullish signal (%K > %D), and the MACD shows positive momentum, albeit with the histogram below the signal line. Support is seen at $79.23 and $78.97, while resistance is forming around $79.83 and $80.17. This suggests that while headlines might be pushing prices up, the immediate intraday trend is consolidating, waiting for a clearer signal or catalyst. It's a classic case of 'news-driven price action' meeting 'technical indecision' on the shortest timeframes.
The 4-hour timeframe paints a more constructive picture for the bulls. Here, the trend is identified as 'strong' with an ADX of 30.49. The Stochastic is bullish (%K > %D), and the MACD shows positive momentum. Support levels are located at $79.51 and $78.38, with resistance at $81.29 and $81.94. This timeframe suggests that the underlying momentum, potentially fueled by the geopolitical news, is building. The divergence between the weak 1H trend and the stronger 4H trend is significant. It implies that the current price action might be the beginning of a more sustained move, provided the price can overcome the immediate intraday resistance.
On the daily chart, the picture becomes more nuanced. The trend is still classified as neutral (50% strength), but the ADX at 29.46 indicates a moderately strong trend, leaning towards the 'strong' category. The RSI at 53.65 sits comfortably in the neutral zone, showing no signs of overbought or oversold conditions, which is healthy for a potential continuation. The MACD shows positive momentum, and the Stochastic is firmly in overbought territory (K=89.73, D=76.8) with a bullish signal (%K > %D). Bollinger Bands are above the middle band, indicating an upward bias. Key support on the daily chart lies at $78.99 and $77.57, while resistance is observed at $81.35 and $82.29. This daily outlook suggests that while short-term consolidation might occur, the longer-term bias leans towards upside potential if the current bullish signals on the 4H and daily charts can overcome the neutral short-term trend.
Correlation Analysis: DXY, Equities, and the Oil Price Nexus
Understanding WTI's price action at $79.59 requires looking beyond the immediate commodity itself and examining its correlations with broader market indices. The Dollar Index (DXY) is a crucial element here. Currently, DXY is trading at 100.70, showing a mixed picture across timeframes: bullish on 1H, neutral on 1D, and bearish on 4H. Generally, a strengthening dollar tends to put downward pressure on dollar-denominated commodities like WTI, as they become more expensive for holders of other currencies. However, the current geopolitical risk narrative can sometimes override this inverse correlation. If the U.S. is seen as a safe haven amid global instability, both the dollar and oil might rise simultaneously, creating an unusual market condition. The DXY's current neutral-to-mixed signals suggest it's not a strong headwind or tailwind for WTI at this precise moment, allowing the geopolitical drivers to take center stage.
Equities, represented by the S&P 500 (SP500) and Nasdaq 100 (Nasdaq), offer another layer of insight. The SP500 is showing a strong bullish trend on the 1H and 4H charts but a bearish trend on the daily, currently trading at 6572.87. The Nasdaq, meanwhile, is exhibiting a bearish trend across all timeframes, currently at 29164.86. This divergence, particularly the weakness in tech-heavy Nasdaq, suggests a potential decline in overall market risk appetite. Typically, a 'risk-off' environment would see investors flee riskier assets like commodities and equities for safer havens like the dollar or gold. However, in this specific scenario, the geopolitical risk tied to oil supply might be creating a 'risk-on' sentiment specifically for energy markets, even as other risk assets falter. This decoupling is noteworthy and suggests that the oil market is currently driven by supply-side fears rather than broad market sentiment alone.
The interplay between these correlated assets is complex. The fact that WTI is showing upward momentum despite some equity weakness and mixed dollar signals underscores the potency of the U.S.-Iran tensions. Traders must remain attuned to how these correlations evolve. A sustained drop in equities coupled with a strengthening DXY would typically signal trouble for WTI, even with geopolitical jitters. Conversely, if the geopolitical situation deteriorates significantly, we might see both equities and the dollar weaken as safe-haven demand shifts towards gold, while oil prices surge due to supply fears. The current market is a delicate balancing act, where specific supply-side shocks can temporarily decouple an asset from its usual correlative relationships.
Fundamental Drivers: Beyond the Headlines
While the immediate catalyst for WTI’s move to $79.59 is undoubtedly the U.S.-Iran geopolitical situation, a deeper look at fundamental supply and demand factors provides crucial context. OPEC+ continues to manage global supply through production quotas, aiming to balance the market and support prices. Their adherence to these cuts, and any potential adjustments, remain a key variable. Recent reports indicate continued compliance from major producers, which helps to underpin prices by limiting the amount of crude entering the market. This proactive supply management is a structural factor supporting oil prices, acting as a floor beneath which prices are less likely to fall significantly, barring a major demand shock.
On the demand side, global economic growth prospects play a vital role. While the equity markets show some divergence, the overall health of major economies, particularly China and the United States, influences oil consumption. Indicators like PMI data, industrial production figures, and consumer spending habits are closely watched. Currently, there are mixed signals: some economies show resilience, while others face headwinds from inflation and higher interest rates. The International Energy Agency (IEA) and OPEC regularly publish demand forecasts, and any significant revisions to these outlooks can impact market sentiment. For instance, stronger-than-expected economic data from China could boost demand forecasts, providing further support to WTI prices, while a global recessionary scare would have the opposite effect.
Furthermore, the strategic petroleum reserves (SPR) held by various nations, including the U.S., can act as a buffer against supply shocks. Decisions to release oil from these reserves can temporarily increase supply and cap price rallies. Conversely, the decision not to release, or to refill reserves, can support prices. Understanding the inventory levels reported weekly by the Energy Information Administration (EIA) is therefore critical. Unexpected builds in crude oil inventories can signal weakening demand or oversupply, while draws suggest robust consumption or tight supply, both of which influence WTI's trajectory beyond the immediate geopolitical headlines. The current price at $79.59 is a confluence of these immediate geopolitical fears layered upon a fundamental backdrop of managed supply and fluctuating demand expectations.
Trade Scenarios: Navigating the $79.59 Level
Given the current technical and fundamental landscape for WTI Crude Oil around $79.59, several trading scenarios emerge. The market is exhibiting a conflict between short-term indecision and a potentially building medium-term bullish momentum, all amplified by geopolitical risk. This creates a complex trading environment where patience and precise level-watching are paramount.
Bearish Scenario: Geopolitical Risk Fades
25% ProbabilityNeutral Scenario: Consolidation Around $79.59
35% ProbabilityBullish Scenario: Supply Fears Intensify
40% ProbabilityThe probabilities assigned reflect the current balance of factors. While geopolitical tensions are a potent short-term driver, the underlying technical picture on the daily chart offers room for upside if these fears are sustained or amplified. The neutral scenario acknowledges the possibility of range-bound trading as the market digests conflicting signals. A decisive break above the $81.35 daily resistance, especially on increased volume and confirmed by positive momentum indicators, would strongly favor the bullish scenario. Conversely, a failure to hold the $78.99 support level, particularly on the daily chart, would likely invalidate the bullish case and open the door for further downside, aligning with the bearish scenario.
Expert Witness Perspective: Infrastructure and Regulatory Signals
From my vantage point as an expert witness specializing in energy infrastructure, the current price action at $79.59 for WTI Crude Oil is more than just a number on a screen. It reflects the real-world vulnerabilities of global energy supply chains. The Strait of Hormuz, a critical artery for oil transport, is a constant geopolitical flashpoint. Any instability there has immediate and significant implications for infrastructure security and, consequently, price. Decisions made by entities like OPEC+ regarding production levels are not arbitrary; they are strategic responses to market conditions, designed to ensure producers receive a fair return while managing the delicate balance of global supply. Their continued adherence to cuts provides a baseline of support, making substantial price drops less likely unless demand falters dramatically or geopolitical risks evaporate.
Regulatory frameworks also play a crucial role. For instance, decisions regarding the release or refilling of Strategic Petroleum Reserves (SPR) can directly impact market dynamics. While not currently a major factor driving prices at $79.59, the capability and willingness of governments to use these reserves as a tool to stabilize markets remain a background consideration. Furthermore, environmental regulations and the ongoing energy transition, while longer-term factors, are subtly influencing investment in new oil production capacity. Potential underinvestment in traditional energy infrastructure due to the focus on renewables could, paradoxically, exacerbate supply tightness in the future, making geopolitical risks even more impactful on prices. Traders must therefore look beyond the immediate news cycle and consider these structural underpinnings.
The current situation highlights how sensitive the energy market remains to geopolitical shocks. The infrastructure itself – pipelines, refineries, shipping routes – is the physical backbone that the price reflects. When that backbone is perceived to be under threat, prices react sharply. My experience in industrial systems teaches that physical infrastructure constraints and vulnerabilities are primary drivers of market behavior, often more so than abstract financial indicators. Therefore, while technical analysis provides invaluable tools for timing and risk management, a fundamental understanding of the energy infrastructure's resilience and the regulatory environment governing it is essential for a complete market perspective.
Market Sentiment and Trader Positioning
Assessing market sentiment and trader positioning provides another vital layer to the WTI analysis around $79.59. While specific Commitment of Traders (COT) data for the latest reporting week might not be immediately available, general observations from recent price action and indicator readings can offer clues. The mixed signals across different timeframes suggest a degree of uncertainty among market participants. The neutral trend on the 1H chart, despite bullish news, might indicate caution among short-term traders, perhaps waiting for confirmation before committing significant capital. Conversely, the stronger bullish signals on the 4H and daily charts, coupled with the geopolitical risk premium, suggest that longer-term players or those focused on supply-side dynamics might be leaning towards a bullish outlook.
The RSI readings are particularly telling. On the 1H chart, RSI is at 46.91, indicating a neutral stance with a slight downward bias. The 4H RSI at 58.47 is in the upper-neutral zone, suggesting upward momentum is present but not yet overheated. The daily RSI at 53.65 further reinforces this picture of a market that has room to move higher without immediately entering overbought territory. This lack of extreme RSI readings (above 70 or below 30) on the longer timeframes suggests that the current move might have legs, provided the bullish catalysts remain in play. It implies that the market isn't yet in a state of euphoria or panic, allowing for more rational price discovery.
The Stochastic indicators also offer insights. While the 1H Stochastic shows a bullish crossover, the 4H and daily charts show Stochastic lines moving higher but with varying degrees of strength and potential divergence. The daily Stochastic, in particular, is in overbought territory (K=89.73), which, while showing strong upward momentum, also raises a flag for potential short-term pullbacks or consolidation. This suggests that while the overall sentiment might be leaning bullish due to geopolitical factors, traders should be mindful of potential profit-taking or exhaustion points, especially if prices push higher without corresponding strength in other indicators or a clear fundamental catalyst beyond the immediate tensions.
Frequently Asked Questions: WTI Analysis
What happens if U.S.-Iran tensions escalate further, pushing WTI above $81.35?
If geopolitical tensions significantly escalate and WTI breaks convincingly above the $81.35 daily resistance level, the bullish scenario becomes highly probable. This could trigger a rapid move towards the next resistance at $82.29, as supply disruption fears intensify and traders rush to secure barrels amidst perceived scarcity.
Is the current RSI at 53.65 on the daily chart a buy signal for WTI at $79.59?
An RSI of 53.65 on the daily chart is not a direct buy signal in itself, but it indicates healthy upward momentum without being overbought. It suggests that the market has room to move higher, supporting a bullish outlook if other factors like demand and geopolitical risk remain favorable.
How will the weak ADX reading of 10.18 on the 1H chart affect WTI's price around $79.59?
The weak ADX of 10.18 on the 1H chart suggests a lack of strong directional trend on this short timeframe. This implies that despite the geopolitical news, intraday trading might be range-bound or consolidating, with potential for choppiness until a clearer trend emerges or a significant breakout occurs.
How might upcoming inventory data impact WTI's price following the U.S.-Iran tensions?
Upcoming EIA inventory data is crucial. A significant build in crude oil stockpiles could counter the bullish geopolitical narrative, potentially leading to profit-taking and a move towards support levels like $79.23. Conversely, a larger-than-expected draw would reinforce supply concerns and support prices above $79.59.
| Indicator | Value | Signal | Interpretation |
|---|---|---|---|
| RSI (14) | 46.91 | Neutral | Neutral momentum on 1H, 58.47 on 4H, 53.65 on 1D - room to move. |
| MACD | Neg Momentum | Bearish | Mixed signals: Positive on 1H/1D, but negative momentum on 4H. |
| Stochastic | 28.74 / 52.74 | Bearish | Bullish crossover on 1H, but 4H/1D showing potential pullback or consolidation. |
| ADX | 10.18 | Neutral | Weak trend on 1H (10.18), strong on 4H (30.49), moderate on 1D (29.46). |
| Bollinger Bands | Lower Band | Bearish | 1H below middle band; 4H/1D above middle band - suggests potential consolidation or upward bias. |
Track markets in real-time
AI-powered analysis, technical indicators and real-time price data.
Join Our Telegram Channel
Breaking market news, AI analysis and trading signals instantly.
Join Channel